http://www.diva-portal.org
This is the published version of a paper published in BMC Medicine.
Citation for the original published paper (version of record):
Aleksandrova, K., Pischon, T., Jenab, M., Bueno-de-Mesquita, H., Fedirko, V. et al. (2014)
Combined impact of healthy lifestyle factors on colorectal cancer: a large European cohort study.
BMC Medicine, 12(1): 168
http://dx.doi.org/10.1186/s12916-014-0168-4
Access to the published version may require subscription.
N.B. When citing this work, cite the original published paper.
Permanent link to this version:
R E S E A R C H A R T I C L E
Open Access
Combined impact of healthy lifestyle factors on
colorectal cancer: a large European cohort study
Krasimira Aleksandrova
1*, Tobias Pischon
2, Mazda Jenab
3, H Bas Bueno-de-Mesquita
4,5,6, Veronika Fedirko
3,7,
Teresa Norat
6, Dora Romaguera
6,8,9, Sven Knüppel
1, Marie-Christine Boutron-Ruault
10,11,12, Laure Dossus
10,11,12,
Laureen Dartois
10,11,12, Rudolf Kaaks
13, Kuanrong Li
13, Anne Tjønneland
14, Kim Overvad
15, José Ramón Quirós
16,
Genevieve Buckland
17, María José Sánchez
18,19, Miren Dorronsoro
20, Maria-Dolores Chirlaque
19,21,
Aurelio Barricarte
22, Kay-Tee Khaw
23, Nicholas J Wareham
24, Kathryn E Bradbury
25, Antonia Trichopoulou
26,27,
Pagona Lagiou
27,28, Dimitrios Trichopoulos
27,28,29, Domenico Palli
30, Vittorio Krogh
31, Rosario Tumino
32,
Alessio Naccarati
33, Salvatore Panico
34, Peter D Siersema
5, Petra HM Peeters
6,35, Ingrid Ljuslinder
36,
Ingegerd Johansson
37, Ulrika Ericson
38, Bodil Ohlsson
39, Elisabete Weiderpass
40,41,42,43, Guri Skeie
40,
Kristin Benjaminsen Borch
40, Sabina Rinaldi
3, Isabelle Romieu
3, Joyce Kong
3, Marc J Gunter
6, Heather A Ward
6,
Elio Riboli
6and Heiner Boeing
1Abstract
Background: Excess body weight, physical activity, smoking, alcohol consumption and certain dietary factors are individually related to colorectal cancer (CRC) risk; however, little is known about their joint effects. The aim of this study was to develop a healthy lifestyle index (HLI) composed of five potentially modifiable lifestyle factors– healthy weight, physical activity, non-smoking, limited alcohol consumption and a healthy diet, and to explore the association of this index with CRC incidence using data collected within the European Prospective Investigation into Cancer and Nutrition (EPIC) cohort.
Methods: In the EPIC cohort, a total of 347,237 men and women, 25- to 70-years old, provided dietary and lifestyle information at study baseline (1992 to 2000). Over a median follow-up time of 12 years, 3,759 incident CRC cases were identified. The association between a HLI and CRC risk was evaluated using Cox proportional hazards regression models and population attributable risks (PARs) have been calculated.
Results: After accounting for study centre, age, sex and education, compared with 0 or 1 healthy lifestyle factors, the hazard ratio (HR) for CRC was 0.87 (95% confidence interval (CI): 0.44 to 0.77) for two factors, 0.79 (95% CI: 0.70 to 0.89) for three factors, 0.66 (95% CI: 0.58 to 0.75) for four factors and 0.63 (95% CI: 0.54 to 0.74) for five factors; P-trend <0.0001. The associations were present for both colon and rectal cancers, HRs, 0.61 (95% CI: 0.50 to 0.74; P for trend <0.0001) for colon cancer and 0.68 (95% CI: 0.53 to 0.88; P-trend <0.0001) for rectal cancer, respectively (P-difference by cancer sub-site = 0.10). Overall, 16% of the new CRC cases (22% in men and 11% in women) were attributable to not adhering to a combination of all five healthy lifestyle behaviours included in the index. Conclusions: Combined lifestyle factors are associated with a lower incidence of CRC in European populations characterized by western lifestyles. Prevention strategies considering complex targeting of multiple lifestyle factors may provide practical means for improved CRC prevention.
Keywords: lifestyle factors, combined impact, population attributable risks, colorectal cancer, European Prospective Investigation into Cancer and Nutrition (EPIC)
* Correspondence:krasimira.aleksandrova@dife.de
1
Department of Epidemiology, German Institute of Human Nutrition Potsdam-Rehbrücke, Nuthetal, Germany
Full list of author information is available at the end of the article
© 2014 Aleksandrova et al.; licensee BioMed Central Ltd. This is an Open Access article distributed under the terms of the Creative Commons Attribution License (http://creativecommons.org/licenses/by/4.0), which permits unrestricted use, distribution, and reproduction in any medium, provided the original work is properly credited. The Creative Commons Public Domain Dedication waiver (http://creativecommons.org/publicdomain/zero/1.0/) applies to the data made available in this article, unless otherwise stated.
Aleksandrova et al. BMC Medicine 2014, 12:168 http://www.biomedcentral.com/1741-7015/12/168
Background
Colorectal cancer (CRC) is the third most common can-cer in men (746,000 cases per year, 10.0% of the total cancer incidence) and the second in women (614,000 cases per year, 9.2% of the total cancer incidence) world-wide [1]. There is a world-wide geographical variation in CRC incidence rates across the world with almost 55% of the cases occurring in more developed regions [1]. The par-allel between the cancer frequency rates and the level of ‘westernisation’ points to an important role of lifestyle factors in the etiology of CRC [2-13]. In support of this hypothesis, the World Cancer Research Fund/American Institute for Cancer Research (WCRF/AICR) expert pa-nel acknowledged that high physical activity and high intakes of dietary fibre, fish, nuts, dairy products, and fruits and vegetables are associated with a lower CRC risk, whereas high body mass index (BMI) and waist cir-cumference, smoking, alcohol consumption, and red and processed meat intakes are related to a higher CRC risk [14-16]. While individual roles of these lifestyle factors have been extensively investigated, little is known about their joint effects. Most epidemiological studies explored individual health behaviours by treating other lifestyle factors as covariates in statistical models; however, in real life it is uncommon that people practice isolated be-haviours. A multidimensional lifestyle approach would be more informative for exploring disease etiology, as well as for translating epidemiological findings into mea-ningful prevention strategies. Furthermore, estimation of health impact measures, such as population attributable risks (PARs), may provide better means for public health decision making, because PARs address what proportion of disease risk may be prevented over a specified time interval if a risk factor (or a combination of risk factors) is absent in a given population [17]. In addition, differ-ences between colon and rectal anatomical cancer sub-types and sex have been previously shown to exist for associations with several lifestyle factors, such as excess body weight, waist circumference and physical inactivity [18-20]; however, it is not clear whether such differences may be valid also for combinations of factors. Finally, varying combinations of risk factors differentially con-tribute to diabetes, cardiovascular diseases and cancer overall [21]; therefore, it may be important to investigate specific lifestyle patterns in relation to CRC risk. To ad-dress these aspects, we aimed to develop a healthy life-style index (HLI) composed of five potentially modifiable lifestyle factors – healthy weight, physical activity, non-smoking, limited alcohol consumption and a healthy diet – and to explore the association of this index with CRC incidence using data collected within the European Pro-spective Investigation into Cancer and Nutrition (EPIC) cohort. Furthermore, we aimed to evaluate the com-bined impact of these lifestyle factors in terms of PARs
overall and according to colon and rectal cancer ana-tomical sub-site and by sex.
Methods
Study design and population
A total of 521,330 men and women, 25- to 70-years old, were recruited between 1 January 1992 and 31 December 2000 from 23 centres in 10 European countries: Denmark, France, Germany, Greece, Italy, the Netherlands, Norway, Spain, Sweden and the United Kingdom. Approval for the EPIC study was obtained from the ethical review boards of the International Agency for Research on Cancer and from all local institutions where subjects had been re-cruited for the EPIC study [see Additional file 1: Table S1]. Written informed consent was obtained from all partici-pants before joining the EPIC study. Details of the recruit-ment and study design have been published elsewhere [22]. We excluded participants with missing data on diet-ary factors (n = 6,193), waist circumference measurements (n = 109,302), smoking history (11,746), physical activity (n = 69,393), underweight participants (BMI <18; n = 95,381) and participants with prevalent diabetes re-ported at study baseline (n = 13,049). Due to missing data on waist circumference measurements, participants from Norway (n = 35,890) were excluded from the ana-lyses. Consequently, the study population for the current analyses was comprised of 3,759 CRC cases (2,369 colon cancers and 1,390 rectal cancers) and 343,478 non-cases.
Case ascertainment
Cancer cases were identified through population cancer registries in Denmark, Italy, the Netherlands, Spain, Sweden and the United Kingdom. In France, Germany and Greece, a combination of methods was used includ-ing health insurance records, cancer pathology registries and active follow-up of study participants and their next of kin. Follow-up began at the date of enrolment and ended at the date of diagnosis of cancer, death or last complete follow-up. The last update of endpoint informa-tion was done up to 31 September 2010. Cancer incidence data were coded according to the 10th revision of the International Statistical Classification of Diseases, Injuries and Causes of Death [23] and the second revision of the International Classification of Diseases for Oncology [24]. Only the first primary neoplasm was included in the ana-lysis; non-melanoma skin cancer was excluded.
Assessment of lifestyle factors
At baseline, participants filled out extensive medical, diet-ary and lifestyle questionnaires, including questions on al-cohol use, smoking status, physical activity, education and previous illnesses. Body weight, height and waist circum-ference were measured in all centres except for EPIC-Oxford (health-conscious population) and France where
Aleksandrova et al. BMC Medicine 2014, 12:168 Page 2 of 15
anthropometric measurements were self-reported [22]. Usual food intakes were measured by using country-specific validated dietary questionnaires, and individual nutrient intakes were derived from foods included in the dietary questionnaires through the standardised EPIC Nutrient Database [25]. All dietary variables used in the present study were calibrated by using an additive calibra-tion method as previously described [26].
HLI definition
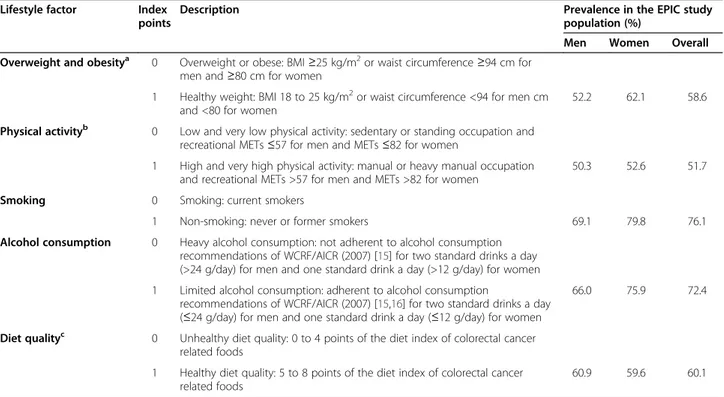
We generated the HLI based on a priori knowledge of the CRC risk factors [2-13] and available national and international public health recommendations (that is, WCRF/AICR (2007)) [15,16]. We used a binary score for each factor in order to allow easy translation of findings into a prevention practice (Table 1). Participants were assigned one point for each of the following behaviours assessed at study baseline: healthy weight (BMI <25 [27] or waist circumference <80 cm for women and <94 cm for men [28]); not smoking or former smoking, high physical activity [13], adherent to alcohol consumption recommendations of the WCRF/AICR (2007) [16] and
having a healthy diet. Healthy diet was evaluated based on a dietary quality index including eight dietary factors (fruits, vegetables, red and processed meat, fibre, fish, nuts, garlic and yogurt), which were previously shown to be related to CRC [see Additional file 2: Table S2]. Fi-nally, the HLI was constructed by summing the binary score for each of the five lifestyle factors which ranged from 0 (least healthy) to 5 (most healthy) points.
Statistical analysis
In descriptive analyses, we estimated the prevalence of each individual lifestyle factor included in the HLI and examined the baseline characteristics of the study partic-ipants according to an increasing HLI score. We next evaluated the association of the lifestyle factors modeled individually and in combination - as an index variable (HLI) - with risk of CRC. We used multivariable Cox pro-portional hazards models to calculate hazard ratios and 95% confidence intervals (CIs). Age (continuous) was used as the primary time-dependent variable in all models, with entry time defined as the subject’s age at recruitment (years) and exit time as the age at diagnosis, death or
Table 1 Description and prevalences of the factors comprising the Healthy Lifestyle Index (HLI), the EPIC Cohort (1992 to 2010)
Lifestyle factor Index
points
Description Prevalence in the EPIC study
population (%)
Men Women Overall
Overweight and obesitya 0 Overweight or obese: BMI≥25 kg/m2or waist circumference≥94 cm for
men and≥80 cm for women
1 Healthy weight: BMI 18 to 25 kg/m2or waist circumference <94 for men cm
and <80 for women
52.2 62.1 58.6
Physical activityb 0 Low and very low physical activity: sedentary or standing occupation and
recreational METs≤57 for men and METs ≤82 for women
1 High and very high physical activity: manual or heavy manual occupation
and recreational METs >57 for men and METs >82 for women
50.3 52.6 51.7
Smoking 0 Smoking: current smokers
1 Non-smoking: never or former smokers 69.1 79.8 76.1
Alcohol consumption 0 Heavy alcohol consumption: not adherent to alcohol consumption
recommendations of WCRF/AICR (2007) [15] for two standard drinks a day
(>24 g/day) for men and one standard drink a day (>12 g/day) for women
1 Limited alcohol consumption: adherent to alcohol consumption
recommendations of WCRF/AICR (2007) [15,16] for two standard drinks a day
(≤24 g/day) for men and one standard drink a day (≤12 g/day) for women
66.0 75.9 72.4
Diet qualityc 0 Unhealthy diet quality: 0 to 4 points of the diet index of colorectal cancer
related foods
1 Healthy diet quality: 5 to 8 points of the diet index of colorectal cancer
related foods
60.9 59.6 60.1
aBased on the World Health Organisation’s standard cutoff point for overweight [
27] or waist circumference <80 cm for women and <94 cm for men according to the European Group for the Study of Insulin Resistance (EGIR) recommendations for European populations [28].b
A MET is defined as the ratio of work metabolic rate to a standard metabolic rate of 1.0 (4.184 kJ) kg−1h−1; 1 MET is considered a resting metabolic rate obtained during quiet sitting. The MET values assigned to the non-occupational data were 3.0 for walking, 6.0 for cycling, 4.0 for gardening, 6.0 for sports, 4.5 for home repair (do-it-yourself work), 3.0 for housework and 8.0 for stair climbing [13].cHealthy diet was evaluated based on a dietary quality index including eight dietary factors (fruits, vegetables, red and processed meat, fibre, fish, nuts, garlic and yogurt), which were previously shown to be related to CRC overall and in the EPIC data [2-8,11,12,38-40] (Additional file2, Table S2). BMI, body mass index (calculated as weight in kilograms divided by height in squared metres); EPIC, European Prospective Investigation into Cancer and Nutrition; METs , metabolic equivalents of energy expenditure (MET)-hours per week per year; WCRF/AICR, World Cancer Research Fund/American Institute for
Cancer Research.
Aleksandrova et al. BMC Medicine 2014, 12:168 Page 3 of 15
return of the last follow-up questionnaire, whichever came first. Individual associations of the lifestyle factors with CRC were evaluated with each lifestyle factor modeled as a binary variable. The base model was stratified by EPIC study centre, and adjusted for age at study recruitment, sex (in the sex combined model) and educational level. The multivariable model for individual lifestyle factors was additionally adjusted for the remaining lifestyle fac-tors. In these analyses, participants with 0 points (least healthy) were the reference group. To evaluate the associ-ation of the lifestyle factors in combinassoci-ation, we modeled the HLI both as an ordinal variable and as a categorical variable according to six categories (0 to 5 points) with the least healthy group (0 points) as the reference group. P-value for the linear trend was calculated using the Wald test treating the index as a continuous variable. Since nor-mal body weight may be considered as a consequence of healthy lifestyle behaviours (that is, high physical activity and a healthy diet), we performed a subgroup analysis ex-cluding participants with healthy weights (0 to 4 scores). In order to test whether individual factors may statistically explain the association between the combined index and CRC, we added each of the factors to the multivariable-adjusted model one at a time. The percent change in the regression coefficient with adjustment for each individual lifestyle factor was compared with the multivariable mo-del. The corresponding 95% CI was calculated based on Fieller’s theorem [29]. In addition, we examined the multi-variable risks of CRC according to all possible combina-tions of lifestyle factors. The five dichotomised healthy lifestyle factors yielded thirty two combinations and the hazard ratios (HRs) for each of these combinations were calculated using participants who had no healthy factors as the reference group. All analyses were performed separ-ately for colon and rectal cancer and by sex. Differences by cancer site were tested by competing risk analyses using the model of Lunn-McNeil [30], whereas the differ-ences by sex were tested based on the likelihood ratio test by generating cross-product terms in multivariable models. Under the assumption that the associations are causal, we calculated the percentage of PARs and 95% CIs to estimate the proportion of CRC cases attributed to each individual lifestyle factor, as well as to lack of adherence to all of the five healthy lifestyle factors. For these analyses, we com-pared participants in the high-risk category with the rest of the population for each factor and for the index. PARs for single lifestyle factors were derived from equations by Miettinen [31] taking the strata specific prevalences of cases and multivariable-adjusted HRs into consideration. Attributable risks for factors in combination (PARj) were
determined using an equation by Bruzzi et al. [32]: PARj¼ ρj
RRJ‐1
RRj ;
where ρj is the prevalence of individuals not in the low risk group and RRj is the associated multivariable-adjusted hazard ratio. Upper and lower CIs of the PARs were calculated based on the formula by Whittemore et al. [33], as reported in previous analyses [34-36]. We stratified the analysis according to median age (52.4 years) and country in order to examine the potential of effect modification by any of these factors. In addition, we per-formed sensitivity analysis to account for possible influ-ence on the associations of family history as an established risk factor for CRC using available data from the EPIC centres in France, Spain and the United Kingdom, where 5,309 participants have reported having a family history of CRC. We also performed analyses comparing participants with and without missing data on major lifestyle exposure variables in order to control for potential missing data bias. Finally, we performed a lag analysis excluding partici-pants diagnosed with cancer within the first two years of study follow-up to control for potential influence of sub-clinical disease on these associations. All statistical ana-lyses were performed using the Statistical Analysis System (SAS) (version 9.2), Enterprise Guide User Interface (version 4.3); SAS Institute, Inc., Cary, NC, USA. All P values were based on two-sided tests, and P < .05 was considered statistically significant.
Results and discussion
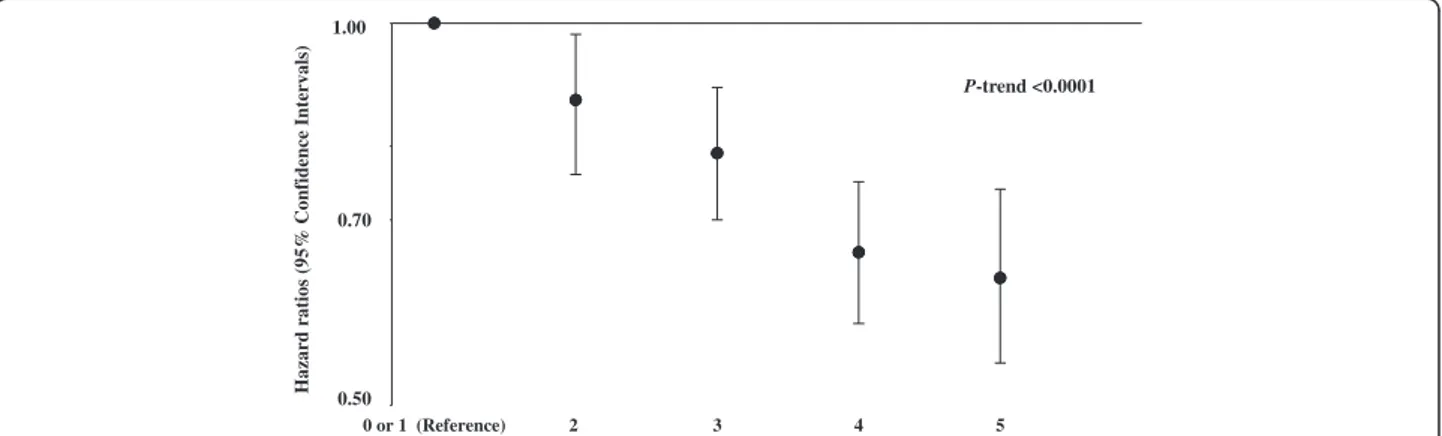
The median follow-up time of the study was 12 years (5th to 95th centile: 7.0 to 14.5). The total cohort’s me-dian age was 51.8 ± 10.2 years, and 121,116 (35%) of the participants were men. Among the study population, 203,595 (59%) participants had BMI and waist circum-ference within the recommended range, 179,787 (52%) had high physical activity, 264,153 (76%) were non-smokers (among these, 63% had never smoked and 37% were former smokers), 251,523 (72%) had alcohol intake within the recommended limits, and 208,562 (60%) had a healthy diet as assessed by the dietary quality index (Table 1). The participants having a higher HLI were more likely to be women and tended to have a higher educational level (Table 2). Each healthy lifestyle factor was associated with a reduction in CRC risk after taking age, sex, educational status and the remaining lifestyle factors into account (Table 3). Compared with participants with no or one healthy lifestyle factors, the multivariable-adjusted HR for CRC was 0.87 (95% CI: 0.76 to 0.98) for two factors, 0.79 (95% CI: 0.70 to 0.89) for three factors, 0.66 (95% CI: 0.58 to 0.75) for four factors and 0.63 (95% CI: 0.54 to 0.74) for five factors; P-trend <0.0001 (Figure 1). When evaluated ordinally, each additional healthy lifestyle factor was associated with a 12% lower risk of CRC (HR for a one point increase on the index = 0.88; 95% CI: 0.86 to 0.92), 13% lower risk of colon cancer (HR = 0.87; 95% CI = 0.83 to 0.90) and 9% lower risk of
Aleksandrova et al. BMC Medicine 2014, 12:168 Page 4 of 15
rectal cancer (HR = 0.91; 95% CI: 0.87 to 0.95; P-difference by cancer sub-site = 0.10; Table 4). Overall, the associa-tions between HLI and CRC were stronger in men com-pared to women (P-interaction = 0.03); however, when stratified by cancer site it became obvious that these dif-ferences could be mostly observed for rectal cancer but not for colon cancer (P-interaction = 0.0008). Additional adjustment for each of the individual lifestyle factors did not materially change the associations of HLI with CRC [see Additional file 3: Table S3]. However, in analyses by cancer site and sex, overweight and obesity appeared to statistically significantly explain the association of HLI with colon cancer in men by 29% (95% CI: 7% to 62%). In analysis based on an index that excluded healthy weight, the associations remained similar (that is, HR for a one point increase on the index = 0.89; 95% CI: 0.87 to 0.92, for CRC). The estimated PARs of CRC representing
the percentage of the population attributable to non-adherence to the particular healthy lifestyle behaviour were 8%, 3%, 4%, 4% and 5% for healthy weight, physical activity, non-smoking, limited alcohol consumption and a healthy diet, respectively. Overall 16% of the new CRC cases (22% in men and 11% in women) were attributable to not adhering to a combination of all of these five healthy lifestyle behaviours (Table 5). The results revealed a cancer-site and sex-specific gradient in estimated PARs such that 36% of rectal cancer cases in men and 20% of colon cancer cases in women were attributable to not ad-hering to all five healthy lifestyle factors, while no signifi-cant PARs were seen for colon cancer in men and rectal cancer in women. When we conducted analyses according to different combinations of two, three and four healthy lifestylefactors relative to no or one factors, we did not ob-serve a lower risk for any of the combinations of two
Table 2 Baseline characteristics of participants by Healthy Lifestyle Index (HLI) score, the EPIC cohort (1992 to 2010)
Characteristics Healthy lifestyle index points
0 1 2 3 4 5
Participants, number (%) 2,783 (0.8) 20,865 (6.0) 66,110 (19.0) 113,171 (32.6) 106,518 (30.7) 37,790 (10.9)
Colon cancer, number of cases 28 188 526 816 602 209
Rectal cancer, number of cases 12 121 326 459 348 124
Colorectal cancer, number of cases 40 309 852 1275 950 333
Socio-demographic characteristics: Age, mean, SD 52.7 52.1 52.2 51.9 51.5 50.8 Men,% 58.5 51.0 42.9 34.5 28.3 29.6 University degree,% 21.4 22.8 22.9 23.6 24.1 25.5 Lifestyle factors: BMI, kg/m2median 28.1 27.4 26.7 25.6 24.5 23.5
Waist circumference, cm, median
Men 101.0 100.0 98.0 95.0 90.5 87.3
Women 89.0 85.0 83.0 80.0 77.0 73.6
METs recreational and household activity 44.8 54.1 66.5 81.3 98.8 122.8
Never or former smokers,% - 2.0 13.4 33.1 37.0 14.3
Alcohol consumption, grams/day, median
Men 46.0 37.2 25.5 13.8 9.5 7.5
Women 24.2 18.1 11.0 4.5 2.3 1.9
Dietary factors, grams/day, median
Fibre 17.1 18.3 19.6 21.4 24.0 26.3 Fruits 88.4 113.2 146.6 195.1 256.6 287.1 Vegetables 107.3 120.4 136.3 165.6 216.4 245.7 Yoghurt 4.1 8.9 16.2 24.5 40.1 53.6 Nuts 0.66 0.69 0.82 0.82 1.60 2.33 Garlic 6.9 6.8 6.6 7.7 12.6 16.0
Red and processed meat 128.0 119.0 109.5 98.9 85.5 72.7
Fish 17.5 17.5 17.9 19.7 22.8 24.0
BMI, body mass index (calculated as weight in kilograms divided by height in squared meters); EPIC, European Prospective Investigation into Cancer and Nutrition; METs, metabolic equivalents of energy expenditure (MET)-hours per week per year; SD, standard deviation.
Aleksandrova et al. BMC Medicine 2014, 12:168 Page 5 of 15
Table 3 Hazard ratios of colorectal cancer in relation to individual lifestyle factors, the EPIC cohort (1992 to 2010)
Colon cancer Rectal cancer Colorectal cancer Healthy lifestyle factor Index Cases,
number Model 1a HR (95% CI) Model 2b HR (95% CI) Cases, number Model 1a HR (95% CI) Model 2b HR (95% CI) Cases, number Model 1a HR (95% CI) Model 2b HR (95% CI) All
Overweight and obesity 0 1,231 1 (Ref.) 1 (Ref.) 671 1 (Ref.) 1 (Ref.) 1,902 1 (Ref.) 1 (Ref.) 1 1,138 0.80 (0.73-0.87) 0.80 (0.74-0.87) 719 0.93 (0.84-1.03) 0.92 (0.82-1.03) 1,857 0.84 (0.79-0.90) 0.84 (0.79-0.90) Physical activity 0 1,144 1 (Ref.) 1 (Ref.) 648 1 (Ref.) 1 (Ref.) 1,792 1 (Ref.) 1 (Ref.)
1 1,225 0.87 (0.80-0.95) 0.88 (0.81-0.96) 742 1.02 (0.91-1.14) 1.03 (0.92-1.15) 1,967 0.92 (0.86-0.99) 0.94 (0.87-1.00) Smoking 0 550 1 (Ref.) 1 (Ref.) 378 1 (Ref.) 1 (Ref.) 928 1 (Ref.) 1 (Ref.)
1 1,819 0.90 (0.82-1.00) 0.91 (0.83-1.00) 1,012 0.82 (0.72-0.93) 0.84 (0.74-0.95) 2,831 0.87 (0.81-0.94) 0.88 (0.82-0.96) Alcohol consumption 0 695 1 (Ref.) 1 (Ref.) 462 1 (Ref.) 1 (Ref.) 1,157 1 (Ref.) 1 (Ref.)
1 1,671 0.91 (0.83-0.99) 0.91 (0.83-1.00) 928 0.79 (0.71-0.89) 0.81 (0.72-0.91) 2,602 0.86 (0.80-0.93) 0.87 (0.81-0.94) Diet quality 0 1,084 1 (Ref.) 1 (Ref.) 629 1 (Ref.) 1 (Ref.) 1,713 1 (Ref.) 1 (Ref.)
1 1,285 0.86 (0.79-0.94) 0.88 (0.81-0.96) 761 0.87 (0.78-0.98) 0.89 (0.79-1.01) 2,046 0.86 (0.81-0.93) 0.88 (0.83-0.95) Men
Overweight and obesity 0 602 1 (Ref.) 1 (Ref.) 393 1 (Ref.) 1 (Ref.) 995 1 (Ref.) 1 (Ref.) 1 427 0.73 (0.64-0.83) 0.74 (0.65-0.84) 335 0.89 (0.76-1.03) 0.90 (0.77-1.05) 762 0.79 (0.72-0.87) 0.80 (0.73-0.88) Physical activity 0 515 1 (Ref.) 1 (Ref.) 360 1 (Ref.) 1 (Ref.) 875 1 (Ref.) 1 (Ref.)
1 514 0.90 (0.79-1.00) 0.91 (0.80-1.03) 368 0.92 (0.79-1.08) 0.93 (0.80-1.09) 882 1.09 (0.99-1.20) 1.08 (0.98-1.19) Smoking 0 289 1 (Ref.) 1 (Ref.) 223 1 (Ref.) 1 (Ref.) 512 1 (Ref.) 1 (Ref.)
1 740 0.95 (0.82-1.09) 0.96 (0.83-1.10) 505 0.88 (0.75-1.04) 0.92 (0.78-1.08) 1,245 0.92 (0.83-1.02) 0.94 (0.97-1.00) Alcohol consumption 0 377 1 (Ref.) 1 (Ref.) 287 1 (Ref.) 1 (Ref.) 664 1 (Ref.) 1 (Ref.)
1 652 0.83 (0.73.0.95) 0.85 (0.74-0.97) 441 0.74 (0.63-0.87) 0.76 (0.64-0.89) 1,093 0.79 (0.72-0.88) 0.81 (0.73-0.89) Diet quality 0 451 1 (Ref.) 1 (Ref.) 342 1 (Ref.) 1 (Ref.) 793 1 (Ref.) 1 (Ref.)
1 578 0.88 (0.76-1.00) 0.89 (0.78-1.02) 386 0.78 (0.67-0.92) 0.80 (0.68-0.94) 964 0.84 (0.75-0.93) 0.85 (0.77-0.95) Women
Overweight and obesity 0 629 1 (Ref.) 1 (Ref.) 278 1 (Ref.) 1 (Ref.) 907 1 (Ref.) 1 (Ref.) 1 711 0.85 (0.76-0.96) 0.86 (0.77-0.96) 384 0.97 (0.82-1.14) 0.95 (0.81-1.12) 1,095 0.89 (0.81-0.98) 0.89 80.81-0.97) Physical activity 0 629 1 (Ref.) 1 (Ref.) 288 1 (Ref.) 1 (Ref.) 917 1 (Ref.) 1 (Ref.)
1 711 0.85 (0.75-0.95) 0.86 (0.77-0.97) 374 1.16 (0.98-1.37) 1.17 (0.99-1.38) 1,085 0.94 (0.85-1.04) 0.95 (0.86-1.05) Smoking 0 261 1 (Ref.) 1 (Ref.) 155 1 (Ref.) 1 (Ref.) 416 1 (Ref.) 1 (Ref.)
1 1,079 0.87 (0.76-1.01) 0.88 (0.77-1.02) 507 0.76 (0.63-0.92) 0.76 (0.63-0.93) 1,586 0.83 (0.74-0.93) 0.84 (0.75-0.94) Aleksand rova et al. BMC Medicine 2014, 12 :168 Page 6 o f 1 5 http://ww w.biomedce ntral.com/1 741-7015/12/168
Table 3 Hazard ratios of colorectal cancer in relation to individual lifestyle factors, the EPIC cohort (1992 to 2010) (Continued)
Alcohol consumption 0 318 1 (Ref.) 1 (Ref.) 175 1 (Ref.) 1 (Ref.) 493 1 (Ref.) 1 (Ref.) 1 1,022 0.99 (0.87-1.13) 0.99 (0.88-1.14) 487 0.90 (0.75-1.07) 0.91 (0.76-1.09) 1,509 0.96 (0.87-1.06) 0.96 (0.87-1.07) Diet quality 0 633 1 (Ref.) 1 (Ref.) 287 1 (Ref.) 1 (Ref.) 920 1 (Ref.) 1 (Ref.)
1 707 0.84 (0.75-0.95) 0.86 (0.77-0.97) 375 0.98 (0.83-1.17) 1.00 (0.84-1.18) 1,082 0.89 (0.81-0.98) 0.91 (0.82-1.00)
a
Base model stratified by EPIC study centre and adjusted for age, sex, education (none, primary school, technical/professional school).b
Multivariable model stratified by EPIC study centre and adjusted for age, sex, education (none, primary school, technical/professional school, university degree) and after mutual adjustment for other lifestyle factors, including overweight and obesity, physical activity, smoking, alcohol consumption, and diet quality (binary variables). CI, confidence interval; EPIC, European Prospective Investigation into Cancer and Nutrition; HR, hazard ratio; PAR, population attributable fraction; Ref., reference.
Aleksand rova et al. BMC Medicine 2014, 12 :168 Page 7 o f 1 5 http://ww w.biomedce ntral.com/1 741-7015/12/168
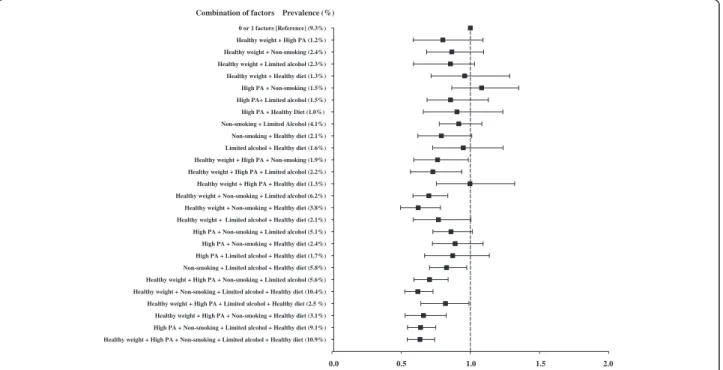
factors; whereas the risk of CRC was lower for several combinations of three healthy lifestyle factors (Figure 2). Among these, the combination of healthy weight, non-smoking and a healthy diet (HR = 0.62; 95% CI: 0.49 to 0.78) was associated with as lower risk as the combination of five lifestyle factors (HR = 0.63; 95% CI: 0.54 to 0.74). For most combinations, HLI scores of four and five were similarly protective. In stratified analyses, no substantial differences in the results were seen according to the age strata of less or more than 52.4 years (P-difference = 0.49) and by EPIC participating country [see Additional file 4: Figure S1; P-difference = 0.17]. Overall there have not been major differences between participants with and without missing data according to the main study charac-teristics and exposure variables (data not shown). In sensi-tivity analyses, in a multivariable-adjusted model including age, sex and education, additional adjustment for family history did not substantially alter the risk estimate for the association between HLI and CRC: HR = 0.88 (95%CI: 0.86 to 0.91); P-value <0.0001. The results were also not markedly changed after excluding cases diagnosed with CRC within the first two years of study follow-up; the HR for one point increase on the index was 0.77 (95% CI: 0.71 to 0.83).
In this large prospective cohort study over a median follow-up time of 12 years, an index based on five poten-tially modifiable healthy lifestyle factors including healthy weight, physical activity, non-smoking, limited alcohol consumption and a healthy diet was inversely associated with CRC risk. The associations were stronger among men compared to women, particularly for rectal can-cer. If these associations were causal, 16% of the new CRC cases (22% in men and 11% in women) would have been prevented had all participants been following
all five healthy lifestyles. These findings provide sex and cancer-site specific estimates of the public health burden of combined lifestyle factors for incident CRC in these European populations.
Given the high incidence and mortality rates [37], pre-vention strategies for reducing CRC are highly desired. In this context, there have been numerous studies ex-ploring individual lifestyle factors with regard to CRC risk [11,38-40]. However, studies on the combined effect of lifestyle factors on CRC risk have been more sparse [41-43]. In a study of 47,927 US men in the prospective Health Professionals Follow-up Cohort, after adjusting for age and family history of CRC comparing the risk score for the combined six modifiable colon cancer risk factors (obesity, physical inactivity, alcohol consumption, early adulthood cigarette smoking, red meat consump-tion and low intake of folic acid from supplements) at or above the approximate 20th, 10th, or 5th percentiles versus below, the PAR% increased from 39% to 48% and 55%, respectively [41]. In the Nurses’ Health Study among 83,767 US women, those who smoked, had a consist-ently high relative weight, low physical activity level, con-sumed red or processed meat on a daily basis, were never screened, and consumed low daily amounts of folate had almost a four-fold higher risk of colon cancer by the age of 70 years [43]. Another two studies provided data for European populations. A Danish Diet Cancer and Health cohort study [42] among 55,487 men and women, repor-ted 11% lower risk of CRC in people who adhered to five healthy lifestyle recommendations, including high phy-sical activity, low waist circumference, not smoking, low alcohol intake and a healthy diet (dietary fibre, energy per-centage from fat, red and processed meat, and fruits and vegetables). However, the study included participants
0 or 1 (Reference) 2 3 4 5 0,80 0,70 0,50 Hazard ratios (95% Conf idence Inte rvals) 1.00 0.70 0.50 P-trend <0.0001
Figure 1 Multivariable-adjusted hazard ratios (95% confidence intervals) of colorectal cancer according to increasing number of healthy lifestyle factors. Healthy lifestyle index (range 0 to 5 points) is calculated by summing the binary lifestyle factor variables (0, 1) including overweight and obesity, physical activity, smoking, alcohol consumption and diet quality. Participants received 1 point if they had any of the following behaviours: healthy weight, physically active, non-smokers or former smokers, limited alcohol consumption or healthy diet quality. The hazard ratios are calculated after stratification by EPIC study centre and multivariable adjustment for age at study recruitment, sex and educational status (none, primary school, technical/professional school/not specified). P-value for the linear trend was calculated using the Wald test treating the index as a continuous variable. EPIC. European Prospective Investigation into Cancer and Nutrition.
Aleksandrova et al. BMC Medicine 2014, 12:168 Page 8 of 15
only from Denmark and, therefore, its results may not be generalisable for other European populations. Using data from the EPIC cohort [44], a one-point increment in an index based on the 2007 WCRF/AICR recommendations was associated with a risk reduction of 12% (95% CI: 9% to 16%) for CRC. However, this index was based solely on BMI to define body fatness, whereas waist circumference as a measure of abdominal obesity has been suggested to be a more specific indicator for elevated metabolic risk [45]. In particular, visceral adipose tissue is physiologically more active than subcutaneous adipose tissue and generates hormones and cytokines with inflammatory,
metabolic and direct carcinogenic potential, which may directly or indirectly promote cancer development. Sug-gested putative mechanisms that may account for the link between obesity and CRC risk include hyperinsulinaemia, chronic low-grade inflammation, altered immune re-sponse, oxidative stress, as well as disturbances in insulin-like growth factors, adipokines and sex steroids. In addition, evidence has shown that while BMI is associated with CRC risk in men only, abdominal obesity (as deter-mined by waist circumference) is similarly strongly associ-ated with CRC cancer both in men and in women, suggesting that it may reflect cancer risk in both sexes
Table 4 Hazard ratios (HRs) of colorectal cancer according to the Healthy Lifestyle Index (HLI)a, the EPIC cohort (1992 to 2010)
HLI Colon cancer Rectal cancer Colorectal cancer
Cases, number HRb(95% CI) Cases, number HRb(95% CI) Cases, number HRb(95% CI)
All participants
0 or 1 216 1 (Reference) 133 1 (Reference) 349 1 (Reference)
2 526 0.85 (0.72 to 0.99) 326 0.90 (0.74 to 1.11) 852 0.87 (0.76 to 0.98)
3 816 0.78 (0.67 to 0.91) 459 0.80 (0.66 to 0.97) 1275 0.79 (0.70 to 0.89)
4 602 0.64 (0.54 to 0.75) 348 0.70 (0.57 to 0.85) 950 0.66 (0.58 to 0.75)
5 209 0.61 (0.50 to 0.74) 124 0.68 (0.53 to 0.88) 333 0.63 (0.54 to 0.74)
P-trend <0.0001 <0.0001 <0.0001
Per one point increase 0.87 (0.84 to 0.91) 0.90 (0.85 to 0.94) 0.88 (0.86 to 0.92)
P-valuec <0.0001 <0.0001 <0.0001
Men
0 or 1 135 1 (Reference) 94 1 (Reference) 229 1 (Reference)
2 266 0.80 (0.65 to 0.98) 196 0.87 (0.67 to 1.10) 462 0.83 (0.71 to 0.97)
3 330 0.70 (0.57 to 0.85) 236 0.75 (0.59 to 0.95) 566 0.72 (0.62 to 0.84)
4 215 0.59 (0.46 to 0.73) 160 0.66 (0.51 to 0.85) 375 0.62 (0.52 to 0.73)
5 83 0.61 (0.46 to 0.81) 42 0.47 (0.32 to 0.68) 125 0.56 (0.44 to 0.69)
P-trend <0.0001 <0.0001 <0.0001
Per one point increase 0.86 (0.82 to 0.91) 0.86 (0.80 to 0.91) 0.87 (0.83 to 0.90)
P-valuec <0.0001 <0.0001 <0.0001
Women
0 or 1 81 1 (Reference) 39 1 (Reference) 120 1 (Reference)
2 260 0.93 (0.73 to 1.20) 130 1.03 (0.72 to 1.48) 390 0.97 (0.78 to 1.18)
3 486 0.91 (0.71 to 1.14) 223 0.96 (0.68 to 1.36) 709 0.92 (0.76 to 1.12)
4 387 0.72 (0.56 to 0.92) 188 0.84 (0.59 to 1.19) 575 0.76 (0.62 to 0.93)
5 126 0.65 (0.48 to 0.86) 82 1.01 (0.68 to 1.49) 208 0.76 (0.60 to 0.95)
P-trendc <0.0001 0.35 <0.0001
Per one point increase 0.88 (0.84 to 0.93) 0.97 (0.99 to 1.04) 0.91 (0.87 to 0.95)
P-value <0.0001 0.35 <0.0001
a
Healthy lifestyle index (range 0 to 5 points) is calculated by summing the binary lifestyle factor variables (0,1) including overweight and obesity, physical activity, smoking, alcohol consumption and diet quality. Participants received one point if they had any of the following behaviours: healthy weight, physically active, non-smokers or former smokers, limited alcohol consumption or healthy diet quality.b
Multivariable model stratified by EPIC study centre and adjusted for age at study recruitment, sex and educational status (none, primary school, technical/professional school/not specified).c
P-value for the linear trend was calculated using the Wald test treating the index as a continuous variable. Note: P-interaction by sex: 0.40, for colon cancer; 0.008 for rectal cancer; 0.03 for colorectal cancer. P for interaction is assessed using the likelihood ratio test by generating a cross-product term between HLI and sex in the multivariable model. CI, confidence interval; EPIC, European Prospective Investigation into Cancer and Health; HR, hazard ratio.
Aleksandrova et al. BMC Medicine 2014, 12:168 Page 9 of 15
more adequately compared to BMI [18]. Indeed, in our data when only BMI was used to define healthy weight, the estimated HR of CRC was 0.93 (95% CI: 0.87 to 1.00), whereas the respective risk estimate for using only waist circumference was lower: HR = 0.82 (95% CI: 0.78 to 0.87). Taking the above into consideration, in our study we used both BMI and waist circumference to define healthy weight. Furthermore, the WCRF /AICR score used general dietary recommendations for cancer prevention, whereas it may be important to consider foods that have been specifically related to CRC risk. We designed an
a-priori based healthy diet quality index that comprised in-dividual foods specifically shown to be associated to CRC risk [2-8,11,12,38-40]. Using this index, we observed 37% lower risk of CRC for people having all five healthy life-style factors relative to those with none of these healthy factors.
In the present study we observed a stronger associ-ation between HLI and CRC among men than among women. Similar findings have been reported also by the Danish Diet Cancer and Health study [42], although the number of cases was much lower in that study and the
Table 5 Population attributable risks (PARs) according to individual lifestyle factors and combined Healthy Lifestyle Index (HLI)a, the EPIC Cohort (1992 to 2010)
Colon cancer Rectal cancer Colorectal cancer
Cases, numberb %PAR (95% CI) Cases, numberb %PAR (95% CI) Cases, numberb %PAR (95% CI)
All participants Individual lifestyle factorsc:
Overweight and obesity 1,231 10 (6 to 13) 671 3 (−1 to 7) 1,902 8 (5 to 11)
Physical activity 1,144 6 (2 to 10) 648 NA 1,792 3 (0 to 6) Smoking 550 2 (−3 to 4) 378 4 (1 to 7) 928 4 (1 to 6) Alcohol consumption 695 2 (−1 to 4) 462 6 (2 to 9) 1,157 4 (1 to 6) Diet quality 1,084 5 (2 to 8) 629 5 (−2 to 9) 1,713 5 (2 to 7) HLI <5d 2,160 17 (6 to 26) 1,266 13 (−4 to 27) 3,426 16 (7 to 24) Men
Individual lifestyle factorsc:
Overweight and obesity 602 15 (8 to 21) 393 5 (−2 to 11) 995 10 (5 to 14)
Physical activity 515 4 (−2 to 9) 360 5 (−7 to 15) 875 3 (−1 to 6) Smoking 289 1 (−2 to 4) 223 3 (−2 to 8) 512 4 (−3 to 11) Alcohol consumption 377 5 (1 to 9) 287 12 (5 to 18) 664 7 (3 to 10) Diet quality 451 4 (−1 to 9) 342 12 (3 to 20) 793 6 (1 to 10) HLI <5d 946 13 (−8 to 28) 686 36 (13 to 53) 1,632 22 (7 to 34) Women
Individual lifestyle factorsc:
Overweight and obesity 629 7 (2 to 11) 278 2 (−5 to 8) 907 5 (1 to 9)
Physical activity 629 7 (1 to 12) 288 NA 917 2 (−2 to 6)
Smoking 261 11 (−27 to 37) 155 2 (−2 to 6) 416 1 (−1 to 2)
Alcohol consumption 318 NA 175 2 (−2 to 6) 493 1 (−3 to 4)
Diet quality 633 6 (1 to10) 287 NA 920 2 (0 to 4)
HLI <5d 1,214 20 (6 to 32) 580 NA 1,794 11 (1 to 21)
a
The HLI (range 0 to 5 points) is calculated by summing the binary lifestyle factor variables (0,1) including overweight and obesity, physical activity, smoking, alcohol consumption and diet quality. Participants received one point if they had any of the following behaviours: healthy weight, physically active, non-smokers or former smokers, limited alcohol consumption or healthy diet quality.b
The number of cases denotes those cases without the healthy lifestyle factor or not adhering to all five healthy lifestyle factors.c
PAR according to each of the individual lifestyle factors, stratified by EPIC study centre, and adjusted for age, sex, education (none, primary school, technical/professional school) and mutually adjusted for the other lifestyle factors, including overweight and obesity, physical activity, smoking, alcohol consumption and diet quality (binary variables). PARs are calculated by reversing the coding of the protective factors and taking into account the relative proportion of exposed cases based on the formula from Miettinen et al. [31]. The 95% CIs are calculated based on the formula of Whittemore et al. [33]. The PARs denote the percentage of colorectal cancer cases in the population that are attributable to the non-adherence to the particular healthy lifestyle factor.dPAR, stratified by EPIC study centre, and adjusted for age at study recruitment, sex and educational status (none, primary school, technical/ professional school). The PAR denotes the percentage of colorectal cancer cases in the population that are attributable to the non-adherence to five healthy lifestyle behaviours. PARs are calculated based on a formula from Bruzzi et al. [32]. The 95% CIs are calculated based on the formula of Whittemore et al. [33]. Note: No meaningful PAR estimates were obtained for the associations of : physical activity and rectal cancer in all participants; alcohol consumption and colon cancer in women; as well as for physical activity and diet quality and rectal cancer in women, because the estimated hazard ratios for these individual factors in women were close to 1 (Please, see Table3). CI, confidence interval; EPIC, European Prospective Investigation into Cancer and Nutrition.
Aleksandrova et al. BMC Medicine 2014, 12:168 Page 10 of 15
interaction by sex was not statistically significant. In addition, we also observed a cancer site and sex-specific gradient in the PARs such that 36% of rectal cancer cases in men and 20% of colon cancer cases in women would have been prevented if all participants adhered to all five healthy lifestyle factors, whereas no statistically significant PARs were seen in men for colon cancer and in women for rectal cancer. These suggested sex differ-ences could be accounted for by differdiffer-ences in exposure distribution among men and women, quality of reporting lifestyle data or by biological differences among sexes. Our data revealed that overweight and obesity statistically ex-plained the association between HLI and colon cancer in men but not in women. These data are in line with previ-ous evidence on the role of obesity as a stronger risk fac-tor for colon cancer in men compared to women [18]. Different biological mechanisms have been suggested to explain the associations of obesity and colon cancer in men and in women. Thus, our previous work has sug-gested that inflammation and oxidative stress underlies this association in men, whereas hyperinsulinaemia was the candidate explaining the pathway in women [46]. More research is needed to shed light on potential bio-logical pathways that may underlie these relations.
When interpreting PARs, it should be taken into ac-count that these measures rely on the distribution of
lifestyle factors among participants in the present cohort study. Furthermore, PARs assume that the exposures are causal and unbiased, but studies with observational de-sign are not sufficiently able to prove this assumption. Nevertheless, this knowledge may still be useful for tai-loring interventions for lifestyle modification at target population subgroups.
As lifestyle patterns occur simultaneously and the mag-nitude of the associations may vary according to each individual’s present factors, we also examined the associa-tions according to different combinaassocia-tions of factors. In these analyses, we observed that a combination of three factors, including healthy weight, non-smoking and a healthy diet quality, was related to a lower CRC risk as low as the five factors altogether, suggesting the relative importance of this particular healthy lifestyle pattern for CRC prevention. However, due to the low prevalence of each specific combination of factors, more research is needed to investigate diversity of lifestyle patterns in rela-tion to CRC risk.
The strengths of the present study include the large sample size, the prospective study design, and the long follow-up time of the EPIC cohort. An important advan-tage of the study is the availability of measured rather than self-reported anthropometric information, as well as detailed dietary and lifestyle information collected using
Healthy weight + High PA + Non-smoking + Limited alcohol + Healthy diet (10.9%) High PA + Non-smoking + Limited alcohol + Healthy diet (9.1%) Healthy weight + High PA + Non-smoking + Healthy diet (3.1%) Healthy weight + High PA + Limited alcohol + Healthy diet (2.5 %) Healthy weight + Non-smoking + Limited alcohol + Healthy diet (10.4%) Healthy weight + High PA + Non-smoking + Limited alcohol (5.6%) Non-smoking + Limited alcohol + Healthy diet (5.8%) High PA + Limited alcohol + Healthy diet (1.7%) High PA + Non-smoking + Healthy diet (2.4%) High PA + Non-smoking + Limited alcohol (5.1%) Healthy weight + Limited alcohol + Healthy diet (2.1%) Healthy weight + Non-smoking + Healthy diet (3.8%) Healthy weight + Non-smoking + Limited alcohol (6.2%) Healthy weight + High PA + Healthy diet (1.3%) Healthy weight + High PA + Limited alcohol (2.2%) Healthy weight + High PA + Non-smoking (1.9%) Limited alcohol + Healthy diet (1.6%) Non-smoking + Healthy diet (2.1%) Non-smoking + Limited Alcohol (4.1%) High PA + Healthy Diet (1.0%) High PA+ Limited alcohol (1.5%) High PA + Non-smoking (1.5%) Healthy weight + Healthy diet (1.3%) Healthy weight + Limited alcohol (2.3%) Healthy weight + Non-smoking (2.4%) Healthy weight + High PA (1.2%) 0 or 1 factors [Reference] (9.3%)
0.0 0.5 1.0 1.5 2.0 Combination of factors Prevalence (%)
Figure 2 Multivariable-adjusted hazard ratios of colorectal cancer according to combinations of healthy lifestyle factors. HRs are shown for persons with the respective combination of healthy lifestyle factors compared with persons with none or one of the lifestyle factors; The multivariable model is stratified by EPIC study centre and adjusted for age at study recruitment, sex and educational status (none, primary school, technical/professional school/ not specified). The presented prevalences (%) represent the frequency distribution of the respective combinations of healthy lifestyle factors among the total study population. Within the reference group of individuals with 0 or 1 healthy lifestyle factors, 0.8% had 0 factors, 1.1% had only healthy weight; 0.85% had only high physical activity, 1.6% had only non-smoking, 1.4% had only limited alcohol and 0.9% had only healthy diet. CI, confidence interval; EPIC, European Prospective Investigation into Cancer and Nutrition; HR, hazard ratio.
Aleksandrova et al. BMC Medicine 2014, 12:168 Page 11 of 15
standardised procedures and validated instruments. The present study has several limitations. In order to construct the HLI, we dichotomised each lifestyle factor according to pre-defined cut-off points. Different threshold values would have resulted in different risk estimates. The choice of cut-off points was mostly based on public health recommendations and was generalised rather than risk-specific. Because the use of equal weights is an imperfect approximation of the underlying biological relationships between the different health behaviours and CRC, future analyses should examine the potential influence of the dif-ferent weightings. The dichotomisation of variables in-cluded in the lifestyle index is associated with several methodological challenges, including loss of information, power and potential for underestimating the extent of variation in risk. Discarding a high proportion of the data is particularly problematic when studies are too small and, hence, underpowered. However, EPIC is a large prospect-ive study with a long follow-up time, therefore having suf-ficient power to detect underlying relationships between healthy lifestyle factors and CRC risk. Nevertheless, the likely influence of the dichotomisation of the variables in the index is underestimating the true effect of the ob-served associations. We used multivariable models to ad-just for additional confounders; however, the potential for residual confounding remains. Measurement error in self-reported variables cannot be ruled out; however, such error would likely lead to a non-differential bias poten-tially leading to underestimating the true effects. We used a simplified diet quality index that may not sufficiently ac-count for the complexity of diets. A large proportion of participants were excluded because of missing information on main exposure variables which may have potentially biased the risk estimates if the participants with missing data are not similar to those with complete data. In our data overall there have not been major differences be-tween participants with and without missing data ac-cording to the main study characteristics and exposure variables; therefore, it is unlikely that using the complete data analysis approach would have influenced our find-ings. Endoscopic examinations of the large bowel have been associated with general health behaviour and lower CRC risk and, therefore, may potentially confound the association between lifestyle factors and CRC risk. Un-fortunately, in the EPIC study no information on CRC screening, that is, colonoscopy or sigmoidoscopy, has been systematically collected and we were not able to account for this factor in statistical analyses. However, previous studies which controlled for colonoscopy screening did not report a change in the association between healthy lifestyle behaviours and CRC risk [47]. In addition, when we stratified the analyses by age of 50 or 55 when most screening programs in Europe are introduced, we did not observe different results; therefore, it is unlikely that the
main study findings could have been largely influenced by this factor. Finally, the combined HLI did not include all possible lifestyles, that is, non-steroidal anti-inflammatory drug use or dietary nutrients (calcium, vitamin D) that could additionally influence CRC risk. If added to the index, the estimated PARs could have been potentially higher.
Conclusions
In conclusion, combined lifestyle factors - healthy weight, high physical activity, non-smoking, limited alcohol con-sumption and a healthy diet - are associated with a lower CRC incidence in European populations characterized by western lifestyles. These data support the notion that the complex nature and multiple dimensions of health behav-iours may be better captured in analyses of lifestyle factors in combination compared to modeling individual factors alone. From a prevention perspective, using combina-tions of modifiable lifestyle factors in CRC risk assessment promises to be a successful, yet simple, approach for translation of epidemiologic findings into primary cancer prevention.
Additional files
Additional file 1: Table S1. Ethical approval review board information for local EPIC centres.
Additional file 2: Table S2. Composition of the Diet Quality Index. Additional file 3: Table S3. Percent Change in Regression Coefficients for Colorectal Cancer Associated with the Healthy Lifestyle Index (continuously) with Adjustment for each Healthy Lifestyle Factor, the EPIC cohort (1992–2010).
Additional file 4: Figure S1. Multivariable-adjusted Hazard Ratios of the Association between HLI and Colorectal Cancer across EPIC participating countries.
Abbreviations
BMI:body mass index; CI: confidence interval; CRC: colorectal cancer; EPIC: European Prospective Investigation into Cancer and Nutrition; HLI: Healthy Lifestyle Index; HR: hazard ratio; PAR: population attributable risk; WCRF/AICR: World Cancer Research Fund/American Institute for Cancer Research.
Competing interests
The authors declare that they have no competing interests. Authors’ contributions
KA had full access to all of the data in the study and takes responsibility for the integrity of the data and the accuracy of the data analysis. Study concept and design: KA and HB. Analysis and interpretation of data: KA, TP, MJ, HBBDM, TN, DR, VF, SK, HB. Drafting of the manuscript: KA. Critical revision of the manuscript for important intellectual content: M-C B-R, LD, LD, RK, KL, AT, KO, JEQ, GB, MJS, MD, M-D C, AB, K-T K, NJW, KEB, AT, PL, DT, DP, VK, RT, AN, SP, PDS, PHMP, IL, IJ, UE, BO, EW, GS, KBB, SR, IR, JK, MJG, HAW, ER. Administrative, technical, and material support: HB. Study supervision: HB. All authors read and approved the final manuscript. Acknowledgements
The authors thank Ellen Kohlsdorf (German Institute of Human Nutrition Potsdam-Rehbrücke, Nuthetal, Germany ) for her work on data management
Aleksandrova et al. BMC Medicine 2014, 12:168 Page 12 of 15
and technical assistance. The authors thank all participants in the EPIC study for their outstanding cooperation.
Funding/Support
The coordination of the EPIC study is financially supported by the European Commission (DG-SANCO) and the International Agency for Research on Cancer. The national cohorts are supported by Danish Cancer Society (Denmark); Ligue Contre le Cancer, Institut Gustave Roussy, Mutuelle Générale de l’Education Nationale, Institut National de la Santé et de la Recherche Médicale (INSERM) (France); Deutsche Krebshilfe, Deutsches Krebsforschungszentrum and Federal Ministry of Education and Research (Germany); Hellenic Health Foundation (Greece); Italian Association for Research on Cancer (AIRC), National Research Council, HuGeF Foundation, Compagnia di San Paolo, Sicily Regional Government, AIRE ONLUS Ragusa and AVIS Ragusa (Italy); Dutch Ministry of Public Health, Welfare and Sports (VWS), Netherlands Cancer Registry (NKR), LK Research Funds, Dutch Prevention Funds, Dutch ZON (Zorg Onderzoek Nederland), World Cancer Research Fund (WCRF) and Statistics Netherlands (The Netherlands); ERC-2009-AdG 232997 and Nordforsk, Nordic Centre of Excellence programme on Food, Nutrition and Health, Norwegian Research Council, Norwegian Cancer Society, University of Tromso (Norway); Health Research Fund (FIS), Regional Governments of Andalucía, Asturias, Basque Country, Murcia (no. 6236) and Navarra, ISCIII RETIC (RD06/0020) (Spain); Swedish Cancer Society, Swedish Scientific Council and Regional Government of Skåne and Västerbotten (Sweden); Cancer Research UK, Medical Research Council (United Kingdom). Role of the Sponsors: The funders had no role in the design and conduct of the study; collection, management, analysis and interpretation of the data; or preparation, review or approval of the manuscript.
Author details
1Department of Epidemiology, German Institute of Human Nutrition
Potsdam-Rehbrücke, Nuthetal, Germany.2Molecular Epidemiology Group,
Max Delbrueck Center for Molecular Medicine (MDC), Berlin-Buch, Germany.
3
International Agency for Research on Cancer (IARC-WHO), Lyon, France.
4National Institute for Public Health and the Environment (RIVM), Bilthoven,
Netherlands.5Department of Gastroenterology and Hepatology, University
Medical Center, Utrecht, the Netherlands.6Department of Epidemiology and
Biostatistics, School of Public Health, Imperial College London, London, UK.
7Department of Epidemiology, Rollins School of Public Health, Winship
Cancer Institute, Emory University, Atlanta, GA, USA.8Instituto de Investigacion Sanitaria de Palma (IdISPa), Hospital Universitario Son Espases,
Palma de Mallorca, Spain.9CIBER Fisiopatología de la Obesidad y Nutrición
(CIBEROBN), Santiago de Compostela, Spain.10Inserm, Centre for research in
Epidemiology and Population Health (CESP), U1018, Nutrition, Hormones and
Women’s Health team, F-94805 Villejuif, France.11Univ Paris Sud, UMRS 1018,
F-94805 Villejuif, France.12IGR, F-94805 Villejuif, France.13Division of Cancer
Epidemiology, German Cancer Research Centre, Heidelberg, Germany.14Diet,
Genes and Environment Danish Cancer Society Research Center,
Copenhagen, Denmark.15Department of Public Health, Section for
Epidemiology, Aarhus University, Aarhus, Denmark.16Public Health
Directorate, Asturias, Spain.17Unit of Nutrition, Environment and Cancer,
Cancer Epidemiology Research Programme, Catalan Institute of Oncology (ICO-IDIBELL), Barcelona, Spain.18Escuela Andaluza de Salud Pública. Instituto
de Investigación Biosanitaria de Granada (Granada.ibs), Granada, Spain.
19CIBER de Epidemiología y Salud Pública (CIBERESP), Madrid, Spain.
20
Epidemiology and Health Information, Public Health Division of Gipuzkoa,
Basque Regional Health Department, San Sebastian, Spain.21Department of
Epidemiology, Murcia Regional Health Authority, Murcia, Spain.22Navarre
Public Health Institute, Pamplona, Spain.23Clinical Gerontology Unit,
Addenbrooke’s Hospital, University of Cambridge School of Clinical Medicine,
Cambridge, UK.24MRC Epidemiology Unit, Institute of Metabolic Science,
University of Cambridge School of Clinical Medicine, Cambridge, UK.
25Cancer Epidemiology Unit, Nuffield Department of Population Health,
University of Oxford, Oxford, UK.26Hellenic Health Foundation, Athens,
Greece.27Bureau of Epidemiologic Research, Academy of Athens, Athens,
Greece.28Department of Hygiene, Epidemiology and Medical Statistics,
University of Athens Medical School, Athens, Greece.29Department of
Epidemiology, Harvard School of Public Health, Boston, MA, USA.30Molecular
and Nutritional Epidemiology Unit, Cancer Research and Prevention Institute – ISPO, Florence, Italy.31
Epidemiology and Prevention Unit, Fondazione IRCCS Istituto Nazionale dei Tumori, Milan, Italy.32Cancer Registry and
Histopathology Unit,“M.P.Arezzo” Hospital, Ragusa, Italy.33HuGeF - Human
Genetics Foundation– Torino, Molecular and Genetic Epidemiology Unit,
Turin, Italy.34Department of clinical and experimental medicine-Federico II
University, Naples, Italy.35Department of Epidemiology, Julius Center for Health Sciences and Primary Care, University Medical Center, Utrecht, the
Netherlands.36Department of Radiation Sciences, Oncology, Umeå
University, Umeå, Sweden.37Department of Odontology, Umeå University,
Umeå, Sweden.38Diabetes and Cardiovascular Disease, Genetic
Epidemiology, Department of Clinical Sciences in Malmö, Lund University,
Malmö, Sweden.39Department of Clinical Sciences, Division of Internal
Medicine, Skåne University Hospital Malmö, Lund University, Malmö, Sweden.
40
Department of Community Medicine, Faculty of Health Sciences, University
of Tromso, The Arctic University of Norway, Tromsø, Norway.41Department
of Research, Cancer Registry of Norway, Oslo, Norway.42Department of
Medical Epidemiology and Biostatistics, Karolinska Institutet, Stockholm,
Sweden.43Samfundet Folkhälsan, Helsinki, Finland.
Received: 27 June 2014 Accepted: 29 August 2014
References
1. Ferlay JS, Ervik M, Dikshit R, Eser S, Mathers C, Rebelo M, Parkin DM, Forman D, Bray F: Cancer incidence and mortality worldwide: IARC CancerBase. In GLOBOCAN 2012 v10, Volume 11. Lyon, France: International Agency for Research on Cancer; 2013.
2. Bingham S: The fibre-folate debate in colo-rectal cancer. Proc Nutr Soc 2006, 65:19–23.
3. Bingham SA, Day NE, Luben R, Ferrari P, Slimani N, Norat T, Clavel-Chapelon F, Kesse E, Nieters A, Boeing H, Tjønneland A, Overvad K, Martinez C, Dorronsoro M, Gonzalez CA, Key TJ, Trichopoulou A, Naska A, Vineis P, Tumino R, Krogh V, Bueno-de-Mesquita HB, Peeters PH, Berglund G, Hallmans G, Lund E, Skeie G, Kaaks R, Riboli E, European Prospective Investigation into Cancer and Nutrition: Dietary fibre in food and protection against colorectal cancer in the European Prospective Investigation into Cancer and Nutrition (EPIC): an observational study. Lancet 2003, 361:1496–1501.
4. Ferrari P, Jenab M, Norat T, Moskal A, Slimani N, Olsen A, Tjonneland A, Overvad K, Jensen MK, Boutron-Ruault MC, Clavel-Chapelon F, Morois S, Rohrmann S, Linseisen J, Boeing H, Bergmann M, Kontopoulou D, Trichopoulou A, Kassapa C, Masala G, Krogh V, Vineis P, Panico S, Tumino R, van Gils CH, Peeters P, Bueno-de-Mesquita HB, Ocké MC, Skeie G, Lund E, et al: Lifetime and baseline alcohol intake and risk of colon and rectal cancers in the European prospective investigation into cancer and nutrition (EPIC). Int J Cancer 2007, 121:2065–2072.
5. Jenab M, Ferrari P, Slimani N, Norat T, Casagrande C, Overad K, Olsen A, Stripp C, Tjonneland A, Boutron-Ruault MC, Clavel-Chapelon F, Kesse E, Nieters A, Bergmann M, Boeing H, Naska A, Trichopoulou A, Palli D, Krogh V, Celentano E, Tumino R, Sacerdote C, Bueno-de-Mesquita HB, Ocké MC, Peeters PH, Engeset D, Quirós JR, González CA, Martínez C, Chirlaque MD, et al: Association of nut and seed intake with colorectal cancer risk in the European Prospective Investigation into Cancer and Nutrition. Cancer Epidemiol Biomarkers Prev 2004, 13:1595–1603.
6. Norat T, Bingham S, Ferrari P, Slimani N, Jenab M, Mazuir M, Overvad K, Olsen A, Tjonneland A, Clavel F, Boutron-Ruault MC, Kesse E, Boeing H, Bergmann MM, Nieters A, Linseisen J, Trichopoulou A, Trichopoulos D, Tountas Y, Berrino F, Palli D, Panico S, Tumino R, Vineis P, Bueno-de-Mesquita HB, Peeters PH, Engeset D, Lund E, Skeie G, Ardanaz E, et al: Meat, fish, and colorectal cancer risk: the European Prospective Investigation into cancer and nutrition. J Natl Cancer Inst 2005, 97:906–916. 7. Pischon T, Lahmann PH, Boeing H, Friedenreich C, Norat T, Tjonneland A,
Halkjaer J, Overvad K, Clavel-Chapelon F, Boutron-Ruault MC, Guernec G, Bergmann MM, Linseisen J, Becker N, Trichopoulou A, Trichopoulos D, Sieri S, Palli D, Tumino R, Vineis P, Panico S, Peeters PH, Bueno-de-Mesquita HB, Boshuizen HC, Van Guelpen B, Palmqvist R, Berglund G, Gonzalez CA, Dorronsoro M, Barricarte A, et al: Body size and risk of colon and rectal cancer in the European Prospective Investigation Into Cancer and Nutrition (EPIC). J Natl Cancer Inst 2006, 98:920–931.
8. van Duijnhoven FJ, Bueno-De-Mesquita HB, Ferrari P, Jenab M, Boshuizen HC, Ros MM, Casagrande C, Tjonneland A, Olsen A, Overvad K, Thorlacius-Ussing O, Clavel-Chapelon F, Boutron-Ruault MC, Morois S, Kaaks R, Linseisen J, Boeing H, Nöthlings U, Trichopoulou A, Trichopoulos D, Misirli G, Palli D, Sieri S, Panico S, Tumino R, Vineis P, Peeters PH, van Gils CH, Ocké
Aleksandrova et al. BMC Medicine 2014, 12:168 Page 13 of 15
MC, Lund E, et al: Fruit, vegetables, and colorectal cancer risk: the European Prospective Investigation into Cancer and Nutrition. Am J Clin Nutr 2009, 89:1441–1452.
9. Murphy N, Norat T, Ferrari P, Jenab M, Bueno-de-Mesquita B, Skeie G, Dahm CC, Overvad K, Olsen A, Tjonneland A, Clavel-Chapelon F, Boutron-Ruault MC, Racine A, Kaaks R, Teucher B, Boeing H, Bergmann MM, Trichopoulou A, Trichopoulos D, Lagiou P, Palli D, Pala V, Panico S, Tumino R, Vineis P, Siersema P, van Duijnhoven F, Peeters PH, Hjartaker A, Engeset D, et al: Dietary fibre intake and risks of cancers of the colon and rectum in the European prospective investigation into cancer and nutrition (EPIC). PLoS One 2012, 7:e39361.
10. Murphy N, Norat T, Ferrari P, Jenab M, Bueno-de-Mesquita B, Skeie G, Olsen A, Tjonneland A, Dahm CC, Overvad K, Boutron-Ruault MC, Clavel-Chapelon F, Nailler L, Kaaks R, Teucher B, Boeing H, Bergmann MM, Trichopoulou A, Lagiou P, Trichopoulos D, Palli D, Pala V, Tumino R, Vineis P, Panico S, Peeters PH, Dik VK, Weiderpass E, Lund E, Garcia JR, et al: Consumption of dairy products and colorectal cancer in the European Prospective Investigation into Cancer and Nutrition (EPIC). PLoS One 2013, 8:e72715. 11. Gonzalez CA, Riboli E: Diet and cancer prevention: contributions from the
European Prospective Investigation into Cancer and Nutrition (EPIC) study. Eur J Cancer 2010, 46:2555–2562.
12. Leufkens AM, Van Duijnhoven FJ, Siersema PD, Boshuizen HC, Vrieling A, Agudo A, Gram IT, Weiderpass E, Dahm C, Overvad K, Tjønneland A, Olsen A, Boutron-Ruault MC, Clavel-Chapelon F, Morois S, Palli D, Grioni S, Tumino R, Sacerdote C, Mattiello A, Herman S, Kaaks R, Steffen A, Boeing H, Trichopoulou A, Lagiou P, Trichopoulos D, Peeters PH, van Gils CH, van Kranen H, et al: Cigarette smoking and colorectal cancer risk in the European Prospective Investigation into Cancer and Nutrition study. Clin Gastroenterol Hepatol 2011, 9:137–144.
13. Friedenreich C, Norat T, Steindorf K, Boutron-Ruault MC, Pischon T, Mazuir M, Clavel-Chapelon F, Linseisen J, Boeing H, Bergman M, Johnsen NF, Tjønneland A, Overvad K, Mendez M, Quirós JR, Martinez C, Dorronsoro M, Navarro C, Gurrea AB, Bingham S, Khaw KT, Allen N, Key T, Trichopoulou A, Trichopoulos D, Orfanou N, Krogh V, Palli D, Tumino R, Panico S, et al: Physical activity and risk of colon and rectal cancers: the European prospective investigation into cancer and nutrition. Cancer Epidemiol Biomarkers Prev 2006, 15:2398–2407.
14. World Cancer Research Fund/American Institute for Cancer Research: Continuous Update Project Report. Food, Nutrition, Physical Activity, and the Prevention of Colorectal Cancer. 2011.
15. Wiseman M: The second World Cancer Research Fund/American Institute for Cancer Research expert report. Food, nutrition, physical activity, and the prevention of cancer: a global perspective. Proc Nutr Soc 2008, 67:253–256. 16. World Cancer Research Fund/American Institute for Cancer Research: Food, Nutrition, Physical Activity, and the Prevention of Cancer: a Global Perspective. Washington DC: AICR; 2007.
17. Eide GE, Heuch I: Average attributable fractions: a coherent theory for apportioning excess risk to individual risk factors and subpopulations. Biom J 2006, 48:820–837.
18. Aleksandrova K, Nimptsch K, Pischon T: Obesity and colorectal cancer. Front Biosci 2013, 5:61–77.
19. Robsahm TE, Aagnes B, Hjartaker A, Langseth H, Bray FI, Larsen IK: Body mass index, physical activity, and colorectal cancer by anatomical subsites: a systematic review and meta-analysis of cohort studies. Eur J Cancer Prev 2013, 22:492–505.
20. Harriss DJ, Atkinson G, Batterham A, George K, Cable NT, Reilly T, Haboubi N, Renehan AG, Colorectal Cancer Lifestyle Exercise and Research Group: Lifestyle factors and colorectal cancer risk (2): a systematic review and meta-analysis of associations with leisure-time physical activity. Colorectal Dis 2009, 11:689–701.
21. Hoffmann K, Heidemann C, Weikert C, Schulze MB, Boeing H: Estimating the proportion of disease due to classes of sufficient causes. Am J Epidemiol 2006, 163:76–83.
22. Riboli E, Hunt KJ, Slimani N, Ferrari P, Norat T, Fahey M, Charrondiere UR, Hemon B, Casagrande C, Vignat J, Overvad K, Tjønneland A, Clavel-Chapelon F, Thiébaut A, Wahrendorf J, Boeing H, Trichopoulos D, Trichopoulou A, Vineis P, Palli D, Bueno-De-Mesquita HB, Peeters PH, Lund E, Engeset D, González CA, Barricarte A, Berglund G, Hallmans G, Day NE, Key TJ, et al: European Prospective Investigation into Cancer and Nutrition (EPIC): study populations and data collection. Public Health Nutr 2002, 5:1113–1124.
23. Bramer GR: International statistical classification of diseases and related health problems. Tenth revision. Colorectal Dis 1988, 41:32–36.
24. World Health Organization: International classification of diseases for oncology. 2nd edition. Geneva, Switzerland; 1990.
25. Slimani N, Deharveng G, Unwin I, Southgate DA, Vignat J, Skeie G, Salvini S, Parpinel M, Moller A, Ireland J, Becker W, Farran A, Westenbrink S, Vasilopoulou E, Unwin J, Borgejordet A, Rohrmann S, Church S, Gnagnarella P, Casagrande C, van Bakel M, Niravong M, Boutron-Ruault MC, Stripp C, Tjønneland A, Trichopoulou A, Georga K, Nilsson S, Mattisson I, Ray J, et al: The EPIC nutrient database project (ENDB): a first attempt to standardize nutrient databases across the 10 European countries participating in the EPIC study. Eur J Clin Nutr 2007, 61:1037–1056.
26. Kaaks R, Riboli E: Validation and calibration of dietary intake measurements in the EPIC project: methodological considerations. European Prospective Investigation into Cancer and Nutrition. Int J Epidemiol 1997, 26:S15–S25.
27. World Health Organization: Physical status: the use and interpretation of anthropometry. Report of a WHO Expert Committee. Tech Rep Ser 1995, 854:1–452.
28. Alberti KG, Zimmet P, Shaw J: The metabolic syndrome–a new worldwide definition. Lancet 2005, 366:1059–1062.
29. Fieller E: The biological standardization of insulin. J R Stat Soc 1940, 7:1–15.
30. Lunn M, McNeil D: Applying Cox regression to competing risks. Biometrics 1995, 51:524–532.
31. Miettinen OS: Proportion of disease caused or prevented by a given exposure, trait or intervention. Am J Epidemiol 1974, 99:325–332. 32. Bruzzi P, Green SB, Byar DP, Brinton LA, Schairer C: Estimating the
population attributable risk for multiple risk factors using case–control data. Am J Epidemiol 1985, 122:904–914.
33. Whittemore AS: Statistical methods for estimating attributable risk from retrospective data. Stat Med 1982, 1:229–243.
34. Ford ES, Bergmann MM, Kroger J, Schienkiewitz A, Weikert C, Boeing H: Healthy living is the best revenge: findings from the European Prospective Investigation Into Cancer and Nutrition-Potsdam study. Arch Intern Med 2009, 169:1355–1362.
35. Pischon T, Mohlig M, Hoffmann K, Spranger J, Weikert C, Willich SN, Pfeiffer AF, Boeing H: Comparison of relative and attributable risk of myocardial infarction and stroke according to C-reactive protein and low-density lipoprotein cholesterol levels. Eur J Epidemiol 2007, 22:429–438. 36. Heidemann C, Hoffmann K, Klipstein-Grobusch K, Weikert C, Pischon T,
Hense HW, Boeing H: Potentially modifiable classic risk factors and their impact on incident myocardial infarction: results from the EPIC-Potsdam study. Eur J Cardiovasc Prev Rehabil 2007, 14:65–71.
37. Zavoral M, Suchanek S, Zavada F, Dusek L, Muzik J, Seifert B, Fric P: Colorectal cancer screening in Europe. World J Gastroenterol 2009, 15:5907–5915.
38. Correa Lima MP, Gomes-da-Silva MH: Colorectal cancer: lifestyle and dietary factors. Nutr Hosp 2005, 20:235–241.
39. Ahmed FE: Effect of diet, life style, and other environmental/ chemopreventive factors on colorectal cancer development, and assessment of the risks. J Environ Sci Health C Environ Carcinog Ecotoxicol Rev 2004, 22:91–147.
40. Qasim A, O’Morain C: Primary prevention of colorectal cancer: are we closer to reality? Eur J Gastroenterol Hepatol 2010, 22:9–17.
41. Platz EA, Willett WC, Colditz GA, Rimm EB, Spiegelman D, Giovannucci E: Proportion of colon cancer risk that might be preventable in a cohort of middle-aged US men. Cancer Causes Control 2000, 11:579–588.
42. Kirkegaard H, Johnsen NF, Christensen J, Frederiksen K, Overvad K, Tjonneland A: Association of adherence to lifestyle recommendations and risk of colorectal cancer: a prospective Danish cohort study. BMJ 2010, 341:c5504.
43. Wei EK, Colditz GA, Giovannucci EL, Fuchs CS, Rosner BA: Cumulative risk of colon cancer up to age 70 years by risk factor status using data from the Nurses’ Health Study. Am J Epidemiol 2009, 170:863–872.
44. Romaguera D, Vergnaud AC, Peeters PH, van Gils CH, Chan DS, Ferrari P, Romieu I, Jenab M, Slimani N, Clavel-Chapelon F, Fagherazzi G, Perquier F, Kaaks R, Teucher B, Boeing H, von Rüsten A, Tjønneland A, Olsen A, Dahm CC, Overvad K, Quirós JR, Gonzalez CA, Sánchez MJ, Navarro C, Barricarte A, Dorronsoro M, Khaw KT, Wareham NJ, Crowe FL, Key TJ, et al: Is concordance with World Cancer Research Fund/American Institute for Cancer Research
Aleksandrova et al. BMC Medicine 2014, 12:168 Page 14 of 15