Björn Peters
Helena Selander
Christina Stave
Jonas Andersson Hultgren
Andreas Jansson
Evaluation of driving simulator based
training for older drivers in Sweden
VTI notat 32A-2016
|
Evaluation of driving simulator based tr
aining for older driv
www.vti.se/en/publications
VTI notat 32A-2016
Published 2016
VTI notat 32A-2016
Evaluation of driving simulator based
training for older drivers in Sweden
Deliverable 2.4.3
Björn Peters
Helena Selander
Christina Stave
Jonas Andersson Hultgren
Andreas Jansson
Reg.no., VTI: 2012/0178-26
Cover pictures: Thinkstock, Hejdlösa Bilder AB, Printed at VTI in Linköping 2016
Foreword
The study presented in this report is part of the subproject SP2 of the Safe Move project – (Safe Mobility for Older Drivers). A collaborative project carried out between VTI, Mobilitetscenter and Volvo Cars in Sweden and IFSTTAR, CNRS, INSERM, University of Bordeaux, University of Caen, University Claude Bernard Lyon, OKTAL, Continental, Peugeot and Citroën in France.
A similar study was performed and reported in France within the Safe Move project. The aim of the entire Safe Move project is to increase knowledge and practice of safe mobility for older drivers by three complementary approaches in three subprojects:
SP1: Survey assessment of older drivers and assessment with on road test and cognitive tests. SP2: Simulator based assessment and training of older drivers.
SP3: Assistance systems for older drivers. Linköping, december 2016
Björn Peters Project leader
Quality review
Internal peer review was performed on 26 May 2016 by Professor Jan Andersson. Björn Peters has made alterations to the final manuscript of the report. The research director Jonas Jansson examined and approved the report for publication on 6 December 2016. The conclusions and recommendations expressed are the author’s/authors’ and do not necessarily reflect VTI’s opinion as an authority.
Kvalitetsgranskning
Intern peer review har genomförts 26 maj 2016 av Professor Jan Andersson. Björn Peters har genomfört justeringar av slutligt rapportmanus. Forskningschef Jonas Jansson har därefter granskat och godkänt publikationen för publicering 6 december 2016. De slutsatser och rekommendationer som uttrycks är författarens/författarnas egna och speglar inte nödvändigtvis myndigheten VTI:s
Innehållsförteckning
Summary ...7
Sammanfattning ...9
1. Introduction ...11
1.1. The concept of self-estimation of driving ability ...11
1.2. Feedback ...12
1.3. Development of the training program ...14
1.4. Objectives...14 1.5. Hypotheses ...14 2. Method ...15 2.1. Participants ...15 2.2. Apparatus - simulator ...15 2.3. Training program ...17
2.3.1. Instructions and type of feed-back ...18
2.4. Measures ...19
2.4.1. Pre and post questionnaires ...19
2.4.2. UFOV (Useful Field of View) ...20
2.4.3. Driving performance ...20
2.5. Procedure ...20
2.6. Analysis ...21
3. Results ...22
3.1. Entry questionnaire ...22
3.2. Cognitive tests vs subjective rating of driving performance ...22
3.3. Pre-training assessment performance scores and penalty points...23
3.4. Post-training assessment performance scores and penalty points ...24
3.5. Changes with respect to estimator groups ...28
3.5.1. Progression during training – all three visits ...29
3.6. Drivers’ opinion ...31
4. Discussion ...32
4.1. The concept of over and under estimation ...32
4.2. Training results ...32
4.2.1. Impact of feedback on training results ...32
4.2.2. Training progression ...33
4.2.3. Feedback modality and timing ...33
4.3. Participants opinion – final questionnaire ...33
4.4. Comments from the participants ...34
4.5. Experiences made developing the training program ...34
4.6. Technical problems, simulator sickness and further development – the future ...35
4.7. Conclusions and recommendations for the future ...35
Summary
Evaluation of driving simulator based training for older drivers in Sweden
by Björn Peters (VTI), Helena Selander (Mobilitetscenter), Christina Stave (VTI), Jonas Andersson Hultgren (VTI) and Andreas Jansson (VTI)
Being able to assess your own performance can be vital to maintain safe mobility for older drivers. Overestimation can lead to increased risk of being involved in a crash and underestimation to unjustifiable restrictions in mobility. A pre/post intervention study was conducted with the aim to improve older drivers’ ability to assess their own driving performance. The aim was not to improve performance per se but the ability to assess, i.e. to calibrate themselves. Thus, a driving simulator program was developed and evaluated with a group of 36 older drivers. However, due to simulator sickness only 21 driver completed the study. Drivers repeatedly assessed their driving performance by answering the question “How well do you think you performed on the driving task? (1 = very bad to 5 = very well)”. As a reference of correctly assessed driving performance we used an experienced occupational therapist (specialised in driver assessment) who assessed the drive with the same scale (expert assessment).
Feedback can be an effective tool for change, which we wanted to evaluate. Thus, feedback to the drivers were given as a specification of errors made (e.g. forgot to use direction indicators, driving too fast, etc.). Feedback could also include information on correct behaviour (e.g. give way to pedestrians, keeping the right speed etc.). Thus, the drivers were divided into two groups: one (n=11) who were told of their misses and one (n=10) who were also informed about their correct behaviour. Training was done at three different occasions.
It was found that the average deviation from correct assessment changed from initially -0.7 (under estimation) to 0.1 at the final training occasion, i.e. they became more coherent with the expert’s assessment or in other terms better calibrated. It was also found that those individuals with the largest deviations initially improved their self-assessment after training. However, there were no differences between the two feedback groups in terms of ability to self-assess. Performance measured as penalty points were not expected to change per se and this was confirmed considering the total group. However, there was a difference between the groups in that the group who only learned about their mistakes degraded in performance while the group who also was told of their correct behaviour improved their performance. Other differences between the groups were that the group who were only informed about their mistakes were less satisfied with the simulator experience and the training progression. This is in line with the observed difference in terms of performance improvement. Thus, it can be concluded that simulator based training can be used to improve older drivers’ ability to assess their own performance and feedback plays an important role but should be further investigated. In this study the same feedback was given to all participants without considering if they over or under estimated their ability as we could not classify them before training started. Most likely feedback provided should be tailored according to estimator category (i.e. overestimators should be given feedback that decrease the tendency to overestimate and vice versa). Simulator sickness, as observed in this study, might hamper the use of simulators, specifically with older drivers and further work is needed to decrease the problem. The study was also done with the assumptions that improved ability to assess performance in a simulator should transfer to real driving conditions. However, this remains an open question.
Sammanfattning
Utvärdering av simulatorbaserad träning för äldre bilförare i Sverige
av Björn Peters (VTI), Helena Selander (Mobilitetscenter), Christina Stave (VTI), Jonas Andersson Hultgren (VTI) och Andreas Jansson (VTI)
Förmågan att kunna bedöma sin körförmåga korrekt kan vara avgörande för en säker mobilitet på äldre dagar. Överskattning kan leda till en ökad risk och underskattning kan leda till obefogade mobilitets-inskränkningar. En före/efter interventionsstudie genomfördes med syfte att förbättra äldre bilförares förmåga att bedöma sin egen körförmåga. Syftet var inte att förbättra körförmågan i sig utan förmågan att bedöma sig själv, det vill säga att bli bättre kalibrerad. Således utvecklades och utvärderades ett simulatorbaserat träningsprogram med en grupp på 36 äldre förare. Simulatorsjuka (illamående), gjorde dock att endast 21 förare kunde genomföra studien i sin helhet. Deltagarna fick vid upprepade tillfällen bedöma sin körförmåga genom att svara på frågan ”Hur bra tycker du att du körde?
(1 = mycket dåligt till 5 = mycket bra). En erfaren arbetsterapeut (specialiserad i att bedöma kör-förmåga) gjorde expertbedömningar av körningarna med samma skala som en referens på korrekt bedömd körförmåga.
Återkoppling kan vara ett effektivt verktyg för förändring, detta verktyg ville vi utvärdera i vår studie. Således, fick deltagarna återkoppling i form av en lista på vilka fel de hade gjort efter varje övning (t.ex. glömde använda körriktningsvisare, körde för fort). Återkoppling kunde också ges som information om vad som var rätt (t.ex. lämnade företräde till fotgängare, höll rätt hastighet). Således delades gruppen i två grupper en (n=11) som bara fick veta vilka fel de hade gjort och en (n=10) som även fick veta vad de hade gjort rätt. Träningen genomfördes vid tre olika tillfällen.
Utvärderingen visade att den genomsnittliga avvikelsen från korrekt bedömning ändrades från att initialt vara -0,7 (underskattning av körförmåga) till 0,1 vid det avslutande tillfället, det vill säga deltagarna blev bättre kalibrerade i förhållande till expertbedömningen. Man kunde också se att individer som avvek mest initialt förbättrade sin bedömningsförmåga. Emellertid gick det inte att se några skillnader mellan grupperna som fick olika återkoppling med avseende på bedömningsförmåga. Körprestation som bedömdes med hjälp av felpoäng (olika typer av fel gav olika felpoäng, dvs. kollision gav mer fel än att glömma körriktningsvisare) förväntades inte i sig att ändras på grund av träningen och detta bekräftades när man betraktade hela gruppen (n=21). Men det visade sig finnas en skillnad mellan grupperna på så sätt att de som enbart fick veta sina fel hade fler felpoäng vid sista tillfället än vid första, medan gruppen som fick både veta vad som var fel och vad som var rätt hade mer fel i början än i slutet. Andra skillnader mellan grupperna var att de som bara fick veta sina fel var mindre nöjda med simulatorträningen och förändringen (i svårighetsgrad) mellan tillfällena än den andra gruppen.
Studien visade således att simulatorbaserad träning kan användas för att förbättra äldre bilförares förmåga att bedöma sin körförmåga och att återkoppling spelar en viktig roll men mekanismerna bakom behöver studeras mer. I denna studie fick alla samma återkoppling utan att vi beaktade om de var över- eller underskattare. Detta berodde på att vi inte kunde klassa deltagarna innan de påbörjade träningarna. Troligtvis borde man anpassa återkopplingen till olika skattarkategorier (dvs. överskattare skulle få återkoppling som minskar tendensen till överskattning och vice versa). Simulatorsjuka (illamående) som observerades i denna studie kan vara ett allvarligt hot mot att använda
simulatorbaserad träning för just äldre förare och ytterligare arbete är nödvändigt för att minska problemen. Studien genomfördes också med förhoppning om att förbättrad förmåga att bedöma den egna körförmågan skulle kunna överföras till verklig bilkörning men detta är fortfarande inte möjligt att besvara.
1.
Introduction
This report describes the Swedish evaluation results of the SafeMove simulator based training
curriculum as developed in Sweden. The work described was preceded by a literature review on driver training needs for older drivers (Hay, et al., 2013b) and a collaborative work to develop a training curriculum (Richard et al., 2014). Even if the basis for developing simulator-based training was the same for both Sweden and France the actual implementation was somewhat different. Furthermore, in Sweden we focused only on simulator training but in France both cognitive and simulator training was used. For details about the French evaluation see (Hay et al., 2013; M. Hay et al., 2014).
1.1.
The concept of self-estimation of driving ability
A simulator based training program was developed with the aim to help older drivers to correctly estimate their own driving ability. The development was done within a French-Swedish collaborative project called SafeMove (Peters, Dukic, Fabrigoule, Levin, & Marin-Lamellet, 2013). As have been discussed in several other project reports (Hay et al., 2013) some drivers overestimate while others underestimate their ability but also some make correct estimations. This concept of self-estimation of ability has been deeply discussed, even so it is very hard to precisely define and quantify the three classifications (i.e., over estimate, under estimate and correct). Despite the complexity of the concept, it seems quite rational. The majority of older drivers are not involved in crashes and this can be an effect of a correct estimation of own ability even if there can be other explanations e.g., other road users “rescued” a critical situation. Thus, over estimators are likely more riskier drivers, not only for themselves but also for other road users. These drivers are likely to turn up in crash statistics but usually, there is not just one single cause for an accident. Under estimators are probably more reluctant even to drive and thus even more difficult to identify unless searching for drivers who have given up driving.
What have been said above can be applied to drivers of all age but in this case, we have focused on older drivers as they are a rapidly expanding group of drivers, with the aim to support safe mobility in older age. Even if, deviant self-assessment could be seen as a personal trait persisting when growing old, we might see other causes to incorrect self-assessment e.g. lack of understanding age related functional decline. We can both see ourselves as higher or lower performers compared to what we actually are. Defensive driving, often promoted for older drivers, can have side effects e.g. unrealistic beliefs of being able to master critical situations if needed. General (prejudicial) attitudes in society of older drivers as specifically risky drivers might contribute to an unrealistic degraded self-assessment. Ageism is also a factor that can promote a behaviour expected to be viewed as very competent, e.g. to choose a higher speed (Selander, Lee, Johansson, & Falkmer, 2011). This could lead to a driving style aiming to be considered as competent driving behaviour, i.e. not to be seen as an older driver
disturbing other road users. Thus, there are several factors that can contribute to an incorrect or unrealistic self-assessment among older drivers (Stave, Peters, Willstrand, & Broberg, 2014). Several attempts have been made to find a realistic way to classify drivers in to correct, under, and over estimators of own ability (Horswill, Sullivan, Lurie-Beck, & Smith, 2013; Marottoli &
Richardson, 1998). However, a general principle has been to compare self-assessment with some more or less objective measure on ability (Ackerman et al., 2011; Horswill et al., 2013). Crashes and near crashes are very uncommon thus, we usually have to rely on driving behaviour data as e.g. time based safety margins like Time-To-Collision (TTC) but also expert judgement based on observations of behaviour (Marottoli & Richardson, 1998). However, observations in real traffic are a subjective measure from an assessor point of view, i.e., based on their background and the protocol used. Moreover, we wanted to compare specific traffic scenarios and driving behaviours. Thus, in this study we compared the drivers own assessment of driving performance with the test leader’s assessment in a simulator to increase the reliability, but also to use the same 5-grade scale. Beyond that, we also compared results from the test Useful Field of View (UFOV) (K. Ball, Owsley, Sloane, Roenker, &
Bruni, 1993), which can be translated into risk (Cross et al., 2009) to self-assessed performance as an alternative approach.
Considering the existence of misconception of own driving ability, we like to investigate the potential in using simulator based training to improve self-assessment. The rational for this is that simulators have some potential benefits, e.g.:
exposure to critical/dangerous situation without risk
highly controlled situations – accurate data (internal validity) possibility to train exactly the same situation over and over provide detailed feedback
However, there are also problems with using simulators:
risk for simulator sickness (nausea, vomiting, headache etc.)
lack of realism, both in scenario complexity and vehicle characteristics sensation of speed in a 2D world not realistic
steering control without force feedback is difficult
Thus, in a simulator it is possible to let drivers experience situations where both over and under estimation might manifest itself in different behaviours, e.g. making a left turn at an intersection with either a too short time gap or being too hesitant. Furthermore, allowing the driver to assess her/his own driving (bad/good) and compare to expert assessment or driving data can reveal deviant
self-assessment. Feedback is an effective approach to both improve performance and provide insight of own behaviour. Thus, in order to help the driver to a better self-assessment we used two alternative feedbacks only negative feedback (driving errors) or both positive (correct behaviour) and negative feedback during the training. Feedback was given directly after the driver self-assessed the
performance. The simulator software included a possibility to replay a drive so that the driver could view his/her own performance, even from different angles e.g. side view or bird’s eye view. However, after some initial trials it was found that looking at the drive from the driver’s seat while not driving caused frequent feelings of illness why the idea was abandoned.
1.2.
Feedback
Perception control theory is a theory that can be linked to the estimation of own capacity. One of them is of human functioning which was developed by Powers (Powers, 1978). This was an outgrowth of the cybernetic model in engineering showing how systems are regulated through feedback based on the results of their previous motions. “Action is driven by the difference or error” (Powers, 1991). According to this conceptual scheme, the nervous system embodies a hierarchy of interconnected feedback loops with upper-level loops providing the reference signals that serve as goal settings for subordinate loops. Hollnagel (Hollnagel, 2002) stats that human performance varies in level of control, i.e. in terms of how orderly it is, and that thinking and acting take time and occur in a context where time is limited. Very few existing models are capable of doing so because they focus on internal information processing rather than on performance in a dynamic environment. Hollnagel (2002) describes the contextual control model, which distinguishes among four characteristic control modes (strategic, tactical, opportunistic and scrambled) and three time parameters (time to evaluate, time to select and time to act) (Hollnagel, 2002). This is a process model linked to cognitive abilities,
regulating and correcting errors in complex tasks taking in account time pressure and feedback. This may clarify training possibilities in manoeuvring and interplay with other drivers but may be limited in understanding higher order cognitions or self-evaluation.
Social cognitive theory is based on the perspective that people function as anticipative and self-evaluating proactive regulators of their motivation and actions (Bandura, 2001). A theory focusing feed-forward self-regulation differs from control theories rooted solely in a negative feedback control system aimed at error correction. Self-efficacy beliefs regulate human functioning through cognitive, motivational, affective, and decisional processes (Bandura, 1977). They affect whether individuals think in self-enhancing or self-degrading ways, how well they motivate themselves and persevere in the face of difficulties. It also regulates their decisions as well as emotional well-being and their vulnerability to stress and depression. Self-efficacy is defined as ‘beliefs in one’s capabilities to organize and execute the courses of actions required to produce goal attainments’. Bandura writes that although efficacy beliefs are multifaceted, social cognitive theory identifies several conditions under which they may co-vary even across distinct domains of functioning (Bandura, 1977). Self-efficacy is measured by asking people ‘how confident they are’ to achieve a specific behaviour. There are scales of driving efficacy e.g. Bandura, (Bandura, 2006) and George et al. (2007) . The concept of self-efficacy is very near to self-evaluation and to manageability. Stave et al. (2006) found in a study that increased risk awareness led to safe behaviour if mediated by manageability. If no manageability were perceived the risk awareness led to stress and passivity concerning safety even to denial of risk, due to the dissonance with behaviour. If the driver does not find ways to compensate or ways to avoid demanding driving situations, or find assistance or training, he/she may cease driving or deny the risk. Support in form of information on strategies, training or technical support may give these drivers an increased feeling of self-efficacy and manageability in order to remain in safe mobility.
Few studies have focused on under estimation of driving ability, probably due to the absence of link to traffic accidents. Baldock et al. (2006) writes that those drivers who do lose confidence in difficult driving situations do tend to avoid those situations if it is possible to do so. There are some situations, however, like driving alone and driving on high traffic roads that are difficult to avoid if one wishes to maintain mobility. For this group of driver, it is not effective to support avoidance but to train with positive feedback. When the over estimator drives and no accident appears the overestimation will strengthen. For the under estimator withdrawal from difficulties may strengthen the attitude of underestimation. This theory is called operant conditioning introduced by Skinner (Skinner, 1958). It implies that behaviour can be strengthened or changed depending on the consequence of behaviour and can be used for training. You can use positive or negative reinforcement, i.e. add or subtract by feedback on behaviour. A possible exercise is to encourage under estimator and to point out the error in over estimator assessment / behaviour. This would mean different training for the two groups of estimators.
A simulator based training called ‘error training’ was investigated by Ivancic and Hesketh in terms of effects on driving skill and self-confidence by learning from errors in a driving simulation (Ivancic & Hesketh, 2000). Error training led to better skill acquisition compared to errorless learning. Error training also reduced self-confidence but did not if guided. Thus, feedback is an important aspect to consider. This may be a training approach that could be used for over and under-estimators in order to calibrate their ability.
The focus of SBT training has previously been on the technology but focus should be rather be turned to didactics (Vlakveld, 2006). Question such as: “How should the training be designed?”, “How much and for how long?”, “Should feedback be used and how?” “Direct augmented feedback?”, “Can several sense modalities enforce impact?” Feedback interventions have been supposed to have positive effects on performance. Kluger and DeNisi suggest that feedback interventions effectiveness decreases as attention moves up the hierarchy closer to the self and away from the task (Kluger & DeNisi, 1996). These findings are further moderated by task characteristics that are still poorly understood. In general,
all education should address coherence between goal, training and testing so called constructive alignment (Biggs, 1996) However, this is a challenger using simulators where much remains to be investigated pedagogically and how to relate this to the training of older persons is still unclear. Finally, it is important to consider the possibility that over- and under -estimators will be differently influenced by the same SBT-training and specifically in terms of feedback. The assumption to be tested in SafeMove will be that positive feedback is more relevant to under estimators and negative to over estimators. However, design of feedback might be much more complicated than that.
1.3.
Development of the training program
The selections of training lessons were based on previous research about older drivers’ crash data and challenging situations. A literature review (Lallemand, Paire-Ficout, Lafont, Levin, & Fabrigoule, 2013) and postal survey (Henriksson, Levin, Peters, & Willstrand, 2014) was made earlier in the project aiming to e.g. identify potential problem for older drivers. These results were used to select scenarios for training in simulators. One great challenge was that the training should occur in city environments, interacting with several other road users (e.g. cars and pedestrians), speed changes and left-hand turns in T-junctions. These sorts of scenarios are known to trigger simulator sickness. To counter act this to some extent, a very careful introduction procedure was used. In total seven lessons were developed, each with three difficulty levels. For each of these situations penalty scores were implemented as a means to provide feedback.
1.4.
Objectives
The purpose of this study was to evaluate the SafeMove simulator based training curriculum as developed in Sweden with respect to improved self-assessment and user acceptance (i.e. is this form a training acceptable or even desirable). Thus, the aim was not per se to improve (simulator) driving performance.
1.5.
Hypotheses
The primary hypothesis was that simulator based training with feedback to the drivers can contribute to improve self-assessed performance. Furthermore, it was expected that feedback content should have an impact on the on training results. The aim was not per se to improve (simulator) training but the ability to assess own performance. Feedback can be an effective means to understand your own behaviour, Feedback can be given in many forms and one aspect of feedback we considered interesting to examine was to investigate the effects of different contents of feedback. For a further discussion on this se 2.3. Thus, providing both negative (incorrect behaviour) and positive (correct behaviour) feedback will give better result in terms of improved ability to self-assess performance than only negative feedback. Finally, it was expected that those who received both positive and negative feedback should be more positive to the training. Simply because positive feedback is usually considered more pleasing regardless of estimator type.
2.
Method
The study was designed according to the hypotheses formulated. Thus, participants were randomly allocated to either of the two conditions, i.e., only negative feedback or both negative and positive feedback. In the end, eleven drivers received negative feedback and ten participants received both positive and negative feedback. The participants had to come three times to participate in the study. Initially, they were acquainted with the simulator by driving a simple route. Thereafter, the actual data recording started with a pre-training baseline drive and followed by the six specific training lessons. For each occasion, the training difficulty increased. After completing all lessons, they made a post training drive (identical to the initial baseline drive, from the first occasion). Further description under 2.3.
2.1.
Participants
Participants were recruited from a previous on-road study in the SafeMove project (Willstrand, Selander, Peters, & Broberg, 2015). Of those participants, 27 were interested to participate in this project. However, due to simulator sickness, nine additional volunteers were recruited with help from the other participants, i.e., husband/wife or friend. Thus, total 36 drivers fulfilled the inclusion criteria, i.e., over 70-year-old and active drivers. However, in the end only 21 participants were able to
complete the training. One participant had to abandon further training due to acute illness and another 14 (40%) could not complete the training due to simulator sickness. During the recruiting, participants were asked about their susceptibility to motion sickness. Characteristics for the 21 participants are seen in Table 1. The participants received 600 SEK (approx. 60 Euro) as a reward and they were also compensated for their transport costs.
Table 1. Characteristics for the 21 participants.
Gender (n) Mean age (sd) Annual distance driven (mean (sd)) Male 14 78.50 (4.2) years 10075 (5766) km
Female 7 78.43 (3.6) years 11445 (5590) km
Total 21 78.48 (3.9) years 10532 (5605) km
There was no significant difference (5%) between male and female participants with respect to age (p=0.97) and annual distance driven (p=0.67). Furthermore, there was no significant difference between the two experimental groups (i.e., negative feedback or negative and positive feedback), with respect to age (p=0.81) and driven distance (P=0.36). Table 2 provides some basic data.
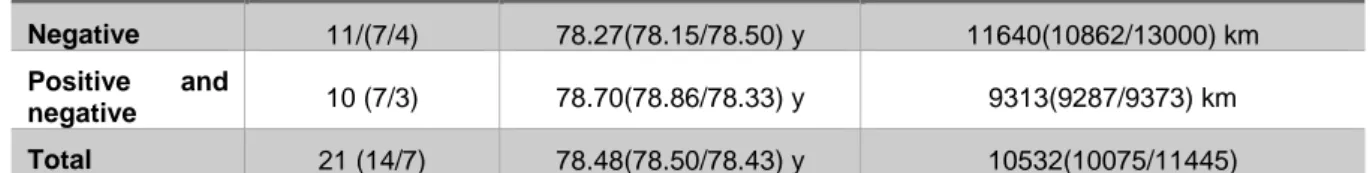
Table 2. Mean age and annual distance driver for the two experimental groups.
Group Num (male/female)
Mean age (male/female) Mean annual distance driven (male/female) Negative 11/(7/4) 78.27(78.15/78.50) y 11640(10862/13000) km Positive and negative 10 (7/3) 78.70(78.86/78.33) y 9313(9287/9373) km Total 21 (14/7) 78.48(78.50/78.43) y 10532(10075/11445)
2.2.
Apparatus - simulator
The simulator used was a commercial driving simulator developed for driver training. It was
developed by the German company Dr.-Ing Reiner Foerst GmbH. The simulator comes with Foerst’s own simulation software, but it has been adapted to run VTI’s own developed simulation software. The simulator hardware was built by components (steering wheel, pedals, dashboard etc.) from a Ford Focus, three 40-inch LCD screens, and a surround sound system. All the usual driver inputs are
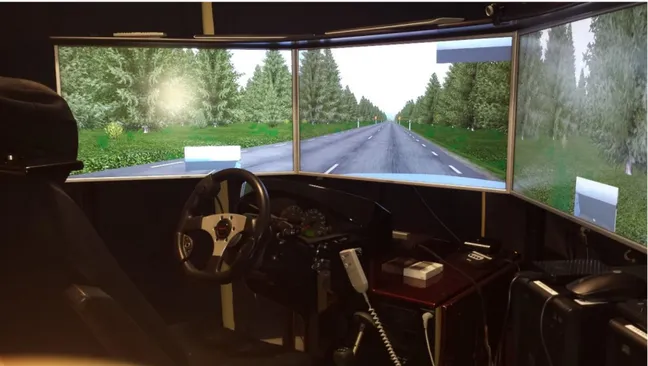
available, i.e. steering wheel, pedals, gear stick, dashboard. However, due to hardware limitations in the adaptation it was not possible to provide force feedback in the steering control. Force feedback is quite essential for the feeling of control (Peters et al., 2002). This limitation had a negative impact on steering, specifically in sharp turns at low speed. The road environment was rendered on the screens in front of the driver; including rear view mirrors (see Figure 1).
Figure 1. Driving simulator set-up.
The simulator and the sound system was controlled by one computer, the kernel, while three other computers were used to render the images. The computers are standard desktop PCs, running
Windows XP/7 or openSUSE Linux. The simulation is divided into several software applications, each responsible for its own part of the simulation. The kernel software controls the scenario (surrounding vehicles, etc.), runs the vehicle model, and sends updates to other computers (see Figure 2).
2.3.
Training program
The training program was specified and designed in collaboration with our French partners, i.e. we had basically the same training scenarios. Implementation of the Swedish training program was done mainly at VTI in Linköping but updates and bug fixes were done remotely. An approximately five minutes long driving scenario with various events was used to let the drivers get used to the simulator. At the beginning of this drive there was a red “floating” dot positioned on the road in front of the driver. The driver was instructed to focus on the dot until it disappeared. This was done with the aim to minimize the occurrence of simulator sickness.
A longer “Baseline-drive” (12 minutes) with a mixed traffic environment and more or less critical situations was used for pre- and post-assessment drive. For the specific training program for each visit, see Table 3.
Table 3. The training program for each occasion with specific training scenarios and increasing difficulties (A-C).
The training set up
1st visit “Warm-up”, short drive “Baseline”; pre-assessment drive Lessons 1A-6A
2nd visit UFOV Lessons 1B-6B
3d visit Lessons 1C-6C “Baseline”; post-assessment drive
The training program consisted originally of seven lessons but one lesson called “car following”, was never used as it was too difficult for the driver to maintain a controlled distance to a lead vehicle due to technical limitations in the current simulator, i.e. accelerator pedal was difficult to sufficiently control over an extended time. Each of the lessons were available in three versions (increasing difficulty; A-C). Each training lesson was about 1 – 2 minutes long, except the navigation task, which took 3 – 5 minutes to complete. The six training lessons used were:
1. Traffic light in urban environment – three levels (decreasing time distance when traffic lights turns to yellow and car behind driving successively closer)
2. Pedestrian crossings in city – three levels (with and without traffic lights, more or less obscured pedestrians potentially entering the road)
3. Two consecutive left turns (city) with oncoming traffic (increasing gap) – three levels (separate lane, no separate lane, traffic from behind, flashing lights to encourage the driver to turn)
4. Entering a motorway with traffic – three levels (traffic on motorway, merging in a safe way with other vehicles, heavy traffic in entering lane driving at lower speed)
5. Overtaking on motorway – three levels (increasing complexity in interaction other traffic) 6. Navigation – driving to a specific place following road signs, on the way more or less critical
situations occurs (e.g. pedestrians entering the road, bicyclists, bus stops etc.) – three levels (increasing situation criticality)
All variables were specified for the pre- and post-assessment drives and all six lessons. When it was relevant to measure reaction time (e.g. brake reaction time during a critical situation) they were recorded. An attempt was also made to specify penalty points for each of the assessment variables. Furthermore, all driving data were recorded to allow for replaying a drive. This was initially, thought
to be a means for feedback but it was never used due to the potential risk of imposing nausea (simulator sickness). Examples of assessment variable used:
Collision
Incident - TTC below 0.5 sec – near collision with other road user Road departure (2 wheels)
Road departure (4 wheels) Hard braking (g over 0,6 m/s2)
Driving too fast (10, 15 km/h over signed speed limit) Yellow light driving
Red light driving
Not using direction indicators (right and left) Disregarding pedestrian priority at marked crossings
2.3.1. Instructions and type of feed-back
The drivers were given written instructions shown on the central screen before all lessons or drives. In general, drivers were instructed to follow traffic rules but also to drive as they usually do in similar situations in real traffic. After completing either one of the assessment drives or each of the lessons, the following question was shown on the central screen: “How well do you think you performed on the driving task? (1 = very bad to 5 = very well)”. The test leader recorded scores given by the participants.
Feedback was given after each lesson as written text on the central screen after the participant had responded. Thus, we developed a means to provide either only negative or both positive and negative feedback. Here are some examples of feedback given:
No errors – “Well done! No remarks” (Positive feed-back).
Speed keeping – “You kept the speed limits” (positive feed-back) or “You drove too fast at x occasions” (negative feed-back).
Using indicators – “You remembered to use the indicator when entering the motorway” (positive feed-back) or “You forgot to use the indicator when entering the motorway” (negative feed-back).
Give way for pedestrians – “You correctly gave way to crossing pedestrians” (positive feed-back) or “You forgot to give way to crossing pedestrians” (negative feed-feed-back).
2.4.
Measures
2.4.1. Pre and post questionnaires
Initially all participants answered a questionnaire with 13 questions, aiming to capture some basic data on health, driving habits and subjectively assessed performance. All participants filled out the
questionnaire before starting to drive in the simulator. The questions used were the following: Gender
Age
Your current health status (1 = very bad to 5 = very good) How often do you drive (once every month or less to every day)
Do you occasionally drive longer distances (50 km or less, 50 – 150 km, more than 150 km) Weekly driven distance
I am a good driver. (this question was used in previous survey) (1 = disagree strongly to 5 = I agree strongly)
How do you consider your driving performance compared to your peers? (1 = very bad to 5 = very good)
How do you consider your attention in traffic compared to your peers? (1 = much worse to 5 = much better)
My driving style implies I take risks in traffic. (1 = disagree strongly to 5 = I agree strongly) Do you think it is fun to drive? (1 = not at all fun to 5 = much fun)
Are you afraid when you drive? (1 = never to 5 = very often)
A second (post) questionnaire with six questions was used after the third training to find out what the participant thought of the training programs. It was also possible to provide written comments after each of the six questions, which were the following:
How did you experience driving in the simulator? (1 = very good to 4 = very bad) What do you think of the training lessons? (1 = very good to 4 = very bad)
What do you think of the pace and difficulty levels? (1 = very good to 4 = very bad) How do you think you drove in general? (1 = very good to 4 = very bad)
How do you feel after the drive? (1 = very good to 4 = very bad) Is there something you think we can improve? ---- free answer
2.4.2. UFOV (Useful Field of View)
The second time they came for training, all subjects completed the UFOV test (Useful Field of View). The UFOV is a PC-based visual and cognitive test and comprising three subtests, with increasing difficulty, measured in milliseconds. The UFOV test measuring perceptual speed and selective attention. It is quite frequently used to assess fitness to drive (see
http://www.biopticdrivingusa.com/ufov-usefull-field-of-vision/). The first subtest measures processing speed, the second measures processing speed for a divided attention task and the third subtest
measures processing speed for a selective attention task (Edwards et al., 2006). Research has shown, prospectively and retrospectively, that persons who perform poorly on this assessment are over two times more likely to suffer a crash (K. K. Ball et al., 2006; K. Ball & Owsley, 1993; Owsley et al., 1998). Even if it has been debated, the three scores can be combined to produce an overall
performance score or interpreted in to a risk level (1 = very low to 6 = very high) of being in involved in a crash (Cross et al., 2009). The risk scores were compared to the drivers’ self-assessment of driving performance (response to “I am a good driver”) to identify possible over and under estimators (see Table 6).
2.4.3. Driving performance
Driving performance was recorded in several ways. Basically, all driving data was recorded but as the primary objective with the training was not to improve performance, this data was only used to provide feedback to the driver based on a selection of variables as described above. However, reaction time to critical events was recorded, when appropriate. The simulator program included a report generator. This function was used to print a test report for each individual every time they came to complete a training session. The report included all assessment variables and total penalty scores per lesson. In addition, the driver had to rate their driving performance after each training lesson. Thus, the question “How well do you think you performed the driving task?” was displayed on the central screen. A rating scale (1 = very bad to 5 = very well) was used to answer the question. Before noting the driver’s own score, the test leader did a rating of the driver’s performance using the same scale. Furthermore, the test leader wrote down the participants’ comments, if they explained in words the reason for a specific score. Only one test leader was used in this experiment.
2.5.
Procedure
The study took place at Mobilitetscenter in Gothenburg during winter - spring 2015. Participants were primarily recruited among older drivers from a previous on-road study (Willstrand et al., 2015). As there was considerable dropout due to simulator sickness and unavailability, we had to look also for additional participants.
Participants had to come three times in order to complete the training program (Table 3). At the first occasion, an informed consent form was used to inform the participant about the aim and content of the study and their rights to leave the study at any time without having to explain why. Once they agreed to participate they filled in the pre-questionnaire. Next step was to let them be acquainted with the simulator and the test leader was very observant during this drive in order to detect any signs of simulator sickness. It was also critical to let them experience the vehicle controls, i.e. steering and accelerator. Once they felt it was ok, they drove the pre-training assessment route (Baseline) and in the end they were asked to rate their performance. The pre-training assessment drive was followed by the six lessons all on level one (i.e., A). This completed the first occasion. Next time they did all six the lessons on level two (i.e., B) and the UFOV test. During the last and third occasion, they drove the all lessons on level three (i.e., C), followed by the post-training assessment (Baseline) drive and answered the post-training questionnaire. Each training occasion lasted approx. 1.5 – 2 hours.
2.6.
Analysis
3.
Results
This chapter summarize the essential results.
3.1.
Entry questionnaire
The entry questionnaire with seven questions was completed by all participants. The results can be seen in Table 4. In summary, the participants considered themselves as being in good health. They also agreed that they were good drivers, even better than the average when comparing themselves with peer drivers. They disagreed to the statement that their driving style was risk full. They also
considered driving as joyful and they were more or less never afraid when driving. Furthermore, there were no significant differences between the two groups with respect to any of the seven questions Table 4. Mean responses to pre-test question on health and driving for all and the two experimental groups.
Question Total (21) Positive and negative (10)
Negative (11)
1. Your current health status (1 = very bad
to 5 = very good) 4.24 4.00 4.45 2. I am a good driver. (1 = disagree
strongly to 5 = I agree strongly) 3.90 3.70 4.09 3. How do you consider your driving
performance compared to your peers? (1 = very bad to 5 = very good)
3.90 3.70 4.09
4. How do you consider your attention in traffic compared to your peers? (1 = much worse to 5 = much better)
3.86 3.70 4.00
5. My driving style implies I take risks in traffic. (1 = disagree strongly to 5 = I agree strongly)
2.15 2.22 2.09
6. Do you think it is fun to drive? (1 = not
at all fun to 5 = much fun) 4.52 4.40 4.64 7. Are you afraid when you drive? (1 =
never to 5 = very often) 1.38 1.60 1.18
The replies to questions 2 (good driver), 3 (performance vs. peers), 4 (attention) and 6 (fun) were strongly correlated (p<0,01) to each other. Question 6 (fun) was negatively correlated to 7 (afraid; p<0.01) and positively to 4 (attention; p<0.01). Question 7 (afraid) was negatively correlated to 6 (fun; p<0.01) and 4 (attention; p<0.05). Replies to question 5 was not correlated to any of the other
questions.
3.2.
Cognitive tests vs subjective rating of driving performance
At the second occasion, all participants did the UFOV (Useful Field of View) test. The result is shown in Table 5. There was no significant difference between the two groups (p=0.88; p=0.77; p=0.78 respectively). However, the range was quite large.
Table 5. Results (mean, standard deviation and range for the total group) of UFOV1 to 3 for the 21 participants.
Group UFOV1 (ms) UFOV2 (ms) UFOV3 (ms)
Negative (11) 36.0 (17.2) 98.1 (92.5) 242.8 (115.2)
Negative & Positive (10) 34.8 (19.9) 86.9 (74.6) 229.1 (110.0)
All (21) 35.4 (18.1) (14-73) 92.8 (82.6) (17-270) 236.3 (110.1) (87-500)
The UFOV results was translated into the performance score or risk score (1 = very low to 5 = very high) of being in involved in a crash (Visual awareness, Inc, Chicago, IL, USA, 2009). The scores varied between 1 and 4 (“very low” to “medium to high”) for both groups. Comparing the results from the UFOV in terms of risk with the self-assessed estimation of performance “I am a good driver” (1 = I disagree strongly to 5 = I agree strongly) in the entry questionnaire provides a possible way to identify potential over and under estimators (see Table 6). The underlying idea is that if you think you are a good driver and the UFOV results suggest that you are at risk, it could be assumed that you overestimate your driving ability. While if you think you are a bad driver and the UFOV results indicate a low risk, then it might be that you underestimate your driving ability. However, the two scales measure somewhat different dimensions (risk vs. performance). Despite this it can be
interesting to compare the two results as we have no well-established way to determine if a driver can be categorized a as an over or under estimator.
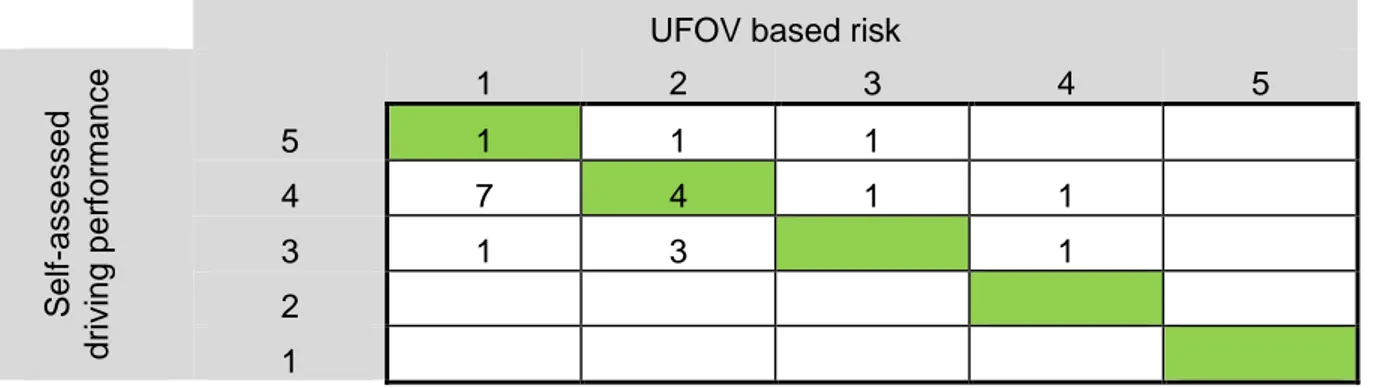
Table 6. Comparing UFOV based risk (1 = very low risk, 5 = high risk) with self-assessed driving performance (reply to the statement “I am a good driver” (1 = I disagree strongly to 5 = I agree strongly).
UFOV based risk
S el f-asse ssed drivi ng pe rf or m an ce 1 2 3 4 5 5 1 1 1 4 7 4 1 1 3 1 3 1 2 1
According to this classification, there should have been 11 under estimators and 5 over and 5 correct estimators. Similar results (i.e. more under than over estimators) were found when UFOV risk was compared to answers to other questions in Table 4. Interestingly, none of the seven pre-test questions listed in Table 4, correlated to the UFOV based risk scores. Thus, UFOV seems to measure a different dimension compared to what the pre-test questions capture. Probably, this should be viewed as indication of the complexity of the concept of over- and underestimation.
3.3.
Pre-training assessment performance scores and penalty points
Before the actual training began but after being acquainted with the simulator by an introductory drive, the drivers made a pre-training drive as a reference. After the completion of the drive, both the test
leader and the driver rated the driving performance on the 5-graded scale as previously described. Furthermore, the simulator software provided a test protocol, which listed all errors made and for each error, there was a penalty point. However, the protocol was not shown to the driver. Examples of items included in the protocol were described in section 2.3 above. Because steering was rather difficult due to lack of force feedback as discussed in 2.2), specifically when making 90 degree turns it was easy to cross lane boundaries. Thus, penalty points used in the analysis excluded lane-keeping errors. The penalty points for the two experimental groups are shown in Table 7 below. Depending on the individual driver, up to five situations occurred where the driver had to react by braking. If the driver was driving very careful, it was not always necessary to brake. This had an impact on the penalty points.
Table 7. Results (mean and standard deviation) of pre-training assessment drive; penalty points and performance assessment.
Group Penalty points Expert assessed performance (1-5)
Self-assessed performance (1-5)
Negative (11) 18.45 (10.30) 3.64 (0.81) 3.45 (0.52)
Negative & Positive (10) 27.60 (17.85) 3.50 (0.71) 3.40 (0.97)
All (21) 22.81 (14.78) 3.57 (0.75) 3.43 (0.75)
There were no significant differences between the two groups concerning penalty points (p=0.16), expert assessed (p=0.69) or self-assessed (p=0.87) performance. The self-assessed and expert assessed scores from the pre-training performances were compared to determine if over and under estimators could be identified. The result is shown in Table 8.
Table 8. Classifying participants as either under, correct or over estimator comparing self with expert assessed driving performance (“How did you (the driver) perform?”) (pre-training per group
(negative feedback/negative and positive feedback), under the diagonal under estimators, green correct, over the diagonal over estimators.
Expert assessed performance (1 = very bad to 5 = very well)
S el f-asse ssed drivi ng pe rf or m an ce (1 = ve ry ba d t o 5 = very w el l) 5 4 3 2 1 5 0/2 4 1/0 4/1 3 2/3 3/2 1/1 2 0/1 1
Thus, we can identify seven possible under estimators (3 receiving only negative feedback and 4 both negative and positive) and four over estimators (1 negative and 3 negative and positive).
3.4.
Post-training assessment performance scores and penalty points
Once the training was completed, i.e. after running the training lessons during the third visit, they made a post-training assessment drive. The drive was similar to the pre-training drive. As before the training, performance was assessed by the driver and an expert (test leader). The results are shown in
Table 9. In addition, there were no significant differences between the two groups with respect to penalty points (p=0.60), expert (p=0.42) or self-assessed (p=0.77) performance. Compared to the pre-training assessment it seems like self-assessed performance scores have increased while expert scores are the same.
Table 9. Results (mean and standard deviation) of post-training assessment drive penalty points and performance assessment.
Group Penalty points
Expert assessed performance scores (1-5) Self-assessed performance scores (1-5) Negative (11) 27.00 (15.64) 3.45 (0.82) 4.00 (0.77)
Negative & Positive (10) 23.33 (15.24) 3.70 (0.48) 3.90 (0.74)
All (20) 25.35 (15.17) 3.57 (0.68) 3.95 (0.74)
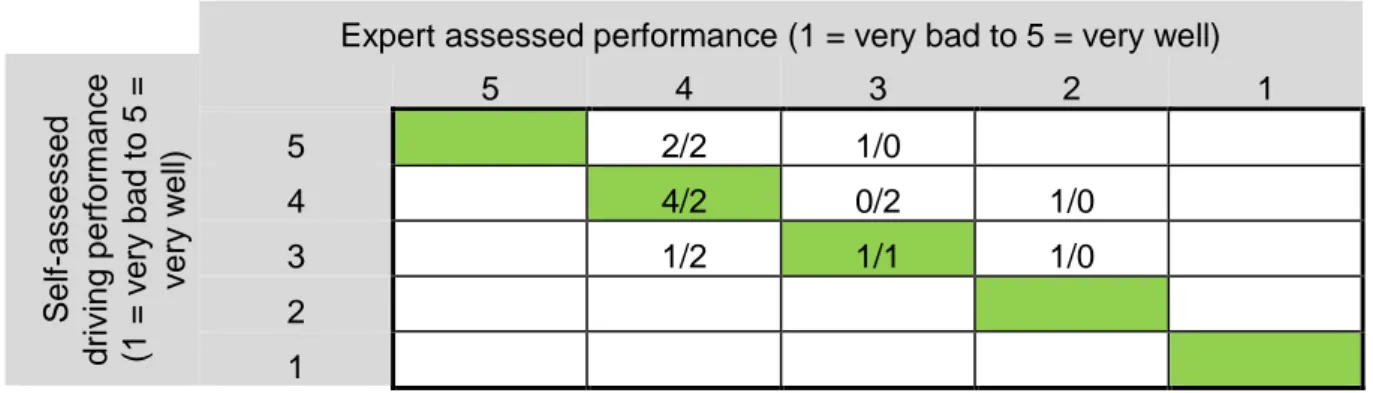
Thus, when comparing the expert’s’ scores with the self-assessed performance it was found that the number of over estimators had increased from four to nine (five negative feedbacks and four both negative and positive feedback). There were two drivers who according to UFOV data had a “mean to high” (4) risk of being involved in a crash (See Table 6). These two participants (8, 15) were also characterized as over estimators (and low performers) at the initial assessment drive but changed so they became more correct estimators after the training. This could be viewed as a positive result but this way to classify can be questioned. Moreover, at the same time, the number of correct estimators decreased from ten to eight (see Table 8 and Table 10). This result could be seen as a failure but it should be noted that the concept of over/under estimation is not very well defined. Thus, it might be valuable to look at the specific individuals and see how they changed regarding their self-assessed performance compared to expert assessment.
Table 10. Classifying participants as either under, correct or over estimator comparing self with expert assessed driving performance (“How did you (the driver) perform?”) post-training per group (negative feedback/negative and positive feedback), under the diagonal under estimators, green correct, over the diagonal over estimators.
Expert assessed performance (1 = very bad to 5 = very well)
S el f-asse ssed drivi ng pe rf or m an ce (1 = ve ry ba d t o 5 = very w el l) 5 4 3 2 1 5 2/2 1/0 4 4/2 0/2 1/0 3 1/2 1/1 1/0 2 1
The training aimed at improving the participants’ ability to improve self-assessed performance, i.e. in this case the aim was coherence with the expert’s scores. Thus, it is interesting to look at how the difference between self-assessed and expert assessed performance changed over time. This was done by calculating the mean difference between self and expert assessment during first and last training session (both baseline and training was included). During each training sessions the drivers should complete six lessons as described above. However, after a while it was found that left turn lesson
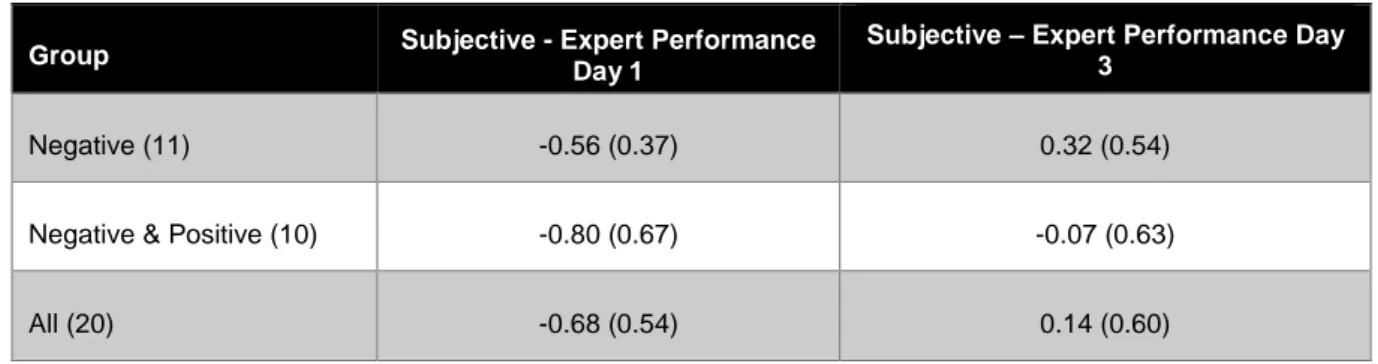
caused problems and was finally abandoned. Thus, results from the left turn have been left out in the analysis. Results are shown in Table 11. Even though, it seem like the group that received both positive and negative feedback were closer to being coherent with the expert, the only significant effect (F[1,19]=36.92,p<0.01) was that that all drivers improved their ability to self-assess performance (-0.68 vs. 0.14) which could be an effect of training and specifically feedback. Table 11. Mean differences between expert and subjectively assessed performance (Baseline and Training) first and last session. Closer to “0” means that test leader and participant agree. Thus, tentatively negative = underestimation and positive = overestimation.
Group Subjective - Expert Performance Day 1
Subjective – Expert Performance Day 3
Negative (11) -0.56 (0.37) 0.32 (0.54)
Negative & Positive (10) -0.80 (0.67) -0.07 (0.63)
All (20) -0.68 (0.54) 0.14 (0.60)
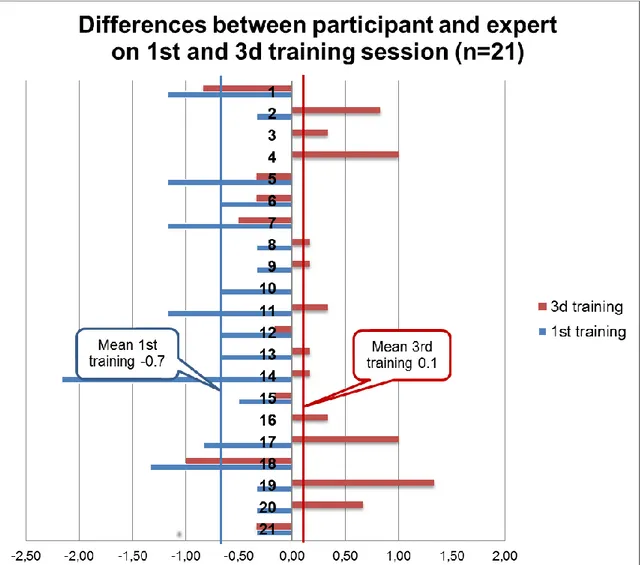
A further analysis was done in order to get a deeper understanding of the changes on individual levels. Figure 3 shows the individual changes and it is obvious that there is are a great individual differences.
Figure 3. Differenses in terms of performance scores between participant and expert on first and third training session (n=21). Closer to “0” means that test leader and participant agree. Thus, tentatively negative = underestimation and positive = overestimation.
Thus, it can be valuable to look even further at specific individuals and see how they changed regarding their self-assessment of their performance and to see if we can find some explanations in their comments. As previous mention, notes were taken to record participants thoughts about their scoring, i.e., self-assessment. Some comments were particularly prominent for some of our participants. Comments were usually given when the driver was shown the errors made which occurred after their scoring. Examples from four of our participants:
For one participant (no 4, Figure 3), the mean self-assessment score from the first session was 4.3, compared to the expert-assessment that was 4.4, which means their rates were rather similar (correct estimation). However, during the third session the rates had changed to a great difference between the participant and expert; 0.9 (overestimation). A quote from this participant was when the errors where shown and after scoring the performance:
“I know I did this, but I still think I drove well”.
For another participant (no 10, Figure 3) the difference between the subjective and the expert mean scoring was -0.7 initially but had changed to 0 after the third session, i.e., no difference or correct estimation. A quote form this person was:
“I probably drove too fast but otherwise it went ok. I think I followed all the rules”.
One participant (no 17, Figure 3), had after the first session a mean self-assessment score of 3.8 but the expert had rated the performance 4.7 (mean); i.e., the difference was -0.9 or underestimation. However, after the third session the differences had changed to (+) 1.0 (overestimation). A quote from this person was:
“I was a bit too close but in reality it is not like that…Now crossed the middle line, but it was the cyclist’s fault”.
For yet another participant (no18, Figure 3), the mean self-assessment score from the first session was 3.3, compared to the expert-assessment that was 4.7, which means a rather large difference of -1.4 (underestimation). After the third session there was only a smaller change, i.e., the difference was then -1.0 (underestimation): Example of a quote from the participant:
“I saw the yellow car behind me, but when I began to pick up speed, I began to wobble – it was bad! Poor timing when I drove on the highway. I don´t know if I had chosen another speed in real life”
Now given that there was an improvement for the total group with respect to coherent assessment of performance it might be interesting to consider the change in performance, i.e. penalty scores. Interestingly, it was found that there was no significant difference in terms of penalty points between pre- and post-training for the total group (p=0,76). However, there was an significant interaction (F[1,18]=5.00,p<0.05) so that the group who received information about what they missed had higher penalty scores after compared to before (27.0 vs 18.5) while the group that was also informed about what they did right had lower penalty scores after compared to before (29.8 vs. 23.3). Thus, positive feedback could possibly have contributed to improved performance also.
3.5.
Changes with respect to estimator groups
Several attempts have been made in this study to classify participants as either over, under or
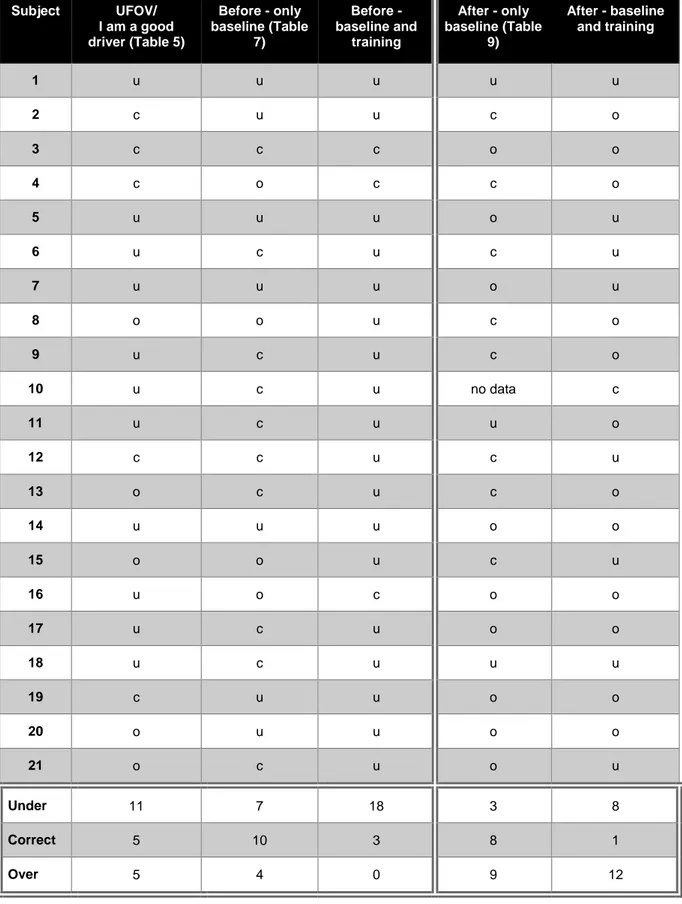
correct/coherent estimators (see Table 6, Table 8, Table 10 and Figure 3 and an overview in Table 12). A first rough approach was to compare self-assessed driving (“I am a good driver”) with UFOV based risk scores (column two in Table 12). However, these two scales are not strictly comparable as they measure different aspects driving, i.e. driving behaviour vs. risk. Then self-assessed performance was compared to an expert assessment of the initial baseline drive (column three in Table 12). This might be a better approach as the two scales aim to measure the same variable. According to Table 12 only 7 out of 21 are consistent in column two and three. A third attempt was made by calculating an average difference between self-assessed performance and expert addressed including both baseline and training lessons at the first training occasion (column four). What this shows is that there are many inconsistencies when the three approaches are compared. Comparing column two to three only six are coherent, column three to four only seven while column two and four are more consistent 12 of 21 but still close to 50%. In a similar fashion, we can look at the two right most columns (after training), only eight of 21 are coherent. While we can see the effect of training described in Table 12 (column four and six), i.e. more under estimators before and more over estimator after. Thus, it can be concluded that even if the concept of over and under estimation seems a tentatively useful concept it is very difficult to capture in a consistent way.
Table 12. Overview of different attempts made to capture the concept of over and under estimation before and after training (c = correct/coherent, U = under estimation, o = over estimation).
Subject UFOV/ I am a good driver (Table 5) Before - only baseline (Table 7) Before - baseline and training After - only baseline (Table 9) After - baseline and training 1 u u u u u 2 c u u c o 3 c c c o o 4 c o c c o 5 u u u o u 6 u c u c u 7 u u u o u 8 o o u c o 9 u c u c o 10 u c u no data c 11 u c u u o 12 c c u c u 13 o c u c o 14 u u u o o 15 o o u c u 16 u o c o o 17 u c u o o 18 u c u u u 19 c u u o o 20 o u u o o 21 o c u o u Under 11 7 18 3 8 Correct 5 10 3 8 1 Over 5 4 0 9 12
3.5.1. Progression during training – all three visits
The simulator training lessons were developed so that the difficulty should increase successively. Thus, it was considered interesting to see if the drivers did more errors as driving got more
demanding. The average penalty point for the five lessons included in a training session was calculated for each participant. The result per feedback group is shown in Figure 4. There was a main effect of training session (F[2,38]=35.39,p<.05) but no significant difference between the groups or any interaction effects. Thus, it seems clear that training lessons became increasingly more difficult.
Figure 4. Mean penalty scores per feedback group (11 only negative feedbacks and 10 both positive and negative feedback) and for the three training occasions.
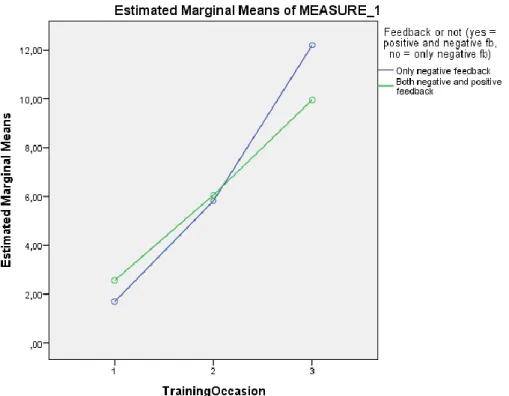
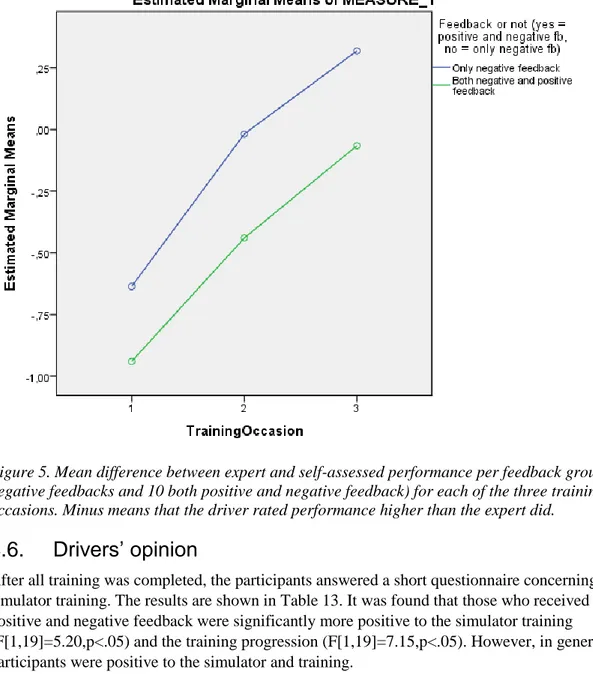
As a next step, we looked at the change in self-assessment of driving performance vs. the expert’s assessment over the three occasions. Thus, mean differences between the driver and the expert were calculated for the five lessons included in each training occasion for each participant. The result for the two feedback groups are shown in Figure 5. There was a main effect of training occasion
(F[2,38]=30.22,p<.05) for the total group of drivers so that the change went roughly from under estimation to over and closer to coherent. However, there was no significant difference between the two feedback groups even if it looks like those who got both positive and negative feedback came closer to being coherent with the expert.
Figure 5. Mean difference between expert and self-assessed performance per feedback group (11 only negative feedbacks and 10 both positive and negative feedback) for each of the three training
occasions. Minus means that the driver rated performance higher than the expert did.
3.6.
Drivers’ opinion
After all training was completed, the participants answered a short questionnaire concerning the simulator training. The results are shown in Table 13. It was found that those who received both positive and negative feedback were significantly more positive to the simulator training
(F[1,19]=5.20,p<.05) and the training progression (F[1,19]=7.15,p<.05). However, in general the participants were positive to the simulator and training.
Table 13. Mean responses to post-test question on simulator training for all and the two experimental groups. 1=very good, 4=very bad, i.e., the lower the better.
Question Total (21) Positive and
negative (10) Negative (11) Sign
1. Simulator experience
(1=very good, 4=very bad) 2.00 1.70 2.27 5% 2. Content of the exercises
(1=very good, 4=very bad) 1.33 1.30 1.36 Ns 3. Training progression
(1=very good, 4=very bad) 1.57 1.30 1.82 5% 4. How did you perform in
total (1=very good, 4=very bad)
1.90 1.80 2.0 Ns
5. Feel after driving (1=very good, 4=very bad) – “simulator sickness”
4.
Discussion
To assess the participants’ attention and parallel attentional processing, the UFOV test was used. It is an extensively researched and promising predictor test in driving outcomes measures and crash risk (risk score). It was initially used to provide some basic and underlying data and the participants performed slightly better than average peers or according to norms, especially regarding subtest two and subtest three. For example, in subtest two, they had a mean score of 92.8 ms and the normative data is said to be 132 ms (Edwards et al., 2006). An attempt was also made to compare the UFOV test results with the participants’ self-assessed estimation of their ability as a driver. The purpose was to identify potential over and under estimators. However, no correlations were found to this question, or the other questions in the pre questionnaire. Thus it was not used to group the participant in the study. Furthermore, feedback was not designed to meet the different needs of the two categories as we did not have a sufficiently reliable way to categorize the participants.
4.1.
The concept of over and under estimation
Several attempts have been made in this study to classify participants as either over, under or correct estimators as described in 3.5. In general, training intervention made the participants on average change their assessment from being on the under estimation side to the over estimator side (see Figure 3). However, most importantly they came closer to being coherent with the expert (i.e. closer to zero). This must be viewed as a positive effect of the intervention. However, this study was different from other studies in the current project so that here we had initially more under estimators based on the baseline drive results. This could be due to the fact that driving in the simulator was a new experience which might have had an effect on their ability to assess their performance. In this case it seems like they under estimated their performance while when assessing something more familiar like “I am a good driver (in a real car)” which was used in other studies might bias more to being over confident because you are supposed to know. Or the different classifications might not be comparable which would rather advocate the idea that the concept of over and underestimation of performance or ability is very situation-specific and difficult to capture even if it seems quite attractive and potentially useful. Thus, there is a lot more work needed. Furthermore, the methods used assess changes in
self-assessment in other studies might have been too rough, which becomes rather obvious in Figure 3. Roughly, there was a change from under to over estimation but they were closer to being coherent after the training which might be obscured when using less fine-grained scales.
4.2.
Training results
Considering the training, results based on a rough classification changes were not very positive (Table 10) as discussed above. However, Table 11 and Figure 3 provides a different picture. The average deviation from the expert assessment decreased significantly after training, from -0.7 to 0.1.
Furthermore, all drivers with a deviation of more than -0.7 made positive change, i.e. came closer to being “correct” in their estimation (Figure 3). Finally, those individuals who deviated the most initially improved substantially. This must be seen a very positive result even though we the phenomena “regression to mean” could have played a role here.
4.2.1. Impact of feedback on training results
It was also hypothesised that providing both positive and negative feedback should be superior to only negative feedback. Figure 5 seems to indicate a better result for the group who got both positive and negative feedback, i.e. closer to zero at the last session. However, there was no significant difference between the groups in terms of improved self-assessment. Thus, we have to abandon the idea of positive effects from positive feedback on ability to self-assess. Does that mean we should disregard the value of positive feedback? Maybe not! Specifically, as we did not tailor the feedback according to the classification (over/under estimation) of participants. It might very well be so that over estimators