School of Innovation, Design and Engineering
Building a dynamic value
stream Mapping- DVSM
Product and process development Production and Logistics
Report code: KPP231
Commissioned by: Mälardalen University Tutor (company): Michael Cederborg Tutor (university): Martin Kurdve Examiner: Sabah Audo
ABSTRACT
Value stream mapping (VSM) is a visualization tool helps to understand processes by using of stream lined work process. The importance of this process is to decrease the activity that does not add value to the final product and in order to increase the efficiency and production.
The purpose of this thesis is to create dynamic value stream maps of a process by using simulation. By creating dynamic value stream maps makes it possible to analyze more complex systems than traditional VSM. Simulation can be used with value stream mapping to give it power and flexibility in order to dynamically change the state of the system.
The spiral welding production line has been working for many years. The company is facing an increase in the demand along with possibilities of later product development so that they could get more efficiency, less costs, higher quality, and a dynamic workforce plan according to the varying demand. This cannot be achieved unless studying the process inside out and finding new areas that have the potential for improvement. In this thesis I have tried to investigating these areas and the focus is on finding solutions for improving them.
This thesis work performs at the production process of spiral welding steel plates for analysis the buffers, calculate cycle, process time and reduce waste by using VSM and DVSM. It has been trying to provide readers with a clear prospective of the company, a precise analysis on the mentioned production line and apparently areas of improvement in the production process.
ACKNOWLEDGEMENTS
This thesis project was carried out in cooperation with Umer Shafique, Master student in Mälardalen Hogskola, at Alvenius AB Eskilstuna, SWEDEN, under the supervision of Martin Kurdve.
I would like to convey my sincere gratitude to my thesis supervisors Martin Kurdve and Michael Cederborg, Technical Manager AB Alvenius Industries, Eskilstuna Sweden for their constant source of inspiration throughout the project. This project would have not been possible without their encouragements and suggestions.
Finally I would like to thank my family members, teachers and staff at Alvenius AB for their support and help.
Eskilstuna, May 2014
ABBREVIATIONS
C/O: Change over time C/T: Cycle time Takt Time: Production time VSM: Value stream Mapping
DVSM: Dynamic Value Stream Mapping Muda: Japanese term for “waste”. VA: Value adding (operations).
NVA: Non Value Adding (operations).
NNVA: Necessary but Non Value Adding (operations).
Table of Contents
1. INTRODUCTION ... 11
1.1. Project Specification ... 11
1.1.1. Project Description and Project Objective ... 11
1.1.2. Project Organization ... 11 1.2. Company Description ... 13 1.2.1. Expected Outcomes ... 13 1.3. Research Questions ... 13 1.4. Delimitations ... 14 2. RESEARCH METHODOLOGY ... 15 2.1. Research Approach ... 15
2.2. Data Collection Method... 16
2.3. Research Design ... 17
2.4. Literature Review ... 17
2.4.1. Purpose ... 17
2.4.2. Writing a Review ... 17
2.5. Interview Preparations ... 17
2.5.1. Preparing the questionnaire ... 18
2.5.2. Interviews and Participants ... 18
3. THEORETICAL FRAMEWORK ... 19
3.1. Lean Manufacturing ... 19
3.1.1. Principles of Lean Production ... 22
3.2. Lean Tools and Methods ... 23
3.2.1. 5S ... 23
3.2.2. Just In Time ... 23
3.3. Value Stream Mapping ... 24
3.3.1. One-Piece Flow ... 24
3.3.3. Value Stream Mapping (VSM) ... 25
3.3.4. Mapping Current State Value Stream ... 27
3.3.5. Categories of Activities in VSM ... 28
3.4. Dynamic Value Stream Mapping (DVSM)... 29
3.4.1. Concept of Simulation ... 30 3.4.2. Components of Extendsim ... 30 3.4.3. Extendsim Library ... 31 3.4.4. Extendsim Inputs/Outputs ... 31 3.5. Application of Extendsim ... 32 4. EMPIRICAL FINDINGS ... 34
4.1. Current State of Process ... 34
4.2. Process Description ... 34
4.2.1. Spiral Welding ... 37
4.2.2. Grinding and Finishing ... 37
4.2.3. Automated Ring Welding ... 37
4.2.4. Hydrostatic Testing ... 38
4.2.5. Packing ... 38
5. ANALYSIS... 40
5.1. OEE Calculation ... 40
5.2. Disturbance Analysis ... 42
5.2.1. Fish-Bone Diagram (ISHIKAWA) ... 42
5.3. Value Stream Mapping Analysis ... 44
5.3.1. Takt Time Calculation ... 44
5.3.2. Analyzing Waste of Alvenius ... 45
5.4. Discussion ... 49
6. SUGGESTED IMPROVEMENTS ... 52
8. REFERENCES ... 57 9. APPENDICES ... 61 9.1. Process symbol ... 61 9.2. Material symbols ... 62 9.3. Information Symbol ... 62 9.4. General Symbols ... 63 9.5. Extendsim model ... 65
9.6. Result of current state model ... 65
9.7. Improved Extendsim model ... 66
List of Figures
Figure 1 Organization Structure ... 12
Figure 2 Data Collection Method ... 16
Figure 3 Research Design ... 17
Figure 4 One-piece flow ... Ошибка! Закладка не определена. Figure 5 SMED system ... 25
Figure 6 Steps of VSM ... 26
Figure 7 Levels of mapping the value stream (Rother& Shook, 2003) ... 27
Figure 8 Comparison between symbols of VSM ... 30
Figure 9 Dragging & Dropping of components from Library ... 31
Figure 10 Model built using Extendsim ... 32
Figure 11 Traditional VSM ... 32
Figure 12 Workshop Value Stream Mapping ... 34
Figure 13 Current Value Stream Mapping ... 35
Figure 15 Automated ring Welding ... 38
Figure 16 HydrostaticTesting ... 38
Figure 17 Packing of steel pipe ... 39
Figure 18 Fish-bone diagram ... 42
Figure 19 VSM with waste ... 45
Figure 20 Current state vs Future state ... 53
Figure 21 Current state Extendsim model ... 65
List of Tables
Table 1 Comparison of three production system ... 20
Table 2 Time study results for two pipes ... 36
Table 3 Working hours ... 37
Table 4 Cost of Robot ... 54
Table 5 Cost implementation- white color workers ... 54
Table 6 Cost implementation- blue color workers ... 54
1. Introduction
The use of waste removal, inside the organization was pioneered by Toyota 1980.The reason for this idea of improved productivity leads to lean operations and exposed wastes.
This project is a part of a comprehensive improvement project conducted through Alvenius Company, a leading manufacturer of steel pipes located in Eskilstuna. Alvenius was founded in Eskilstuna, Sweden 1951. The company started early to deliver steel pipe systems to international mining companies and civil engineering projects around the world. Products of this company is divided in four main categories including : Fire Production, industry, mining and tunneling, snowmaking and each of this categories has different specification according to their usage under or above the ground, the pressure, and of course in size of them.
The aim of the project is to improve one of the production lines which manufacture spiral welding steel pipes. The focus of this thesis is on the system performance improvements and the analysis is based on simulation and Value stream mapping.
1.1. Project Specification
1.1.1. Project Description and Project Objective
If manufacturing companies want to achieve goals like flow of material, better and cheap it is not possible to hold on to old principles and traditions. To provide cheap products at a high quality manufacturing companies need to find out new ways of staying competitive.
The main problem is in the production line, one of shop floor in Alvenius which manufactures pipes from raw steel sheets. Alvenius is making pipes of different length, diameter and
thickness from the raw steel sheets. Process involves different steps: spiral welding, finishing and grinding, automated ring welding, hydrostatic testing and packing.
According to the calculation the bottleneck of the whole process is the automated ring welding. The problem in this production line is how to reduce the buffer size and cycle time in
automated ring welding and hydrostatic testing machine by using lean and value stream mapping tools.
The objective of this thesis is to devise a dynamic value stream mapping of a process by using value stream mapping as a basic concept. By constructing a dynamic value stream mapping makes it feasible to analyze more complex system than traditional VSM. Simulation can be used with value stream mapping to give it more potential and flexibility in order to dynamically change the state of the system.
For static VSM the tool used is Microsoft Visio and for DVSM simulation Extendsim has been used to identify the waste and increase the flow of material. Value stream mapping approach gives a specific plan to use the visualization, and implement lean manufacturing through a number of steps.
1.1.2. Project Organization
almost all personnel available are assigned to shop floor. This made it possible for us to experience a new structure for cooperation rather than the strict functional structure.
The stakeholder of the project could be briefly divided into three main groups; students, our lecturers in university and also the company managers. The steering committee can be indicated as head of logistic department in the Alvenius Company plus our supervisor IDT department of Mälardalen University. The project has been done by cooperation among group members along with external people.
The project has been done with cooperation of Mikael Cederborg, the technical manager and project manager Patrik Andersson of the Alvenius Company they provided us technical explanation of the current situation and the problems aroused.
However, as far as the project progressed, we feel lack of some contacts that can provide us with relevant technical knowledge and guidelines to cope with the problems. So, we had Stig Wikner, production leader and welding supervisor and also Mattias Koivula, production planner in the Alvenius Company.
1.2. Company Description
Alvenius was founded in Eskilstuna, Sweden 1951. The company started early to deliver steel pipe systems to international mining companies and civil engineering projects around the world. Early mining markets were Zambia, Congo, South Africa and the Philippines.
During the second part of the sixties Alvenius entered into the snowmaking market. Pipe systems for water and compressed air were early delivered to many ski resorts in Europe. Major markets are Scandinavia, Eastern Europe, France and Spain.
Alvenius is a subsidiary of Boxholms AB since 1990. Products of this company is divided in four main categories including : Fire Production, Industry, Mining and tunneling, snowmaking and each of this categories has different specification according to their usage under or above the ground, the pressure, and of course in size of them.
The logistic cycle of the product of this product could be described as raw materials (steel bars) produced in Kiruna, Sweden. Then, these parts are transported to Borlänge in which SSAB (Sveriges Stål Aktiebolag) where they are processed and converted to steel coils up to 12 tones. After that, these parts are sent to Tibnor in Göteborg where they are cut into different width. On the next trip, they are transported to Eskilstuna and pipes are made through these coils using special process and spiral welding machine.
BöhlerCompany in Austria and ErasteelKlostere are two main customers for powder capsules manufactured by Alvenius. These companies manipulate these capsules for powder metallurgy industries where parts with special properties are produced that are practically impossible to be produced by any other means.
1.2.1. Expected Outcomes
The desired outcome of this project could be briefly described as following categories which is in fact done by a series of improvements through several points of the production line:
Shortening lead time
Higher efficiency
Higher quality
Dynamic workforce plan
Footprints of the workers
More detail about these goals and the tools and methods to reach them are elaborated in the next parts of this report.
1.3. Research Questions
The research questions are a proposal to specify the aspects to be considered. In order to restrain the capacity of the study and also to avoid over amplification, the research has concentrated primarily to answer the following three research questions.
How to minimize the lead time of the pipe manufacturing.
What kind of lean tools have been used to improve the pipe manufacturing process in the future state model?
Which areas does your company focus on to improve the efficiency and quality of the product?
1.4. Delimitations
In this study, we have tried to understand the (steel pipe welding) production process and find out potential points of improvements. The study defines to one limited production line, which can be characterized a standard flow within the shop floor, and it has five main parts.
The two production lines are functioning parallel to each other in the same shop floor. The production line that is placed parallel to this process is not included in the analysis. This is due to the high buffer in only one production line.
Further constraints are associated with the choice of the methodology. Based on the specified method is established on lean literature, value stream mapping and dynamic value stream mapping techniques.
2. Research Methodology
The chapter describes the research methods and discuss the particular arguments to choose the different research approaches and how the different data collection techniques, analysis, interviews and evaluations help us to find the research conclusions.
2.1. Research Approach
There are different possible approaches we can use for research method. These are qualitative, quantitative and mixed approach. It is very important to choose one of the above approaches to gain the outcome. Brymanand Bell, 2007 suggest that quantitative method uses numerical data to research differnt topics. According to the quantitative research the data must be the measureable units such as length time and number.
Quantitative research are of two types: one is experimental and other is descriptive. Experimental research normally checks how accurate theory is. Different types of experiments are used to determine the validity of the theory. Experiment includes surveys, studies and measures the outputs of the experiment are performed to gain a required result in a specific range.
Descriptive research measures the different aspects of the sample at the spot in a specific time to describe the sample characteristic. Descriptive research is not a statistically refined or hard technique; a proper evaluation of the sample helps the researcher to find out the statistical results in proper context. Researcher thinks that quantitative research is a better approach than qualitative research because of its accurate measurement in a closed environment. Laboratory experiments are performed when internal and external requirement meet the research criteria. Field experiments are performed to measure how it will perform in real conditions.
Qualitative researches focus only on a group and explain the situation of that group. There is only one exception when focus on a group, which is conducted with 3-10 persons and uses a specific format of questions. The moderator asks the different questions and records the response of all the persons in a group. Questions within the group conducted in a specific environment.
Quantitative research is how we prove a theory and perform practical experiment and calculate the results numerically, whereas qualitative research is how we observed the behavior. We can conclude that quantitative research is a deductive and qualitative research is an inductive research.
Mixed research method is a type of research method that combines the use of both quantitative and qualitative research methods. Normally they are the two different research methods with different strengths and weaknesses, but when combined, such a process would help researchers to find out the strengths of one method and the weaknesses of another method. In this thesis we will use the mixed research method, due to the fact that the thesis is mainly about exploring and conceptualizing lean, process improvement theories and static and dynamic value stream mapping to negate existing problem and improve manufacturing process. The next step is how to collect the data for case study.
2.2. Data Collection Method
There are two different types of data collection for analyzing and answering these research questions known as primary and secondary data sources.
Figure 2 Data Collection Method
The source of primary data collection includes observations, questionnaires and interviews, while the secondary source of data collection includes documentation and earlier research. In out thesis we will use primary source to investigate the problem in the process line. The main source of data collection is the observation by calculate the cycle time and waiting time of all the machines. For the questionnaires and interviews Mikael Cederborg and Stig provide information and technical explanation of the current state and the problem aroused in the process line.
2.3. Research Design
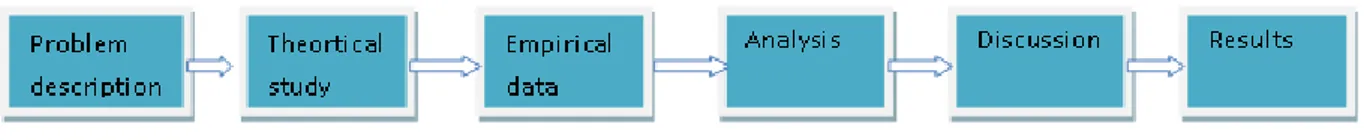
The research design explains the method how the research is conducted. Different stages of research are shown in the figure.
Figure 3 Research Design
The thesis was accomplished under the guidance of the thesis supervisor. Conversation and communication were done through e-mail and meetings. The research method use in the research is shown in the above figure.
2.4. Literature Review
A literature review is an analysis of the research that related to the specific field or topic. According to Cooper, H. M. (1988) defines literature review as “a literature review uses as its
database reports of primary or original scholarship, and does not report new primary scholarship itself. The primary reports used in the literature may be verbal, but in the vast majority of cases reports are written documents. The types of scholarship may be empirical, theoretical, critical/analytic, or methodological in nature”
2.4.1. Purpose
The aim of the literature review is to define a theoretical framework for your research topic, define key terminology and definitions, identify study, model case study, concludes research work to justify the research topic.
2.4.2. Writing a Review
The writing starts with identifying the research questions. The first step should be the searching a relevant literature. Next step is to manage the search results and synthesizing the research results. Finally, write an assessment of the literature.
2.5. Interview Preparations
The questions were designed to be interviewed according to the representative of the company. The list of the question was prepared according to the context VSM e.g. cycle time and maintenance time. The purpose of the questions is to know which machine causing problem in the manufacturing line, and to investigate the process line.
2.5.1. Preparing the questionnaire
The questions were designed in accordance with the objective of the thesis. To make the interview session more understandable, the questions were asked to the specific person working on a specific machine. By using this approach data collected would be more accurate and will help in further calculations.
2.5.2. Interviews and Participants
The interview is the most common method in qualitative research to find out the basic information. Interviews were conducted at Alvenius after a visiting the plant and its main process. Participants were selected from the whole process, in order to get the response of all the workers and professionals working on the shop floor.
List of participants:
Technical Manager: Mikael Cederborg
Project Manager: Patrik Andersson
Production Manager: Stig Wikner
Purchase: Mattias Koivula
Lean Department
In order to get the specific replies interviewers has some flexibility to ask the further questions. Interview and visiting time were depended on the time given by the company and vary to person working in a shop-floor. In order to get the missing information correspondence were done through phone and email.
3. Theoretical Framework
This chapter represents the theoretical framework on the basis of result and analysis. The theory consists of an introduction to the production and its characteristics. It also consists of lean production and Toyota production system to the theory which use the different tools and methods applied in this project, mainly linked to the theory of value stream mapping.
3.1. Lean Manufacturing
Lean manufacturing is the efficient way of eliminating waste from all the aspects of the factory operations, where waste sees as loss of resources and add no value to the product and services. According to Caulkin (2002), most of the time 90 percent of the time wasted to move the item from one workplace to another or by waiting time of the machine.
Lean is a set of different “tool” that is used in finding and elimination of waste. By eliminating waste quality improves while the while cost and production time reduced. Examples of different tools are Value Stream Mapping, Five S, Kanban (pull systems), and poka-yoke (error-proofing) (Kesselli and Semenoff 2009).
The term “Lean” was coined by John Krafcik in an autumn article, “Triumph of the lean production system”, published in Sloan Management Review. In 1990s, lean production was known by the world manufacturing community through the best seller; The Machine That
Changed the World (Womack, Jones, Roos, 1991).After that, the philosophy of TPS has been
worldwide learnt and applied to different organizations. Different enterprise earned more productivity, higher quality, less cost and other competitive advantage from lean production. Lean is the most known term, especially to the people working in manufacturing. Lean manufacturing is the most dominating trends used in manufacturing (along with six sigma) more than ten years (Jeffrey K, 2004).
Womack & Jones 1996, also present five important components to become lean. They propose them as the Five Principles, a summary of lean thinking:
Precisely specify value by specific product
Identify the value stream for each product
Make value flow without interruptions
Let the customer pull value from the producer
Pursueperfection
James Womack, Daniel Jones and Daniel Roos, in their book The Machine That Changed the
World (1990), lean production in the middle of the craft and mass production, saying lean
production includes the advantage of the craft and mass production, while avoiding the high cost. The table shows the difference between craft production, mass production, and lean production in different aspects.
Production system/items Craft production Mass production Lean production
Product characteristics High customization,
lowvolume
Standardization limited,
variety , high volume
High variety
Processing equipment Generic, cheap, flexibility Specific, efficient,
expensive
Flexible and efficient
Work force High skilled Narrowed skilled Various skill
Work division and content Blurred operation boundary,
diverse
Clear operation boundary,
diverse
Less blurred operation,
boundary
Inventory level High High Low
Manufacturing cost High Low Lower
Product quality Low High Higher
Responsibility Decentralized Centralized Decentralized
Table 1 Comparison of three production system
New ideas only emerge in a condition when old ideas no longer work (Womack, Jones, &Roos, 2007). Mass production was started for more average consumers – opposite to the rich ones, who want to have their own car at a reasonable price, for which craft production could meet the goals and revealed to different drawbacks, such as higher cost, low quality and low productivity. These were all the reasons which gave birth to the lean production, which was initiated by Toyota as a Toyota production system. Because the circumstances were different from the US, mass production was predicted not satisfactory at Eiji Toyoda and TaiichiOhno. If the goal of the mass production is to satisfy the vast need of the market demand by improving production through the application of different parts and specific work techniques, the goal of the lean production is to quickly fulfill the limited but the diverse need of the quality demanding customers in the most effective and economical manner by reducing the inventory cost, manufacturing space, waiting time and human effort (Singh & Sharma, 2009). Seven Lean Wastes
Wastes are of many kinds, such as parts, inventory, equipment; human effort etc. waste can exist in any part of the production (Nicholas, 1998). The main thinking of lean is to remove any form of waste from the processes at any time. There are seven different forms of waste that identified by the Toyota production system (TPS).
Overproduction
Overproduction is the product that is more than the customer need and that is not ordered by the customer. Overproduction leads company to the extra inventory such as greater lead and storage time. Overproduction also leads to the excessive work in progress, which cause the physical problem of the worker that affects the communication. Toyota introduced a pull system or Kanban system to minimize this problem.
Unnecessary Transport
The unnecessary transport means to move goods. Any unnecessary movement also considered as a waste so minimize the transportation within the production shop. Also double handling and excessive movement cause accident and damage in a production shop which takes some extra time to correct the damage also known as corrective maintenance.
Unnecessary processing
Inappropriate processing occurs when complex solutions are used to fix the simple problems. Over complex machine motivate the worker to overproduce goods. Such a behavior results the excessive transport and lack of communication. The ideal condition should be to have a small machine which is capable of producing the desired quantity of goods to meet the demand of the respective company. Inappropriate process also occurs when an employee used a machine without proper safety which also leads to a poor quality of the product.
Unnecessary Inventories:
Excess inventory cause longer lead times, damaged goods, delay, also increase transportation and storage cost.
Unnecessary movement
Unnecessary movements are when operator stretch, bend, walking, and looking for tools these actions could be avoided while working. These movements cause poor productivity and also lead to the quality problems.
Waiting:
When time is not used effectively waiting time occur in the form of machine and a worker. Waiting time in a factory mostly occurs when goods are not moving in process lines. This waiting time will affect both the machine and a worker. The ideal scenario is that there should be no waiting time of the machine and constant flow of goods. Waiting time of the machine should be used for repairing and cleaning the production shop.
Defect
The main waste is the defect that affects the cost of the product. According to the Toyota philosophy defects should be considered the opportunities to improve the product. It also identifies poor quality of products which causes extra costs for repairing and replacing the defective parts.
3.1.1. Principles of Lean Production
Five principles identify as the foundation of the lean production. (Womack & Jones 1996). These principles can be concluded as the following:
1. Identifies value from the customer‟s point of view. It is important to know what the customer‟s are and what kind of products customers want to buy. The customer only buys the end product not the type of machining used by the manufacturer. If a customer wants to buy a specific length of pipe with a special purpose. A customer is not interested in what king of machining used to manufacture that pipe. The customer will only see if the pipes meet the required criteria. So this is the value from the customer point of view.
2. Identify the value stream of the process. It is necessary to realize the sequence of the process from the raw material to the final customer. As explained in the first principle, value is anything that is customer willing to pay for a desired product and a service. So the value stream mapping (VSM) is developed in order to map the process or analyze the process for defining the value added and non value added activities.
3. Flow, value stream should be developed in such a sequence that the product flow towards the customer without any non-value adding activities. Once piece flow is also used to make the value flow.
4. Fourth principle is the use of a pull system. Value is pulled by the customer from the next activity as the flow is introduced into the system.
5. Final principle is the perfection also referring as the perfect value. As value is developed, value streams are used to remove the non-value added, smooth flow and a pull system are introduced, begin the process again until it achieves the state of the perfection in which the perfect value is created without any waste.
3.2. Lean Tools and Methods
Lean has a wide variety of tools which are used in developing and helping to increase the efficient production system. In this section different tools and methods are used to identify the waste and improve the manufacturing process in the case company.
3.2.1. 5S
5s is known as a system to reduce waste and optimize production through workplace within the organization by using specific standards in a systematic way. The aim of 5s is to improve safety, improve processes, create efficient clean and well organized working environment. 5s always aim to improve workplace and operator safety, quality and communication among staff. 5S can be described in (Liker, 2004) as;
Sort (Seiri) – The first step is to organize the work area with a focus on removing and eliminating the unnecessary tool from the workplace. When “sorting” is well managed, it improves the communication between workers and also improves productivity.
Set in Order (Selton) – The second step is the efficient and effective arrangement of the necessary tool. So it can be accessed by everyone and reduce searching time for the tools. Shine (Seiso) – The third step is focusing on cleaning workplace and equipment. This result a safe workplace and identify the problem quickly. The importance of shining is “mess prevention”.
Standardize (Seiketsu) – The fourth step focuses on creating a standardize approach for carry out different tasks at the workplace which maintained through visual controls.
Sustain (Shitsuke) – The final step is focusing on maintaining a discipline on all the stages of work. Without “sustaining” workplace can easily convert back to being dirty, that is why it is very important to the team to improve and maintain their workplace.
Implementation of 5s helps in reduce inventory, increase discipline, reduction time for tool searching and effective utilization of the workplace. 5s also helps in production related problems such as improving the machine condition and reduces risk of accidents.
5s can be adapted effectively in the machines which require manual processing more frequent. In the Alvenius the 5s can practice in three different processes; the spiral welding, grinding and in manual maintenance (welding). These three processes require tool to work on a machine. Therefore, 5s is the vital lean tool to adequately work on these workstations.
3.2.2. Just In Time
Just in time is a term which mostly used in lean manufacturing system implies a process is capable of tackle the demand without any overstock, whether in term of extra demand or any inefficiency in the process (Hutchins, 1999). The main goal of just in time is to achieve zero inventory, not in a single organization but within in the whole supply chain. To achieve a success it is very important to think beyond the scope of stock and think about all the aspects of management control. Consider the problem of raw material stocks. The problem may be from
because each of them has unique services. Supplier also have different problem e.g. one supplier may be providing the bad quality and the other supplier is not able to hold tolerance and so on. These problems will further lead to the undesired-able aspects.
Raw material problem may also have internal reasons such as machine breakdown, wrong forecasting, quality related problem in working product, and lots of other causes which are not control by the material control department and will require necessary calibration in the different process before any further improvements. It is evident that just in time is not very easy achievement. Highly competent manager of different organization also think that because stock control is very obvious to minimize the working capital, there would be less opportunity for the improvements.
3.3. Value Stream Mapping
Value stream mapping is a lean tool which is used in lean manufacturing to find the flow of information and material, as a product it makes way through value stream. VSM is a method which is used to draw “single picture” of all the process in a company, starting from the time when a customer placed an order until delivery of the order to the customer. The main aim of value stream map is to reduce or eliminate non-value added work, in order to achieve the lean manufacturing.
Womack and Jones (1996) define the value stream map as follows: raw materials along with knowledge and information enter the system upstream (the suppliers); and, products or services of value flow out from the system downstream (the customers). The value stream map according to Toyota is a tool that:
Allow you to draw the current state map.
Identify the bottleneck of the whole process that is taking the extra time for processing or buffer that prevent you from making what your customers want and also made it in time.
Develop a value stream mapping of the future lean manufacturing system. 3.3.1. One-Piece Flow
One-piece flow is one of the most important principles of the lean manufacturing. One-piece flow or continuous flow is an idea in which single unit is processed and move from one unit to another at a time (EMS Consulting Group, Inc. 2009). There are different terms which are used to describe the one-piece flow. The most common are as follows.
One Piece flow
Single Piece Flow
Continuous Flow
Make One - Move One
Flow Manufacturing
One-piece flow is a tool that help the manufacturer to achieve the just in time manufacturing, That is, the right parts can be made in the right quantity at the right time. The benefits of one-piece flow are: Improve safety, build in quality, improves flexibility, improve stability, reduce inventory, improves productivity and free up floor space.
3.3.2. SMED
SMED (Single Minute Exchange Die) is a lean tool which is used to decrease changeover and setup time that reduces machine downtime (Vorne Industries Inc., 2010). It is commonly used to reduce changeover time from hours to minutes. SMED convert as many steps as possible to external (perform while machine is running) and streamline the remaining steps (e.g. manual adjustments). The SMED has three main phases as shown in fig below.
This lean tool can be primarily used in the spiral welding machine in the Alvenius. In Alvenius spiral welding machine are producing pipes of different thickness and lengths, so it can help to reduce the changeover time of the machine. The two different processes spiral welding and grinding can use this lean approach to slash the changeover time.
3.3.3. Value Stream Mapping (VSM)
VSM is the process of mapping the flow of material and information as they prepare a future state map with better methods and desired performance. It helps to visualize the cycle time, inventory, and manpower and information flow throughout the supply chain. VSM gives a company to see a clear picture in both its current state and desired future state, which develop a road map to see a gap between current and future state.
“Value stream mapping is the simple process of directly observing the flows of information and
materials as they now occur, summarizing them visually, and then envisioning a future state with much better performance” (Jones & Womack, 2003).
Value stream mapping is a lean tool which is used to see the complete picture of the whole processes that includes production and information flow, find opportunities to sort out the different wastes exists in a process.
Toyota using the value stream mapping is known as “material and information flow mapping”.
future state and “ideal” state in a process of developing an implementation method to install a lean system.
According to the value perspective means working on a big picture and improve the whole shop floor material and information flow, not just improve the one process or part (Rother& Shook, Learning to see - value-stream mapping to create value and eliminate muda, 2003).
Value Stream Mapping (VSM) helps to understand the information‟s and material flow as a product. A value stream not only the activity of producing product, but also information systems and management that support the basic process. It especially helpful to reduce cycle time, because insight into the decision making flow in addition to the process flow.
The main objective of value stream mapping is to identify a waste and design a future state of the process. The value stream mapping consists of both current and future value stream mapping. Both of the states should comprise of visualization exercises. When future state map is achieved, the future state map becomes the current state and a new future state can be achieved through the continuous improvement process. The flowchart below shows the different steps involve in the value-stream mapping.
Selecting Product
The first step is important to identify the product family by number of activities and resources need in production process. The product family contains all activities that the company required to change by VSM.
Current state
After completing first step to identify the product family current state map drawn representing activities. It also included cycle time of all activities with their product cycle time which will be sum of all time for the production of product.
Future state
Future state represents the new design value stream after removing extra waiting time and waste.
Implementation
The final step plays an important role to implement the recommended changes. As VSM is use to visualise the process flow, work plan should contain all recommended improvements to help company to get future state and implementation progresses.
1. Identifying the product target.
2. Draw current state value stream map of shop floor, which shows the current steps, information flow. It may be a production flow or a design flow. Standard symbol needed to represent it.
3. Assess current state of VSM in the form of map by elimination of waste. 4. Draw a future state value stream map
5. Draw future state.
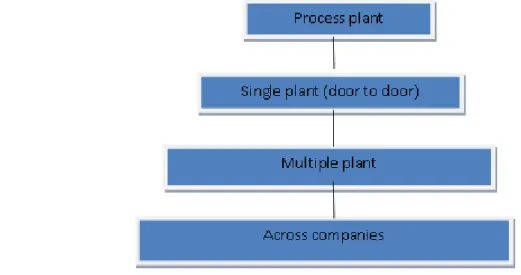
3.3.4. Mapping Current State Value Stream
The visualization is mainly how to collect data for and current state, and a second step is how to draw a current state map. Current state is mainly divided in to four levels.
Value stream mapping starts from the level of door to door flow. When the overall flow of the shop floor is sketched, the level of magnification widely affects the whole shop floor.
According to the (Rother& Shook) there are a few tips for mapping value stream mapping.
Always collect the data for value stream mapping of material and information flow while personally visiting the shop floor.
Start a walk along the entire door to door value stream.
Start measuring the data from the shipping to final product dispatching.
Always measure the data by a stopwatch and do not rely on information which is provided by the operators.
Map the whole shop floor personally.
Always start drawing by hand.
Following are the process data that observed and records during visiting the shop floor.
C/T (cycle time) – time that takes place to process the one part until the next part coming off in seconds.
C/O (changeover time) – time to switch from manufacturing one product to another.
Uptime – on demand machine uptime
Number of operators
Number of product types
Pack size
Available working time per shift at that process (excluding breaks)
Scrap rate
Inventory
3.3.5. Categories of Activities in VSM
According to (Rother & Shook, 2003), value stream map can be divided into three different categories. The three categories are
Non-value adding
Necessary but non-value adding
Valueadding
Value-adding activity is defined as the „process on the shop floor ‟. This type of operations adds value to the product. The process involves different operations such as: converting of raw material, sub assembly, and painting of the part. Value adding activities refer to certain activities, which hampers the potential outcome of the production process as expected by the customers. These activities include raw materials, the assembly components, or any other essentials materials, services and product information (Harrington, 1991).
b) Non-valueadding (NVA):
Any activity that adds no value to the product and increase the cost of the product can be removed from the process is called non-value adding activity. Non-value adding activities are the pure waste should be eliminated from the process. The examples of non-value adding activities are waiting time of machine and operator, excessive handling and unnecessary inventory. Non-value added activities refer to certain activities, which do not provide any potential harm to the product, service functionality and the business (Harrington, 1991).
Necessary but non-value adding (NNVA):
Any activity which is not creating any value to the product but still it is not possible to avoid these activities is called necessary but non-value adding activities. The examples of necessary but non-value adding is the movement of an operator in shop floor to pick up the tool, pick up the different parts and unnecessary handling of different tools.
3.4. Dynamic Value Stream Mapping (DVSM)
Value stream mapping is a simple tool which creates the current state of system after analyzing the product, process and flow of information. Simulation using Extendsim combined with value stream mapping helps the system a flexibility to dynamically define the state of the system. Component-based simulation model divided into a number of small simulation models which convert it into a simulation blocks. The dynamic value stream mapping enhances the features of traditional value stream mapping by using simulation tool and making it more better analysis tool.
The Extendsim has its own library that is similar to the traditional value stream mapping. The Extendsim blocks can be used to make the value stream maps because the icons look similar to the traditional VSM. If we compare the Extendsim to traditional value stream mapping, this tool provides the more precise results of the different scenario which will further help the organization to think in a new directions. The input of the Extendsim is a fix or a random that define the value stream map variables. Extendsim is a tool which will help successfully implementing the lean manufacturing. Value stream mapping by using simulation tool looks a better approach to improve the process according to the lean concept. By combining the lean thinking with simulation a company can find out how the resources should be used within the process management.
By the use of Simulation Company manger can see results of the lean concepts before and after the process. Value stream mapping with simulation gives the analysis of the different criteria to see the improvement areas within the process. This will help to increase the adoption of the lean manufacturing, as it will show the dynamic demonstration of the process management and how it would work in the future. The main aim of using this tool is that because it analyzes the process by using simulation tools, so the organizations can implement better lean process.
Component based modeling is used because it helps to make different changes in the model. Component based modeling helps to find the components used to build a model. Every component modeled individually which is the combination of different building blocks.
The components are building block and they receive the information from different events that perform the function. The building blocks execute different functions with the information that describe the state of the building block (Mohamed A. Shararah 2011).
3.4.1. Concept of Simulation
The concept of the value stream mapping simulation is creating a tool that can be used again for modeling the different components. Component based modeling system is the modeling process in which input and output of the component can be changed with the help of databases. The components connected to another component. The input and output data can be changed remotely with a database which created for this purpose.
The value stream mapping simulation has been created using the Extendsim simulation environment. Extendsim is a complex tool but yet very easy to use. The main type of components that are modeled by using value stream simulation processes are:
Process
RM/WIP/FG Inventory
Push and Pull production system
Customer and Supplier
Customer trucks and Supplier trucks
FIFO lanes
3.4.2. Components of Extendsim
Tool building is required to change the tool formulation, which can read by the computer language. This is a functional component form making the value stream mapping simulation library of blocks construction using Extendsim item block, value block to design the shape of block that same symbol used in the traditional value stream mapping. It can be seen that the traditional VSM and value stream mapping for simulation icons match with each other. A difference between the components is shown in the figure below.
3.4.3. Extendsim Library
The components of the simulation are stored in a simulation library. The components of the library are easy to access and created in such a way that combines with the function of the tool. The use of Extendsim software is very easy it only require picking an item from the library and dropping it in the simulation environment. The example of the dragging and dropping is shown below.
3.4.4. Extendsim Inputs/Outputs
The Extendsim uses a different variable to run a simulation model. Fixed variable are variables which remains the same throughout the whole simulation time, which includes input/output, batch size and no of operators etc. Other variable change its values while simulation is running, that is cycle time and changeover time.
To run simulation model number of inputs are required, that is the cycle time, changeover time mean time to repair, size of the lot, items per lot etc
Simulation performance is more if we compare it to the traditional value stream mapping. Simulation can predict at any time the future state of the process that helps the manger to see if the future state is worth to implement. The performance is the output of the simulation which generate by running the simulation model. The result of the simulation can be collected either directly or in an excel file. Output can be divided into different categories such as process and system output.
The output of the simulation can be the different according to the provided input. It can be the value added time, lead time of the process, goods inventory and also the different defects in the process.
Animation is the key factor in the validation process for models of the different system. It is used in the tool to give the user an understanding how the system will work. The verification of the system can be checked at any point of the model building process. The component models and sometime the part of the component model can be verified. The verification of the model can be checked by measuring the different input value and also check if the output of the model is rational. The value blocks in the Extendsim are used to verify the output of every block in the component to ensure that the each block is working in a specific manner.
To validate the Extendsim model, the simulation of that model is needed to be created. The Extendsim model can be validated by using different method and approaches. The current-state of the map can be created by using the different components in the tool, experts suggestion can be taken to validate the simulation model, such as inventory and lead time. To enhance the validity of the tool, the model response is checked under different conditions or to increase the no of process in the system and then measure how it will react the lead time and throughput of the system.
3.5. Application of Extendsim
The simulation model is considerably different from the traditionally value stream mapping. The difference can also be seen in below pictures. The simulation model can be read by anyone who knows about the traditional value stream mapping tool. The simulation model can also have an animation feature that helps the user to check the state of the system. The model animation will be visible only when the system is running or during changeover. Input of the model put in the input database in the specific area. If a system is running correctly according to the desire conditions, it will measure the output of the process in the output database. Every component of the Extendsim can read data from the database and also generates the result to the database.
Figure 9 Model built using Extendsim (Mohamed A. Shararah 2011)
By using a simulation block to model the value stream mapping icons create great flexibility to the simulation model. Simulation added another feature to the traditional value stream mapping which is time that helps in the modeling simulation model. The Manager can make good decisions, because now it is easy to find how the future state of system will work. Different investigation can be used to change the cycle time and setup time and check how it will affect the system. Buffer and batch size can also be changed to see the overall effect to the system. The Extendsim is a user friendly tool which that requires different steps to create a model. These steps are given below (Mohamed A. Shararah 2011).
Draw the traditional VSM.
Gather the required information for the Extendsim.
Open the already simulation model using ExtendSim simulation environment
Drag & Drop the blocks from the simulation library and join them according to the VSM previously drawn in the Visio.
4. Empirical Findings
4.1. Current State of ProcessThis part of the report presents the current state of the studied part of production. It has been tried to show a clear picture of the current situation and potential improvement points in this section.
The spiral welding production line process is a 6-step procedure in which 4 types of different machines are involved, including welding, grinding and finishing, automated ring welding and hydrostatic testing.
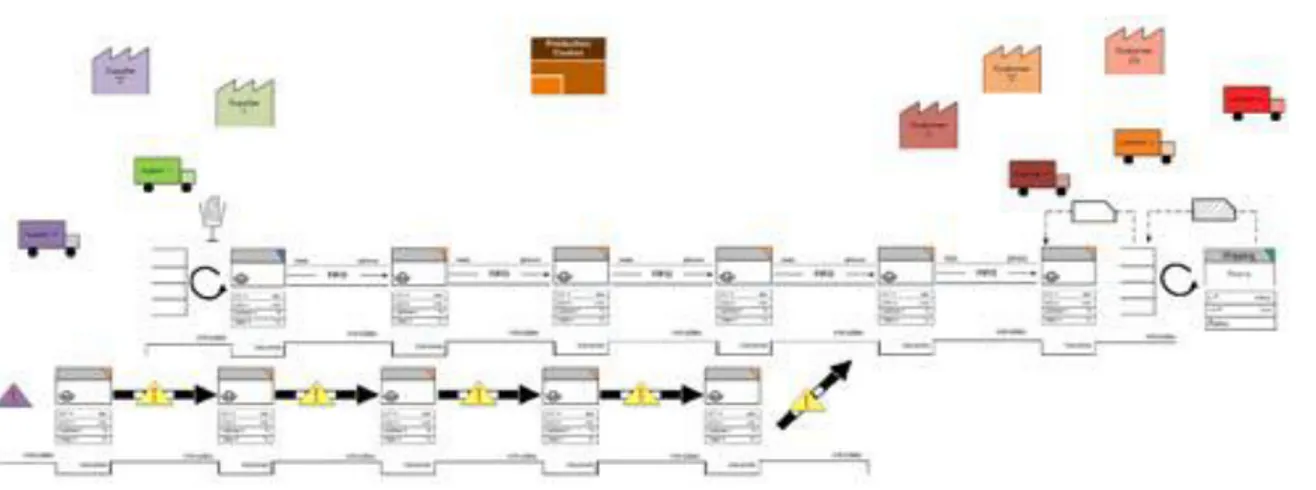
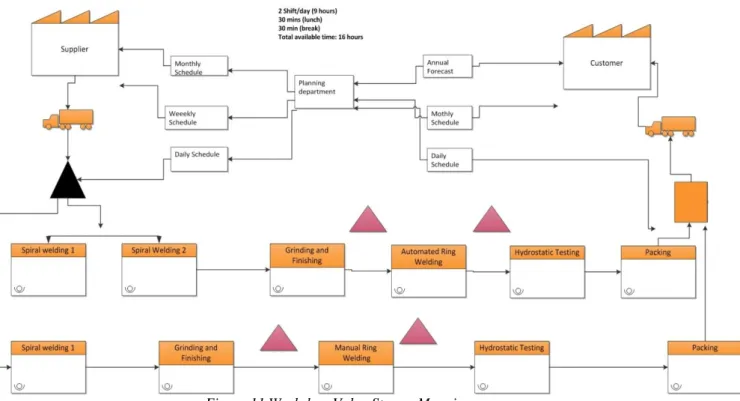
4.2. Process Description
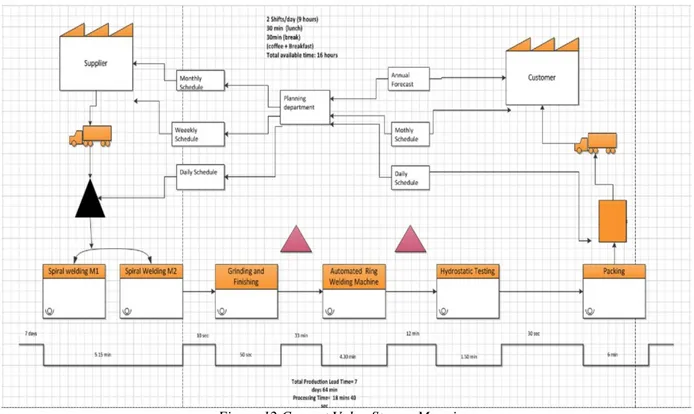
The process we are looking at is called “spiral welding production line” where raw material is welded into different lengths and after a few processes they are converted into a pipes that are the final product of this line. The vale stream of the process at the time being resembles figure. However the figure shown below is the mapping of the whole shop floor.
Figure 12 Current Value Stream Mapping
The process of manufacturing the steel pipes out of the raw materials at the first sight seems to be a very simple process. However, when it comes to studying and improving this process regarding the cycle times and bottlenecks, it reacts with no order and similarities to normal so called continuous process. Therefore it requires a precise study of each step in the process to have a clear picture of the current situation and being able to make any possible improvements. The mentioned process is not a set of repetitive steps after each other. Therefore, every part has both identical and unique time measures for itself. A thorough study has been done on this process for producing a no of pallets and the tale show the results. Here, I present the related times for only two parts. However the time for the other parts is the same with little fluctuation. The times mentioned below in the table are calculated by using two approaches. One is by interviewing the operator working on the specific machine and the second one is by calculating all the times by using a stopwatch. However, the times mentioned in the table are calculated by using the stopwatch.
Spiral welding Grinding Automated ring welding Hydrostatic Testing packing part 1
setup time 1 min 10 sec 1.25 min 30 sec 20 sec
C/O 20 sec 15 sec 1.30 min 20 sec 0
C/T 5.15 min 50 sec 4.30 min 1.50 min 6 min waiting 30 sec 10 sec 33 min 12 min 0
Table 2 Time study results for two pipes
Presumptions and buffers
The process of manufacturing steel pipes from the plates of steel comprise of different kind of machines. The two machines, automated ring and the hydrostatic testing have the major buffer sizes. Automated ring welding includes buffer of 25 pipes while on the hydrostatic testing machine has the buffer size of eight pipes.
The dynamic value stream mapping model needed some assumptions to draw a model. The first assumption in the model was to introduce a roller between the grinding and the automated ring welding to build a model. Second assumption was to consider the two steps of the ring welding machine as a single unit.
Employees and Working Hours
Alvenius Company has 32 employees at the present. 10 of these workers are hired from some other companies. 13 people are working in the office whereas the rest are dealing with the technical issues in the factory.
Under normal conditions, the working hours of workers in Alvenius Company during the weekdays (Monday – Friday) start from 7 in the morning and finish at 15.48. There are three breaks during the working period. A table including the working hours and breaks between is shown in table.
In the case of high demand, regular conditions of working hours can be changed. Usually working on two shifts is the suggested solution. The first shift begins from 5:00 a.m. and lasts until 02:00 p.m. and the second shift takes from 01:48 p.m. up to 10:48 p.m. There is one break in both shifts. However, all of our calculations are made under normal conditions. There are four workers working on the shop floor. Two workers handling the two spiral welding machines, one is doing a manual grinding if required and the fourth one is working on an automated ring welding and hydrostatic process.
Working hours in Alvernius company under normal conditions
TIME Mon Tue wed Thu Fri
7:00-7:30
7:30-9:00
9:00-9:18 Breakfast Breakfast Breakfast Breakfast Breakfast
9:18-10:15
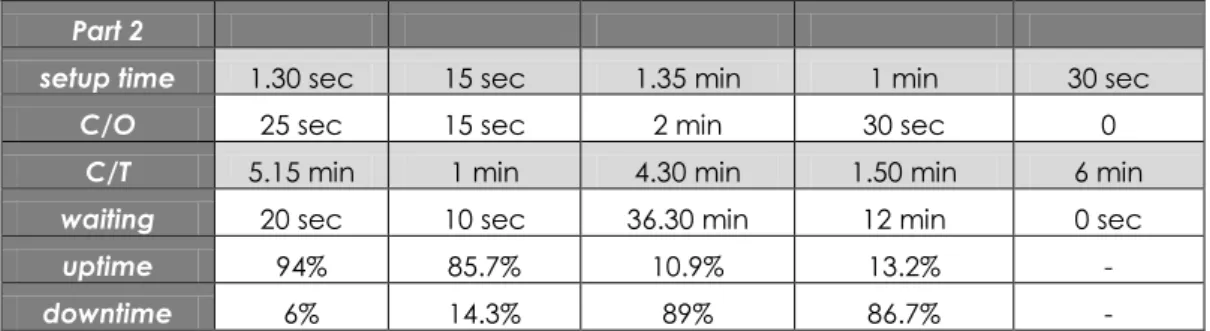
Part 2
setup time 1.30 sec 15 sec 1.35 min 1 min 30 sec
C/O 25 sec 15 sec 2 min 30 sec 0
C/T 5.15 min 1 min 4.30 min 1.50 min 6 min waiting 20 sec 10 sec 36.30 min 12 min 0 sec
uptime 94% 85.7% 10.9% 13.2% -
10:15-11:45
11:45-12:15 Lunch Lunch Lunch Lunch Lunch
12:15-12:45
12:45-14:00
14:00-14:12 Break Break Break Break Break
14:12-15:00
15:00-15:48
Table 3 Working hours
Material Input
The material input contains the large sheet plates of steel with variable thickness in the form of rolls. The material of the steel differs from pipe to pipe and also varies where pipes will be utilized.
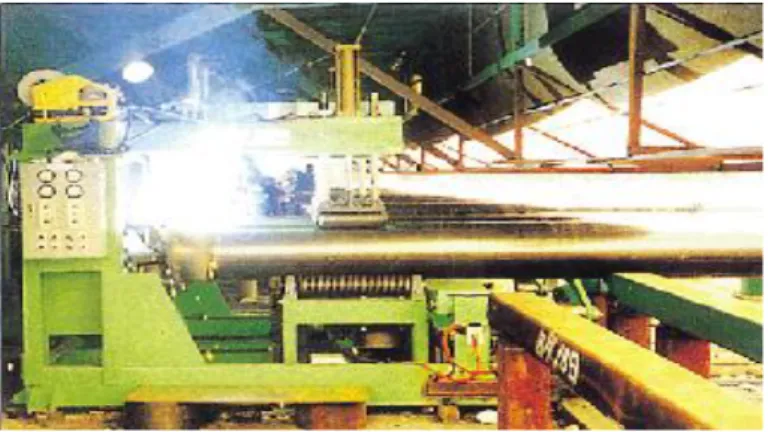
4.2.1. Spiral Welding
The spiral welding of steel pipe process is applied on automatic (CNC) lath machine .Sheets roll is loaded on the spiral pipe machine. The strip is formed in the shape of a cylindrical hollow pipe. When raw material transform into the cylindrical shape arc welding is performed. After the specific length the pipe cuts by SAW machine mounted above the pipe.
Flux from inside and outside of the pipe is also cleaned with the rotation of pipe during welding. For furthermore pipes have to be inspected for defects.
4.2.2. Grinding and Finishing
After the welding process it‟s time to produce the smooth finish. For this purpose abrasive machining process is used to level the edges of the pipe. This process will later help to place the ring on the pipe edges.
This is the most common method of grinding. It uses a rotating abrasive wheel to smooth the surface of metallic and non metallic to ensure a refined look. The grinder consists of abrasive wheel, a chuck and a rotary table. The chuck is a grip which holds the material in a specific spot while it is leveling the pipe.
4.2.3. Automated Ring Welding
Automated ring welding is the process to weld the ring on the both sides of steel pipe. The machine holds up one end of the pipe while welding the ring on the other end. After welding the ring to one side machine rotates the pipe and welds the ring on the other side of the pipe.
Figure 13 Automated ring Welding
4.2.4. Hydrostatic Testing
The hydrostatic testing is performed by filling the water in the pipes and boosts the
atmospheric pressure to test for leakage and structural stability of the pipes. In Alvenius pipes are filled with water with the help of large motor in order to test any leakage in the pipe. If any leakage observed in the pipe it will forward to the maintenance unit and if no leakage noticed in the pipe it will dispatch to the final packing.
Hydrostatic test also includes tanks and pipelines filled with water to test for leaks without raising pressure to above atmospheric pressure.
Figure 14 HydrostaticTesting
4.2.5. Packing
The Final stage of steel pipe production is packing. Packing is a process to collect a number of pipes in a certain order for storage or deliver to customers.
Figure 15 Packing of steel pipe
Products
Quick connection steel pipe systems include pipes, pipe fittings and couplings. The pipes are spirally welded from certified pressure vessel carbon steel. This makes it possible to keep the wall thickness of the pipe down without having to decrease pressure.
Regular X-ray control takes place and all pipes undergo visual inspection as well as hydrostatic test at 1, 5 times their classified working pressure.
The product line which we are working on produces pipes which are categorized in miscellanies part of product classification of the company. These pipes are made out of the steel plates as raw material.
5. Analysis
5.1. OEE Calculation
The OEE is the great tool to analyze and improves the manufacturing process. The OEE tool provides better understating to analyze your processes for improving the productivity. It helps
to measure all the time which are value adding and the non-value adding in the production line. Therefore, it requires a comprehensive study on three steps of the OEE calculation to get a
clear idea of the availability, performance and quality to be able to focus on any possible improvement.
The processes mentioned above are not simply a set of repetitive steps. Therefore, each part has unique process timing. A detail study has been done on these processes for manufacturing a one palette to have a clear picture of the current state process.
When we analyzed the time which worker spent on the machine in each process we found that three work stations were the bottleneck of the whole process. The main bottleneck of the whole process which was critical is the automated ring welding buffer. The other two bottlenecks include processing time of automated ring welding and the waiting time of the hydrostatic testing machine.
The following definition explains some of the expressions used in the OEE calculations.
Planned Stops: Time spent on meetings, breaks, holidays and shifts. This information was provided by Alvenius.
Operative Time: Time spent on the shop floor after deducting for working.
Cleaning and Maintenance: Time spent performing general cleaning, machine maintenance. Preventive maintenance is performed daily to check oil of machine and corrective maintenance is performed every Friday. Cleaning is performed on a weekly basis with duration of approximately one hour.
Change Over: Time spent performing changeover of part on a specified machine. The time was obtained by measuring with stopwatch that performed during the operations.
Packing: Time spent performing packing operations. This time is dependent on the length of pipe.
OEE includes three main factors Availability, performance and quality. However, calculating these factors is very simply, it very important to know that industrial definition of OEE does not exist. OEE calculates how accurate time is used to produce a quality product.
1. Scheduled Time = 24 hours = 1448 minutes (24*60) 2. Planned Downtime = 3 Breaks (Coffee + Lunch) = 3 hours (3 * 60)
3. Net Available Time (NAT) = 1448 – 180 = 1268 minutes 4. Unplanned Downtime = 108 minutes / day
5. Net Operative Time (NOT) = Net Available time – unplanned Downtime = 1260 – 108
= 1160 minutes 6. Ideal Operating Time (IOT) = NOT – Scrap time
= 1160 – 95 = 1065
7. Lost Operating time (LOT) = Scrap parts * Processing time = 5 * 19
= 95 minutes
Availability = NOT / NAT = (1160/1268) * 100 = 91.48 % Performance = IOT / NOT = (1065/1160) * 100 = 91.81% Quality = IOT – LOT/ IOT = (1065- 95)/ 1065 = 91% OEE = A* P*Q
= 91.28* 91.81* 91 = 76.42 %
We can also calculate an OEE calculation by using another formula as shown below OEE = (IOT – LOT) / NAT
= (1065 – 95) / 1268 = 76. 49 %
According to the available data in Alvenius Company, the following calculations related to efficiency can be extracted.
5.2. Disturbance Analysis
The information regarding disturbance analysis was gathered from Alvenius and some data about production from the past record. Together with information we acquired from visiting the factory plant several times and inspection such as environment and human factors. We also had an interview with the workers in the line and ask for them in order to determine more about the problems.
5.2.1. Fish-Bone Diagram (ISHIKAWA)
Fish-bone diagram is a systematic way of finding the cause and the reason that make or lead to those effects and shows the possible reason from the machine errors, operator‟s disturbances and ergonomics could be the possibilities in the production line.
Human Environment
Material Equipment
FLOW PROBLEMS Lack of Air flow
within the factory Noise from Machines
Break downs
Lack of Motivation
Lack of routines Bad quality of
raw material Lack of maintenance record
Distance between Machines Overstock or Lack of Inventory Lubrication of the Machine
Figure 16 Fish-bone diagram
The main problem in the production line has been identified as flow problem, which also lead that the current flow is causing non-value adding work and waste. The main reasons of the flow problem that have been found are shown on the fishbone diagram, it can be divided into four categories; Material, equipment, human and environment.
Equipment
Equipment is the main reason that causes problems to the production line because it directly effects to production capacity and sometimes production has to be stopped for a couple of hours in order to find out the problem and fix the machine. In Alvenius sometime they have problems with the spiral welding machine which sometimes takes a day or two to fix the machine. The other thing which effect the production is the lack of maintenance record since if there is no past data on maintenance, it will be difficult for us to identify what kind of maintenance have been performed in the past or it would be hard to forecast the production capacity in the future. In Alvenius they have started to gather the maintenance record to forecast the production. The last thing that related to the equipment is the breakdown of the