Mälardalen University Press Licentiate Theses No. 140
TOWARDS DYNAMIC PERFORMANCE MEASUREMENT SYSTEMS
A FRAMEWORK FOR MANUFACTURING ORGANISATIONSMohammed Salloum 2011
Copyright © Mohammed Salloum, 2011 ISBN 978-91-7485-022-2
ISSN 1651-9256
Abstract
Consensus prevails that performance measurement systems should reflect the strategic direction and business environment of a company. However, strategies and business environments are dynamic in nature while existing performance measurement systems are stable and predictable. This has created problems for companies as the strategic direction and business environment alters. Even though the literature surrounding the field is vast and dense there is a gap regarding how to keep performance measurement system up to date and dynamic.
With the existing problem in mind, the objective of this research is to develop a framework that will support the realisation of dynamic performance measurement systems in manufacturing organisations.
The research in this thesis has adopted a systems approach and is built around four case studies and two literature studies. The case studies have been conducted at manufacturing organisations on three different continents. The first literature study focused on the general literature in the field whilst the second literature study focused on the characteristics of dynamic performance measurement system in particular.
The end-result of this research is a framework based on 19 factors systemised under five sub-headings: review process, IT systems, management, employees and culture. In excess of the 19 factors, an additional two factors focalising on the realisation of the framework in practice finalises the end-result.
As the research is derived from an industrial problem, this thesis provides an insight for academics of the contemporary struggles of manufacturing organisations with their performance measurement systems. Moreover, this framework provides practitioners with a foundation for making their performance measurement systems compatible and suitable for ever-changing content.
Acknowledgements
Firstly, I would like to show my gratitude towards my supervisors, Associate Professor Magnus Wiktorsson, Dr Marcus Bengtsson and Professor Christer Johansson. The time, energy and effort that you three have spent are inestimable to me. Without your encouragements, friendliness and enthusiasm this thesis would not have been written. To put it simple, you are worth your weight in gold!
A big thanks to Adjunct Professor Anders Fundin and Anette Brannemo for always taking time to receive and consult me, you have not turned me down once. Even though I do not always make it explicit, I value the laughs and moments shared with the highly talented people at IDT graduate school.
I am grateful towards Ivan Obrovac and Volvo Construction Equipment for giving me the opportunity to become an industrial PhD student. Further, I would like to thank the ProLoc research project and VINNOVA for the financial support. My gratitude towards my former managers, Fredrik Berntsson and Catrin Mattsson, for always ensuring that the workload did not impact on my research. Thanks to my fantastic colleagues at the Department of Finance and Business Control at Volvo Construction Equipment (Customer Support) for always supporting and covering for me.
Thanks to all my awesome friends for the encouragements over time. Last but not least, I would like to thank my family for the unconditional love and support. It would require endless combinations of superlatives to describe my feelings for you.
Eskilstuna, May 2011 Mohammed
Publications
Appended papersPaper I - Salloum, M. and Wiktorsson, M. (2009) “From Metric to Process:
Towards a Dynamic and Flexible Performance Measurement System for Manufacturing Systems” Swedish Production Symposium 09, Göteborg, Sweden.
Salloum was the corresponding author and presenter of the paper.
Paper II – Salloum, M., Wiktorsson, M., Bengtsson, M. and Johansson, C.
(2010) “Aligning Dynamic Performance Measures” 6th European Conference on Management, Leadership and Governance, Wroclaw, Poland.
Salloum was the corresponding author and presenter of the paper.
Paper III – Salloum, M., Bengtsson, M., Wiktorsson, M. and Johansson, C.
(2011) “ Designing a performance measurement support structure – A longnitudinal case study” Swedish Production Symposium 11, Lund, Sweden.
Salloum was the corresponding author and presenter of the paper.
Paper IV – Salloum, M. and Wiktorsson, M. (2011) “Dynamic abilities in
performance measurement system: a case study on practice and strategies” 18th EurOMA Conference, Cambridge, UK.
Salloum was the corresponding author of the paper.
Other publications
Bruch, J., Wiktorsson, M., Bellgran, M. and Salloum, M. (2011) “In search for improved decision making on manufacturing footprint: A conceptual model for information handling” Swedish Production Symposium 11, Lund, Sweden.
Table of Contents
1. Introduction...1
1.1 Background ... 1
1.2 Problem Description and Research Objective... 3
1.3 Research Questions ... 3
1.4 Delimitations ... 4
1.5 Contribution ... 4
1.6 Outline of the Thesis ... 4
2. Research Methodology ...7
2.1 Scientific Approach... 7 2.2 Research Process ... 9 2.3 Data Collection... 11 2.4 Analysis of Data ... 15 2.5 Quality of Research ... 163. Frame of Reference ...19
3.1 Performance Measurement, a Historical Aspect ... 19
3.2 The Balanced Scorecard (BSC)... 22
3.3 The Relationship between Measures and Strategy... 25
3.4 State of the art of Dynamic Performance Measurement Systems ... 26
4. Paper Summary ...37
4.1 Paper I ... 37 4.2 Paper II ... 38 4.3 Paper III... 38 4.4 Paper IV... 395. Empirical Findings ...41
5.1 Case Study A ... 41 5.2 Case Study B ... 42 5.3 Case Study C ... 45 5.4 Case Study D ... 496. A framework for dynamic PMS...57
6.1 Factors that constitute dynamics in a PMS ... 57
6.2 Systematisation of factors ... 63
6.3 Realisation of factors... 65
6.4 Summarising the findings into a framework ... 67
7. Conclusions and Contributions ...69
7.1 Conclusions ... 69
7.2 Scientific and Industrial Contributions ... 70
7.3 Quality of the Presented Research ... 70
7.4 Future Research... 71
1. Introduction
This introduction gives a brief background of the contemporary challenges in creating performance measurement systems that are dynamic. After the background has been presented, the problem description, research objective, research questions, delimitation, and contributions are outlined in order to clarify the scope of this thesis. The chapter is then concluded by a brief presentation of the thesis outline.
1.1 Background
In a globalised and ever-changing world the companies surviving are the ones who are able to rapidly and successfully adapt to new conditions. Shareholders, customers, employees, suppliers, technology and society all place demands on the company’s ability to adapt and drive internal and external evolution. Change is not an option anymore but a requirement for survival and the ability to stay competitive.
During the second half of the twentieth century rapid technological and political progress shifted the rules of the game for companies around the world. Globalisation started to change the nature of making business, trade barriers were lowered and successful companies began to compete in an international arena and regarded the world as their market (Rolstadås, 1998). Companies were no longer confined to their geographical locations and started to compete for customers across the globe. However, with these technological, political and market changes came mounted pressure on amplified performance and increased market shares for companies on the global market. One way to continuously improve (Cross and Lynch, 1992), enhance productivity (Bernolak, 1997) and assess the performance of processes and whole operations is performance measurement (Slack et al, 2004). For the last 15 years the field of performance measurement has been in focus in an ever-increasing number of fields (Folan and Brown, 2005). Research evidence indicates that measuring firms outperform non-measuring firms financially, in management of change and in being perceived as industry leaders (Lingle and Schiemann, 1996). Ittner et al (2003) develops the argument and states that companies extensively using financial and, in particular, non-financial measures earn higher stock market returns than firms with similar strategies and value drivers that do not deploy performance measures as extensively.
During the latter half of 2008 it became unquestionable for some companies with large manufacturing units in Sweden that their performance measurement systems (PMS) lacked mechanisms allowing them to reflect the business environment in which they operate. An economical boom was rapidly replaced by a financial crisis with severe repercussions globally. Several companies within the Swedish manufacturing sector witnessed how record breaking order intakes and production output were promptly substituted by negative order intakes and plant closings. Strategic objectives and investment initiatives solely purposing to increase occupancy rates, production output and capacity needs were, over night, replaced with large-scale redundancy notes, cost cutting programmes and heavy decline in market demand. The unforeseen and extreme market conditions deeply impacted on the PMS of these manufacturing units. The performance measures deployed when the occupancy rates were high became inappropriate and irrelevant when the factories struggled to stay open. However, the manufacturing units soon realised that their PMS did not have the capabilities to replace obsolete measures.
A paradox arose when manufacturing units in dire need to quickly rearrange internal priorities and focal points stood without means to make it happen. Management teams and production supervisors were dispossessed of performance follow-ups as performance measures became obsolete and did neither reflect the strategic objectives nor the current business environment. As a direct consequence, production performance follow-ups became narrowed down to more static measures such as safety and environment. Even though a dynamic environment needs dynamic performance measures (Tatikonda and Tatikonda, 1998), companies often struggle to reflect the evolving business environment and priorities in their PMS. The development, implementation and use of adequate performance measurement frameworks are some major challenges confronting organisations and, at the same time, significant success factors (Santos et al, 2002). Moreover, the failure to simultaneously replace obsolete measures with relevant dittos is resulting in added confusion and cost for companies (Paranjape et al, 2006).
The literature surrounding the field of performance measurement and management is vast and dense, however, a gap regarding how to keep PMS up to date and dynamic exists (Ghalayini and Noble, 1996; Melnyk et al, 2004; Neely, 2005; Bourne, 2008). Even though it is generally accepted by academics and practitioners alike that performance measures ought to be derived and aligned to strategy (Dixon et al, 1990; Wisner and Fawcett, 1991; Cross and Lynch, 1992), the knowledge about the factors that affect the evolution of a PMS over time is limited due to the a small amount of research that has been conducted in this part of the field (Kennerley and Neely 2003). Empirics indicate that the strategic direction of the company has a limited influence at
the PMS (O´Mara et al, 1998) and that unlike the context that the PMS operate in it appears to be static (Kennerley and Neely, 2002).
1.2 Problem Description and Research Objective
The paradox of combining ever changing and dynamic strategies with stable and predictive PMS has created problems for companies as the strategic direction and business environment alters. Deployed performance measures and measurement systems can quickly become obsolete without the means to re-align them with strategy and business environment. Even though the research in the field of performance measurement is vast, a small amount of research is made regarding the factors affecting dynamic PMS. This became even more apparent during the aftermath of the 2008 financial crisis when the PMS of manufacturing units in Sweden became inappropriate without the means or the understanding to mend them. The small amount of research conducted is a contributing element to why companies often fail to continuously reflect the dynamic business environment in their PMS.
As a consequence of this problem description, the objective of this research is to develop a framework that will support the realisation of dynamic performance measurement systems in manufacturing organisations.
1.3 Research Questions
With the background and outlined research objective in mind, three research questions have been formulated. The first research question is formulated as: RQ1 – What factors constitute dynamics in a performance measurement system?
Due to the little amount of research performed regarding the dynamics in PMS the initial step is to understand what factors that actually affects them.
RQ2 – How can the identified factors be systemised?
To merely identify factors that constitute dynamics in a PMS is insufficient to fulfil the outlined research objective. Research question two inquires how the identified factors can be systemised into a framework.
RQ3 – How can the identified factors be realised?
To generate factors and systemise them is not enough to present a framework with practical relevance. Research question three answers how the findings
from the two previous questions can be realised in order to create a dynamic PMS.
1.4 Delimitations
The research presented is limited to large multinational manufacturing units with the empirical data collected from operational sites within the heavy machinery industry. The research has been conducted at three different manufacturing units with between 800 to 1400 employees at each unit.
Parts of the research end-result are obtainable today in theories concerning various areas within the field of PMS and strategic management. Even though the collected empirics involves considerable amount of data regarding the use of the PMS, the research results presented are limited to the research objective and research questions.
No isolated consideration is given to how the business strategies have been developed and formulated. The final outcome of this research is a framework that will support the realisation of dynamic performance measurement systems in manufacturing organisations, the verification of the framework is beyond the scope of the presented research.
1.5 Contribution
First and foremost this research intends to amplify the understanding of how to realise dynamic PMS in manufacturing organisations. Most PMS available today are reliable but static which has proven problematic as discussed earlier. The expected contribution to the academic community is the enhancement of the understanding of the dynamic PMS requirements. Further, it is expected that the research conducted will raise awareness in the academic community regarding the challenges and struggles that face practitioners in the field of performance measurement.
Regarding the industry, it is expected that the results will provide guidance for practitioners seeking dynamics in their PMS. Furthermore, the ambition is that this research will contribute to increased awareness among management teams regarding the requirements for dynamic PMS.
1.6 Outline of the Thesis
This thesis consists of seven chapters, Figure 1 illustrates how the chapters are related. This first chapter has motivated the chosen subject by presenting a background, problem description, research objective, three research questions,
delimitations and contribution. The second chapter will present how the research has been conducted and how the way of action is consistent with the scientific process and chosen methodological approach. Chapter three presents a frame of reference which gives the reader an insight regarding the developments in the field of performance measurement. Moreover, this chapter also introduces existing frameworks dealing with dynamic PMS today. Chapter four summarises the four appended papers. Chapter five introduces the executed case studies within the scope of this thesis. Chapter six discusses the empirical and theoretical findings and presents a framework for dynamic PMS. Chapter seven presents the drawn conclusions from the research, discusses contributions and quality, and sheds some light on the intended future research. Finally, the four appended papers and three appendixes complete this thesis.
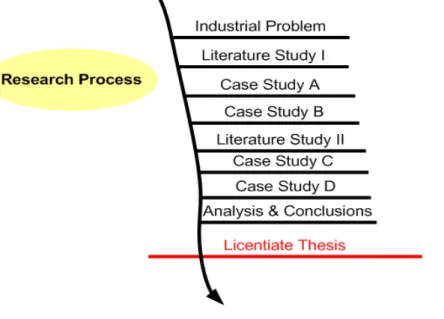
Figure 1: A graphical description of the thesis structure and relationship among the seven chapters.
2. Research Methodology
Chapter two is dedicated to outlining how the research in this thesis has been conducted. The start off point of the chapter is to present the adopted view of science. The research process, chosen strategies for data collection and data analysis are then introduced in order to give the reader an understanding of how the research has been conducted. The chapter is then concluded by discussing the quality of the research.
2.1 Scientific Approach
As highlighted in the introducing chapter, the research presented in this thesis purposes to be valid for the academic and industrial communities alike. The starting point of the research has been influenced by problems and challenges evident in both the real world and in theory as dictated by Fagerström (2004). Throughout this thesis, two literature studies have been iteratively combined with four case studies in order to answer the research questions and objective in a desirable fashion. This approach goes in line with Fagerström (2004) that argues that in order to create dual relevance of the result, the research ought to move in an iterative process combining theory with real world contact (see Figure 2).
Figure 2: Schematic view of the research process - adapted from Fagerström (2004).
According to Neely (2005), the four most cited authors within the field of performance measurement are from four different academic disciplines:
research (Banker) and mathematics/operations research (Charnes). When conducting research within a field with such dissemination, the decision regarding what methodological approach to choose is challenging and sometimes adverse.
Arbnor and Bjerke (1994) have classified three different methodological approaches (see Figure 3). Firstly, the analytical approach which is positivistic and assumes that reality is objective. Secondly, the actors’ approach which is hermeneutic and sees reality as a social construction. Thirdly, the systems approach which assumes that reality is objectively achievable and constructed in a sense that the whole deviates from the sum of its components.
The array of factors that needs to be considered when conducting research within the field of performance measurement is diversified. For instance, the content of performance measures, especially financial performance measures, can be scrutinised from an analytical approach. On the other hand, a PMS is affected by non-analytic factors not considered in a positivistic-based approach such as its temporal, cultural and social contexts. Moreover, the PMS works in an open production system and as a component of a management system, making it suitable for analysis from a systems approach. Neither an analytical nor an actors’ approach can be mutually exclusively applied in this research. In order to ensure that the chosen scientific approach is appropriate for the entirety of the studied phenomenon, a systems approach has been applied. However, the attitude towards the research questions has varied slightly within the systems approach (see Figure 3).
Figure 3: The relationship between the scientific approaches and the formulated research questions. The figure is adapted from Arbnor and Bjerke (1994).
The first research question inquires the factors that constitute dynamics in a PMS and is more inclined to the analytical approach. The second research question deals with the systematisation and puts the relationship amongst the factors at focus. Research question two has thus a more centralised position within the systems approach then the first question (see Figure 3). The third research question manages the realisation of the factors. Even though the relationships between the PMS and the interrelating systems are central, the question is approached from a slightly more hermeneutic angle due to the increased subjectivity and relativity surrounding it.
2.2 Research Process
Figure 4 illustrates the research process in this thesis. In total, two literature studies were executed. The first one was broader and dealt with the field of performance measurement in general but also incorporated operations strategy and strategic management literature. The second literature study was narrower and concentrated on the state of the art of dynamic PMS. The literature studies were initiated before the cases and elapsed until the cases were accomplished. Hence, literature study I was initiated before case study A and elapsed until case study B was accomplished. In the same manner, literature study II started before case study C and elapsed until case study D was closed.
Figure 4: The actual research process. Both literature studies were initiated before the case studies (I before A & B and II before C & D) and elapsed until the cases were accomplished (I until A & B and II until C & D).
In addition to the dual literature studies, four case studies in total were conducted. Case study A consisted of mainly participative observations at a manufacturing unit producing components for heavy constructional machines in the region of Mälardalen, Sweden. As illustrated in Figure 5, the commencing case study is perceived as a research clarification. In the initial phases of the research the problem area was based on an observed symptom in the industry, case study A helped to search beyond the symptom and find the actual problem. Case study A was published as a conference paper (Salloum and Wiktorsson, 2009, Paper I).
Figure 5: Relationship between research objective, research questions, case studies and deliverables.
Case study B involved two case companies. This case was based on an interview study, direct observations and analysis of archived data. The first case company is located in the region of Mälardalen, Sweden, and manufactures components for heavy constructional machines. The second case company is located in South Korea and processes, manufactures and assembles heavy constructional machines. Case study B helped to answer all three
research questions (see Figure 5) and was published as a conference paper (Salloum et al, 2010, Paper II).
Case study C was also conducted at a manufacturing unit producing components for heavy constructional machines in the region of Mälardalen, Sweden. The case stretched for 10 months and the main data source for the study was participative observations. This case helped to answer all three research questions as illustrated in Figure 5. The findings of the case study was summarised and published as a conference paper (Salloum et al, 2011, Paper III).
Case study D was, just like case study B, based on an interview study, direct observations and analysis of archived data. The fourth case was conducted at a truck manufacturing site in Australia. This study helped to answer all three research questions and the findings are summarised in an accepted conference paper (Salloum and Wiktorsson, 2011, Paper IV).
2.3 Data Collection
2.3.1 Literature studies
Two literature studies in total were executed. The literature studies has been used to form the data protocol for the case studies but also, as Yin (1994) argues, to develop sharper and more profound research questions.
To initiate both literature studies, the databases of Proquest, Emerald Insight and to some extent Google Scholar, were searched through using following keywords: performance measures, performance measurement, performance measurement systems, performance management, performance metrics, performance management process, dynamic performance measurement system, evolving measurement systems, strategic management, the balanced scorecard, strategic alignment, performance measurement alignment, alignment, key performance indicators, history of performance measurement, performance measurement in change, revision of performance measures, updating performance measures, updating performance measurements, organisational change, changing performance measures, updating performance measurement systems, updating performance measures, audit of performance measures, auditing of performance measurement systems, reviewing performance measurement systems, reviewing performance measures, quality management and performance measurement, dynamic performance measures and dynamic key performance indicators. Further, the databases were also searched through typing author surnames: Kaplan, Norton, Ghalayini, Neely, de Waal, Bititci,
Drucker, Mintzberg, Skinner, Chandler, Eccles, Dixon, Kennerley, Bourne, Keegan, Sink, Tuttle, Cross, Lynch, Charnes and Banker.
Once a solid base of academic articles had been obtained the search of literature was extended to books referred to in the articles. Finally the ingoing material to the research study was finished by searching through the journals of: International Journal of Production Economics, International Journal of Operations & Production Management, Measuring Business Excellence, International Journal of Productivity, Management Accounting Research, International Journal of Productivity and Performance Management, Management Science, Performance Management and to some extent, the Harvard Business Review.
The journals were not searched through with the use of keywords but instead volume by volume. However, some volumes were not searched through due to library access restrictions. The literature studies were integral for answering the first research question and provided important insights for the answering of the other two research questions.
2.3.2 Case Data Collection
In total, four case studies were executed. The reason for using case studies, and not for example surveys, is the possibility of an in-depth (Bell, 2000) and holistic (Merriam, 1994) study of the formulated problem. Moreover, the type of research questions, the level of control on behavioural events and the focus on contemporary events also influenced the choice as advocated by Yin (2009). The data collection methodology of each case study is discussed in more detail below.
Case Study A
The main data source for case study A is participative observations. The research involved social interaction between the researcher and the informants in the milieu of the latter, during which data was systematically and unobtrusively collected as advocated by Taylor and Bogdan (1998). Besides the participative observations, three out of the six data sources for case studies proposed by Yin (1994) were applied: documents, archival records and direct observations. Collection of physical artefacts and interviews were not conducted. The documents and archival records took the form of meeting minutes, emails, presentations, process descriptions and standardised work routines. Moreover, the participating-observations were made by the researcher as an employee in the case company as a financial controller. The direct observations were made at certain performance measurement meetings that were attended in capacity of a researcher.
Case Study B
Case study B is multiple and involves two units of analysis (case companies). The case study process is based on the principles of case study design suggested by Yin (1994). The choice of the first case company, the Swedish site, fell natural as the researcher was in service there as a financial controller. The choice of the second case company, the South Korean site, was taken due to a reputable production system, IS/IT capabilities and the cultural aspects of comparing two companies located at different continents. After the choice of case companies a data collection protocol with three components was designed:
• Observations of archived data – Includes the financial database, information systems, operational manuals and processes of the case companies.
• Interview study – Interviews was divided into three parts: opening part with open questions, middle part with semi-structured questions and a closing questionnaire.
• Direct observations – Direct observations were applied consistently over the case study during factory tours, process introductions and meetings. The open questions purposed to generate an understanding of how each interviewee perceived the PMS, the way of working for keeping it up to date its closely correlated systems and processes. The semi-structured questions are slightly more structured than the initial questions and purposed to generate an understanding of the qualities of certain characteristics of the PMS and in the work of keeping it up to date. The closing interview questionnaire purposed to gauge how well the interviewees believed that their organisation kept the PMS up to date (see Appendix B).
Throughout the case study personal notes were taken during interviews, direct observations and collection of archived data. The databases, manuals and processes were scrutinised in order to create an accurate picture of the process and system capabilities of each case company. The nine members of the executive management board in Sweden were invited to separate interviews that took between 40-60 minutes each to execute and were held at random conference rooms at the manufacturing site.
Seven members of the executive production management board at the South Korean unit were invited to separate interviews that took between 50-70 minutes each to execute and were held at a designated conference room at the manufacturing site. All interviews were executed based on the principles developed by Lantz (1993).
Case Study C
Case study C used participative observations as its main data source. In addition, the empirical data acquisition was also made through observations, informal discussions, formal discussions and reflections. Thus, the study was hybrid of structured and unstructured observations (Bell, 2000). Moreover, material such as meeting minutes, emails, presentations and personal notes from meetings were also used as empirical data.
At the end of each day the researcher had time reserved for writing in a case diary. The content of the case diary was composed of analysis, constructions, personal reflections and thoughts of the progress of events as advocated by Merriam (1994). The recommended directions by Taylor and Bogdan (1998) for registration of information were applied to the highest possible extent in order to enhance the empirical collection:
• Be attentive and observant.
• Interchange between broad and narrow focuses.
• Observant regarding key words in the individual’s way of communicating. • Concentrate on the openings and closings of sentences.
• Mentally recapitulate the progress of events during breaks and pauses. Even though the chosen method is widely recognised, the challenges of biases and subjectivity associated with it need to be highlighted. Biases and subjectivity impacts on the conception, registration and interpretation of the collected information and an observer can not evade or elude this influence (Merriam, 1994). The limit of this influence comes down to the capability and skilfulness of the researcher, this is further discussed in section 2.5.
Case Study D
In converse to case B, case study D was executed with only one unit of analysis (case company). This case is based on the principles of the design of single case studies advocated by Yin (1994). The applied data collection protocol consisted of three components:
• Observations of archived data – Includes the financial database, information systems, operational manuals and processes of the case company.
• Interview study – Interviews was divided into two parts: opening part with open and semi-structured questions and a closing questionnaire for some of the interviewees.
• Direct observations – Direct observations were applied consistently over the case study during factory tours, process introductions and meetings. The open questions purposed to generate an understanding of how each interviewee perceived the PMS, the way of working for keeping it up to date and its closely correlated systems and processes. The semi-structured questions purposed to generate an understanding of the qualities of certain characteristics of the PMS, in the work of keeping it up to date and its closely correlated systems and processes. The closing questionnaire purposed to gauge how important and complex each interviewee perceived factors constitutional for creating dynamic PMS. The questionnaire was only given to the executive management and first-line managers.
Throughout the case study a diary was kept and personal notes were taken during interviews, direct observations and collection of archived data. The interviewees were divided into two groups depending on their hierarchical belonging in regards to the interview material (see Appendix C). An interview material with nine question areas and a questionnaire were used for the executive and first-line management. In contrast, team leaders and other staff had an interview material consisting of eight question areas. The total interview study mounted up to 20 interviewees with five being executive managers, first-line managers, seven team leaders and two other white collars. All interviews were executed based on the principles developed by Lantz (1993).
2.4 Analysis of Data
Empirics and theories have been analysed simultaneously in multiple rounds. The purpose of this was to ensure that generated results remained practically and theoretically relevant during the entire research process. In order to analyse the data in an established and adequate manner two strategies were applied. Firstly, the strategy of pattern matching logic has been applied due to its appropriateness in multiple case study research (Yin, 1994). This method of analysis comes down to contrasting patterns discovered in empirics and anticipated equivalences. Secondly, the findings from each separate case study and from the overall research study has been clustered as suggested by Merriam (1994). Clustering implies that findings that resemble each other are grouped in categories. The clustering can be done in several dimensions but regardless the quest is to firstly group findings and secondly to conceptualise resembling trends and qualities (Merriam, 1994).
2.5 Quality of Research
2.5.1 Validity
To ensure that the research results are reliable and useful, validation is of utmost importance. The validity techniques applied in this research are based on Olesen’s (1992) five factors of validation and Denscombe’s (2000) seven questions of validation (Table 1).
Table 1: Five factors and seven questions of validation (the seventh question discussed separately).
Five factors of validation (Olesen, 1992)
Seven questions of validation (Denscombe, 2000)
Internal logic – The result is based on known and accepted theories, and that there is a connection between the starting point, the hypothesis and the result.
1. Do the conclusions respect the
complexity of the researched phenomenon while being consistent?
Truth - The theoretical and practical results can be used to explain “real” phenomena.
2. Is the chosen approach of examination of the research purpose reasonable and clearly motivated?
Acceptance – That other researchers accept the theories used in the project, and that professionals use tools based on the theory.
3. Has results been triangulated with other sources?
4. Has any alternative explanations been investigated?
Application – That use of the tools leads to the probability for success increasing with repeated use. They do not
necessarily lead to success every time, but over a period of time they will give better results than if they were not used.
5. Has the informants been presented the research results and given the opportunity to give their feedback of it?
Novelty value – That new solutions are presented, or that new ways of looking at a particular problem are introduced.
6. To what extend does the research results concur with results and conclusions of existing knowledge within the subject?
Acceptance, internal logic and to some extent, novelty value, are ensured by the review process that the approved academic articles appended to the thesis have been put through. The mixed use of data sources such as participative observations and interview studies has enabled the study of the phenomenon from various perspectives and situations. This mix has contributed to a deeper understanding of the complexity and has contributed to include these nuances in the drawn conclusions.
The truth and application of the research conducted has been validated continuously as the research strives for both industrial and academic relevance. The research results of each study were presented to the informants and alternative explanations has been to some extent highlighted and discussed in the findings. By testing the findings and by mixing the data sources within the case studies triangulation has been achieved. The data protocols used for each case study is based on literature studies within the field and earlier findings within the own research. Each informant received a transcribed version of their interview and validated it before the phase of analysis started. Moreover, each company involved in the empirical gathering has validated the content of the academic articles related to their case study before publication. Finally, the findings derived in this thesis do not oppose and contradict results and conclusions made by other researcher within the field.
The seventh question posed by Denscombe (2000) highlights the role of the researcher: has the “self” of the researcher been acknowledged as influencing to the research conducted without distorting the research results?
Several precautions have been made in order to secure that the self does not impact on the quality of the conducted research. When conducting participatory studies at the company, a diary has been written on daily basis containing both research and work related tasks. A reflection part is also included in the diary where the researcher reflects on what has been done and to what purpose.
2.5.2 Reliability
Reliability is, according to Merriam (1994) the extent that the research results can be repeated. Moreover, reliability can also be seen as the ability to execute a test in multiple manners (Arbnor and Bjerke, 1994).
All studies conducted within the presented research have been documented to the highest possible extent, from the initial contact with the companies to the analysis of the empirical data. In two out of four case studies a case diary was written during the study in order to keep track of actions and occurrences. In general, the documentation of the interview phase of the studies was stronger than the phase of observations of archived data. This is due to the higher level of planning required for the interview phase with creation of interview material and transcription of interviews. In order to amplify the reliability of the presented research in this thesis, the interview documentation for case study B and D have been appended (see Appendix B and C). The presented precautions are in line with those advocated by Yin (1994) regarding documenting the procedures and actions within a case to the highest possible
3. Frame of Reference
The frame of reference introduces the theoretical framework of the research. This section presents the two literature studies described in section 2.3.1. Four sections distinguish this chapter: Initially, the theoretical development in the field is presented from a historical perspective, both in general and from an operations management perspective. Secondly, the balanced scorecard framework is presented in order to give the reader an insight of the most impacting framework within the field of performance measurement. Thirdly, the state of the art of dynamic performance measurement systems is presented. Finally, a reflection over the state of the art ends the chapter. Moreover, Appendix A defines the key terms adopted in this research and hence supports the frame of reference.
3.1 Performance Measurement, a Historical Aspect
No universal narrative exists explaining the evolution of the field of performance measurement from genesis to its contemporary condition. However, some researchers have tried to classify the field into distinctive time periods and phases. From an operations management perspective, Radnor and Barnes (2007) argues that the evolution performance measurement can be divided into three distinctive time periods in continuous evolution; the early twentieth century, post WWII and mid 1980s. The transition between these eras should not be seen as revolutionary or sudden but bevelling (Radnor and Barnes, 2007). In converse, Ghalayini and Noble (1996) perceive the performance measurement literature to be divided into only two phases, 1880s and 1980s. Neely (1999) also emphasis the two phase evolution of the field, and argues that in the transit between 1980s and 1990s a performance measurement revolution occurred with seven underlying reasons. The detachment of ownership and management and the introduction of the tableau
de bord in France also influenced the progress of the field (Brudan, 2010). Irrelevant of how the periods of evolution are classified, it stands clear that the field of performance measurement has evolved from being heavily focused on efficiency and financial measures to balanced approaches with both efficiency and effectiveness as focal points.
3.1.1 Scientific Management and the DuPont Model
Two events have had great impact on the application of performance measurement in the beginning of the 20th century. The first event is focused on
the use of performance measurement in operations management. When Frederick Taylor introduced scientific management he set a new paradigm for the behaviour of management. Taylor built his philosophy around the principle that management was responsible of devising the most efficient method of performing work. By devising the most efficient methods of work, increased efficiency and output of individual workers would be derived. New and improved methods were derived via analysis of existing work methods and the performance of these new methods was then closely monitored through the use of performance measures (Radnor and Barnes, 2007).
The second event concerned the measurement of performance for a whole business. The DuPont model was developed in the beginning of the 20th century and incorporated nearly all basic methods that were used to manage big businesses long after its creation (Chandler, 1977). Due to the penetrating power that the model had when it was introduced, the financial measures that it consisted of became widely adopted (Neely and Bourne, 2000). Some have even argued that the work of DuPont and General Motors was the genesis of the field of performance measurement (Tangen, 2004).
These two events resulted in that performance measurement, from a micro perspective, were used to assess productivity in operations management (Radnor and Barnes, 2007), and from a macro perspective to gauge the performance of companies (Neely and Bourne, 2000). With the labour intense operations of the early twentieth century, performance measures appropriately emphasised cost with a focus on financial measures such as productivity, profit and return on investment (Ghalayini and Noble, 1996).
3.1.2 Human Relations Movement
Regardless of the widespread impact of scientific management, the theories of Frederick Taylor were not without critics. The human relations movement, which had it origins in Elton Mayo’s Hawthorne experiments and Abraham Maslow’s hierarchy of needs amongst others, argued that scientific management had a heavy focus on the technical aspects of productivity while neglecting their social equivalences (Radnor and Barnes, 2007). The arguments of the human relations movement were not without scientific support. The experiments at the Hawthorne plant are credited for providing new groundbreaking scientific foundations for management (Smith, 1998). The studies were conducted between the years 1927 and 1932 and examined productivity correlated to work conditions. Benevolent supervision and affection for employees proved to be positively correlated with performance and it was concluded that people were motivated by more than financial
incentives and that that employees achieved best and generated most motivation in humane milieus (Geber, 1986).
Due to the gained popularity of the human relations movement and the low unemployment rates in the era of post WWII, employers were pressured to increase the quality of working in order to retain and attract qualified personnel. As a consequence of these unfolded events, workers were given additional influence over work practices and standards. Frederick Taylor’s paradigm of close monitoring of individual workers was gradually replaced with productivity measures on team levels and experiments such as self-managed teams (Radnor and Barnes, 2007).
3.1.3 A New Paradigm
Globalisation started to change the rules of making business, trade barriers were lowered and successful companies started to compete in an international arena and regarded the world, and not only their nations, as their market (Rolstadås, 1998). In the 1970s the unquestioned position of the American management style became challenged as western manufacturers were pressured by acute competition from Japan. Consumers experienced that Japanese goods were superior in both quality, variety and competitively priced and Western manufacturers were forced to overlook their practices (Radnor and Barnes, 2007). The pure financial way of measuring performance was not longer perceived as an appropriate way of managing a modern business, the widely adopted practices that had realised strong penetrating power after the DuPont model was introduced had hardly been modified since the beginning of the 20th century (Neely and Bourne, 2000). The most apparent difference between Western and Japanese manufacturers was that the former solely focused on efficiency while the latter equally emphasised efficiency and effectiveness. In order to recapture their competitive edge, companies re-evaluated their strategic priorities from solely low-cost production to delivery, short lead time, quality and flexibility (Ghalayini and Noble, 1996).
Due to the change in business environment, the limitations of traditional measures became evident. Measuring performance via solely financial measures became heavily criticised. Kennerley and Neely (2003) for instance, argued that it is broadly accepted that the information provided by cost based systems is insufficient for the effective management of businesses in changing and competitive markets. Skinner (1974) states that the traditional performance measures lack a strategic foundation and fail to succeed in delivering data on quality, responsiveness and flexibility. Najmi et al (2005) concurs and argue that traditional performance measures fail to convey strategies and priorities in
an effective manner within an organisation and Kaplan and Norton (1992) states that traditional measures are too internally focused.
Furthermore, the impact of the shift in correlation between the tangible book value and market value of firms also contributed to the discontentment of traditional performance measures. A study conducted 1982 concluded that the tangible book value represented 62 per cent of the market value of industrial organisations. In contrast, similar studies conducted at the turn of the century showed the tangible book value had shrunken and only represented 10 to 15 per cent of market value. In the process of creating value, the influence of tangible assets had diminished over time and focus has been inevitably put at intangible assets such as customer relationships, innovative products, high quality operational processes, efficient information systems and employee capabilities, further strengthening the argument of the need to abandon sole financial performance measures (Kaplan and Norton, 2001a).
As a consequence of these events and the new competitive reality, companies around the world started to rethink how to measure the performance of their businesses (Eccles, 1991). Balanced and multi-dimensional measurement concepts such as the performance measurement matrix (Keegan et al, 1989), the balanced scorecard (BSC) (Kaplan and Norton, 1992) and Cross and Lynch’s performance pyramid (1988) emerged. These concepts were proactive and emphasised a balance between financial, internal measures and non-financial, external measures (Bourne et al, 2000).
3.2 The Balanced Scorecard (BSC)
As mentioned earlier, the available literature within the field of PMS is vast. According to Neely (1999) statistics show that between the years of 1994 and 1996, 3615 articles were published. Further, in America alone, a new book in the field of performance measurement emerged every fortnight. However, regardless of the amount of literature available, one PMS has had a higher impact than any other framework within the field. Several citation/co-citation analysis point at the undeniably dominance of the BSC framework (Marr and Schuma, 2003; Neely, 2005). The BSC is perhaps the best known PMS existing (Neely et al, 2005) and has been widely adopted in practice (Rigby, 2001). The framework has even been listed as one of the most important management tools of the last 75 years by the Harvard Business Review (Bourne et al, 2002). Over the course of time, the originators have continuously refined the BSC (Andersen et al, 2004) and today three generations of the concept exist (Lawrie and Cobbold, 2004). Kaplan and Norton (2006) argue that the BSC has since the introduction evolved to a system for managing the execution of strategy.
3.2.1 The First Generation BSC
The BSC was developed 1992 by Robert Kaplan and David Norton based on the notion that sole reliance on financial measures in management systems is insufficient. The idea was to use a balanced set of measures to allow executive managers to take a fast but comprehensive look at four crucial perspectives of business (Kaplan and Norton, 1992; 2001b). These perspectives are derived to provide answers to four paramount questions illustrated in Figure 6:
• How do we look to our shareholders? (financial perspective) • What must we excel at? (internal business perspective) • How do our customers see us? (the customer perspective)
• How can we continue to improve and create value? (innovation and learning perspective)
Figure 6: The balanced scorecard (Kaplan & Norton, 1992).
The BSC uses financial performance measures as tools to display results of taken actions. Moreover, the model deploys operational non-financial performance measures to assess drivers of future financial performance. The purpose of streams of information from several directions in combination with a limited set of measures is to guard against information overflow, sub-optimisation, combining disparate elements in a single report and to keep the focus at the most crucial aspects of business (Kaplan and Norton, 1992).
3.2.2 The Second Generation BSC
The relationship between strategy and performance measurement was amplified in the second generation of the BSC (Kaplan and Norton, 1996b;
that strategy is founded upon became the focus point (Kaplan and Norton, 1996a). The biggest addition to the second generation BSC was the concept of strategy maps (Lawrie and Cobbold, 2004). A Strategy map helps to create a clear line regarding how jobs are linked to overall objectives of the organisation and gives a mean for clearly communicating the strategy (Niven, 2006). Moreover, they provide a visual representation of critical objectives and the relationships among them that drive organisational performance and show the cause and effect relationships (Figure 7). Further, strategy maps allow companies to describe and communicate the value of both tangible and intangible assets (Kaplan and Norton, 2000).
Figure 7: Strategy maps (Kaplan and Norton, 2001a).
3.2.3 The Third Generation BSC
The third generation BSC is a refinement of the earlier generation of the concept in order to further amplify the functionality and strategic relevance. The additions made to the third generation BSC are a destination statement and an additional concept of strategic linkages. The destination statement is a quantitatively detailed description of what the organisation is likely to resemble at a set future date (Lawrie and Cobbold, 2004) and the concept of strategic linkages is a simplification of the strategy maps depicted in Figure 7.
3.2.4 Applauded and Criticised
Even though the impact of the BSC is well documented, critics have not been sitting in silence. Ghalayini et al (1997) argues that the weakness of the BSC is that it is conceptualised as a tool of controlling for senior managers, and is not applicable at factory operation levels. Furthermore, another weakness is the lack of a competitor perspective. Smith (2005) argues that the BSC is weak in the contribution to employees and suppliers, that the concept is silence on the selection of measures and that it failure to address HR issues and strategic uncertainties. Neely et al (2001) argues that even though the BSC has been pioneering, the world has moved on to new priorities that are not reflected in the framework. Brignall (2002) argues that the linear nature of the tools for designing and implementing the BSC is the problem, strategy maps assume rationality between factors of performance when those relationships are recursive and irrational in practice. Neely et al (2000) develops it further by stating that even though the concept is valuable, it provides little guidance on how appropriate measures can be identified, introduced, and used to manage business. Further, little empirical evidence is available on the relationship between non-financial measures and financial performance (Banker et al, 2000) and despite the fact that the implementation of the BSC been highly recommended in the literature, the majority of organisations are still relying on traditional financial performance measures Gosselin (2005). Moreover, empirics from KPMG management consulting indicate that the overall failure rate of BSC implementation is around 70 percent (Debusk and Crabtree, 2006).
3.3 The Relationship between Measures and Strategy
It is widely recognised in literature that performance measures need to achieve alignment with strategic priorities (Keegan et al, 1989; Dixon et al, 1990; Lynch and Cross, 1991; Kaplan and Norton, 1993; Neely et al, 1994; Bititci, 1995; Neely et al, 1996; Bourne et al, 2000; Bititci et al, 2001; McAdam and Bailie, 2002; Hass et al, 2005; Melnyk et al, 2005; Kaplan and Norton, 2008; Lima et al, 2009). The link between measurement system and strategy is powerful if achieved, creating alignment between the two components will provide information on whether the strategy is being implemented and encourage behaviours consistent with it (Neely, 1999). Further, a successful cascading of performance measures from the strategy will maintain a common focus throughout the organisation (Cokins, 2004).
Tapinos et al (2005) argue that performance measurement has a significant influence in supporting the achievement of the goals of an organisation and in the effectiveness and efficiency of its strategic planning process. Feurer and Chaharbaghi (1995) argue that in the current dynamic environment, the
selection of the measures must be continuous process and that constant review and projection for future measurement requirements are necessary. In an analysis based on the common characteristics of PMS in the literature, Taticchi and Balachandran (2008) concur and list communication/alignment as one of the most desirable features of a PMS. According to Neely et al (2005) measurement systems should be deployed as part of strategic management systems. Measures should hence be derived from strategy and provide consistency for actions and decisions. A literature study conducted by Johnston and Pongatichat (2008) concluded that the benefits of strategically aligned performance measures are:
• Informing the organisation regarding the direction, priorities and implementation of strategy and influences consistent behaviour with it. • Creating a shared base of understanding and aligning short-term actions
with long-term goals.
• The links between the performance of individuals and sub-units are made clear and goals and means are made visible.
• Integration among organisational processes.
• Limiting overemphasis on local objectives, thus reducing sub-optimisation.
• Focusing change efforts and permitting and encouraging organisational learning.
3.4 State of the art of Dynamic Performance Measurement
Systems
As Kennerley and Neely (2002) concluded, unlike the context that PMS operate in, they appear to be static. Empirics indicate that the strategic direction of a company has limited influence at the PMS (O´Mara et al, 1998; Ittner and Larcker, 2003). The dense research and literature within the field is concentrated on the design and implementation of measurement systems, far less has been done in regards to how to keep PMS continuously up to date. However, there are some exceptions, in the coming sections four frameworks will be presented that deals with the problem of keeping PMS up to date and dynamic. Kennerley and Neely (2003) addresses the challenge from a wide perspective while Bititci et al (2000) puts information technology in focus as a possible solution. Najmi et al (2005) takes a hierarchical approach and Ghalayini et al (1997) proposes the combination of three tools in order to create dynamic PMS. Other investigations that address the problem (Farris et al, 2011; Van Aken et al, 2005) have been excluded due to their perceived narrowness. Moreover, the concept of Hoshin Kanri that offers a method to cascade and update strategies and goals in an organisation (Witcher, 2002;
Witcher, 2003; Jackson; 2006; Witcher and Chau, 2007) has been left out due to its focus on the lean principles of manufacturing systems rather than PMS.
3.4.1 Framework of factors affecting the evolution of PMS
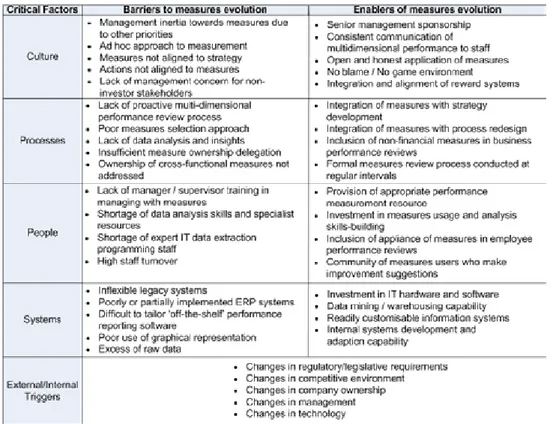
The first framework is arguably the most comprehensive presented in this thesis and has been developed over three articles (Kennerley and Neely, 2002; Kennerley and Neely, 2003; Kennerley et al, 2003). Through empirics gathered from seven case companies, a wide array of enablers and barriers to the evolution of PMS were compiled and broadly categorised under four critical factors; culture, process, people and systems (Figure 8):
• Processes – Existence of a process for reviewing, modifying and deploying measures.
• People – The availability of the required skills to use, reflect on, modify and deploy measures.
• Systems – The availability of flexible information technology that enable the collection, analysis and reporting of appropriate data.
• Culture – The existence of a measurement culture within the organisation ensuring that the value of measurement, and so the importance of maintaining relevant and appropriate measures, is appreciated.
Besides the four categories, internal and external triggers to modification of the PMS are also listed. These triggers can and often do disrupt the normal evolution patterns (Kennerley et al, 2003). The originators argue that the evolution of a system is possible through execution of three phases, namely reflection, modification and deployment. These three phases form a continuously evolutionary cycle (Figure 9):
• Reflection on the existing PMS to identify where it is no longer appropriate and where enhancements need to be made.
• Modification of the PMS to ensure alignment to the organisation’s new circumstances.
• Deployment of the modified PMS so that it can be used to manage the performance of the organisation.
Figure 8: Barriers to and enables or measures evolution (Kennerley et al, 2003).
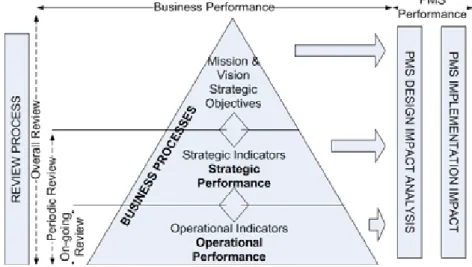
In addition to the three phases a pre-requisite is formulated for enabling evolution. The prerequisite to any evolution is the active use of the PMS. This requires that the PMS is used to manage the business so that the importance of the measures is demonstrated throughout the organisation (Kennerley et al, 2003). In the framework the originators have defined the PMS as a composition of three fractions, the individual measures, the set of measures and the supporting infrastructure (Figure 9). The three phases of the evolution requires the reflection on all components of the PMS.
In order to effectively manage the evolution of the PMS, organisations must relate the enabling factors to the three phases of evolution. Further, the originators developed a maturity model to be used as an assessment tool. The model lists how well developed culture, processes, people and systems are in relation to the requirements of the three evolutionary phases on a five level scale (Kennerley and Neely, 2002; Kennerley et al, 2003). Once developed, the framework was put to test in a longitudinal study at a UK case company. The findings of the study supported the content of the framework.
Figure 9: Framework of factors affecting the evolution of PMS (Kennerley and Neely, 2003).
3.4.2 The integrated model
This framework takes a different approach from the first and puts information technology in centre. Bititci et al (2000) has developed a model (the integrated model) based on research that purposed to explore the use of IT based management tools as self-auditing dynamic PMS. The model is influenced by earlier research results, developments of IT based management tools and characteristics of existing PMS such as the BSC (Kaplan and Norton, 1992), SMART (Cross and Lynch, 1988) and PMQ (Dixon et al, 1990). Within the integrated model, a PMS needs to be dynamic by:
• Being sensitive to changes in the external and internal environment of an organisation.
• Reviewing and reprioritising internal objectives when changes in the external and internal environment are significant enough.
• Deploying the changes to internal objectives and priorities to critical parts of the organisation, thus ensuring alignment at all times.
• Ensuring that gains achieved through improvement programs are maintained.
The required capabilities for a dynamic PMS are divided into two categories: frameworks capabilities and IT platform capabilities. Firstly, the framework capabilities must include an external control system which uses performance measures to continuously monitor the critical parameters in the external environment for changes. Secondly, an internal control system is needed which
the internal environment for changes. Further, a review mechanism which uses the performance information provided by the internal and external monitors and the objectives and priorities set by higher level systems to decide internal objectives and priorities must be included.
A deployment system which deploys the revised objectives and priorities to business units, processes and activities using performance measures is required. Finally a set of systems which; facilitates the management of the causal relationship between various performance measures, quantification of the casual relationships to quantify criticality and priorities, ensures that gains made as a result of improvement initiatives are maintained through local performance measures used by the people who work within activities and processes and finally a system that facilitates identification and use of performance limits and thresholds to generate alarm signals to provide early warning of potential performance problems. For the IT platform, four requirements were also identified:
• The IT platform has to provide an executive information system not just a means of maintaining the PMS.
• The IT platform must be capable of accommodating and incorporating all the elements of the framework as specified above.
• It should be integrated within the existing business systems, i.e. integrated within the existing ERP environment.
• It should be capable of handling simple rules to facilitate performance management, e.g. raising of alarm signals and warning notices.
In reality the need for change is not always driven for the top of the organisation or company, infrequent events can trigger a review of objectives and goals for a business unit that prompts it to review the whole measurement system in order to contribute more and better to the organisations overall objectives. So, instead of having one model applied for the whole business it should be perceived as several models that are interlinked throughout the business as illustrated in Figure 10.
Figure 10: The integrated model (Bititci et al, 2000).