How Does Human Capital and Size
Affect Later Turnover of
New Ventures?
A Study on Swedish Entrepreneurs
Paper within: Master Thesis in Economics Author: Jenni Marie Fliegner
Tutors: Johan Klaesson
Johan P Larsson
Tina Alpfält
Master Thesis within Economics
Title: Does Human Capital and Size Affect Later Turnover of New Ventures? – A Study on Swedish Entrepreneurs
Author: Jenni Marie Fliegner
Tutor: Johan Klaesson, Johan P Larsson, Tina Alpfält
Date: May 2012
Key words: Human Capital, Size, New Ventures, Entrepreneurship, Initial Size, Growth, Sweden
Abstract
After having decided to actually start an own business it might be interesting to know how decisive human capital and size for a newly started company would be. This thesis aims to provide help on the decision of an entrepreneur how and to what extent to invest in hu-man capital and size within the pecuniary constraints an entrepreneur faces. The impact on later turnover is regressed on three different concepts of human capital and two different concepts of size. Despite biases due to selection and problems of multicollinearity there are strong findings that initial size and growth of a company largely positively influence the lat-er turnovlat-er of a business. Weaklat-er and inconsistent results are found for human capital. The human capital turns out to be statistically insignificant for the population of this thesis and for one concept of human capital even contradicting the expected sign of the coefficient.
Table of Contents
1
Introduction ... 1
2
Human capital and size of newly started businessesError! Bookmark not defined.
2.1 Human Capital ... 12.2 Size ... 2
3
Hypotheses ... 1
4
Data ... 1
4.1 Introducing the Data ... 1
4.2 Descriptive Data ... 3 4.3 Correlation ... 7
5
Methodology ... 1
6
Results ... 1
6.1 Summarized results ... 1 6.2 Interpretation of results ... 27
Conclusions ... 1
References ... 2
1 Introduction
Starting an own business one can wonder ‘Does Entrepreneurship Pay? …’ as Hamilton (2000, p. 604) did in his article about the differences in earnings of self-employment and employment in someone else’s company. Even though there is little knowledge and research about the non-pecuniary benefits an entrepreneur gains due to self-employment it seems that “being your own boss” (among others) outweighs for many entrepreneurs to run an own business with lower payments in self-employment compared to higher income in a firm that is owned by others and one is being employed by others.
Despite these factors there are more factors to consider when starting a new business. If one starts a new business it could be very handy to know how one as an entrepreneur could influence the later success of the business just by starting the business with a certain amount of human cap-ital or a certain number of employees. This study reveals two empiric and rather simple features of new ventures that have according to previous literature significant impact on the later perfor-mance, namely human capital and size. One should mention here that the human capital and size can apparently not be chosen totally freely by an entrepreneur because of different constraints like availability of money or expertise. To some extent however, the owners of a company are able to influence them.
The aim of this thesis is to reveal how human capital and size of a firm influence the success of a new venture in Swedish listed companies. The importance of initial size are stressed by for exam-ple Cooper, Woo and Dunkelberg (1989, p.318): ‘One of the most distinguishing characteris-tics of young firms is initial size. Initial size is clearly related to the financial and human resources that must be assembled and may have a bearing upon the subsequent ability of the firm to survive and grow.’
The purpose is to reveal how concepts of human capital and size determine later turnover of start-up companies in Sweden. There will be three different concepts for human capital in line with previous literature and two different ‘size’-variables that measure their impact on the turno-ver. The previous literature on startup businesses focused on the sheer survival of new ventures and not there quantitative achievements. This thesis however will reveal how human capital and size influence the later success of a company in terms of the turnover.
My thesis seeks for a straight forward relation of human capital and size on later turnover of companies to support an entrepreneur to have an idea with how much human capital and em-ployees the new venture should be started best (within his constraints) to have a high probability of high later turnover and secure later success and therefore a linear regression will be run.
The data of this study is exclusive due to its completeness of the active firms in Sweden and de-tailed information of Swedish entrepreneurs. Moreover, a cross-sectional regression will be run on the population of interest instead of on a subsample. The population of interest in this case is all businesses that were started in 1997, still existed in 2005 and are Swedish listed companies (‘Aktiebolag’).
The outline of the thesis is as follows. In chapter two human capital and size will be introduced, former literature on them will be discussed and different concepts of measuring will be clarified. After discussing human capital and size the hypotheses will be stated and illuminated. This will be followed by the methodology part where I present the regression that was run, assumptions and fit of the model and lastly the weaknesses of the methodology with some ideas of improvement. In the fifth chapter I will explain the data in general and the variables in detail with hints of weaknesses of the estimations. The thesis ends with the section for the results and conclusions. The section of the results starts with presenting plots of the variables of interest to emphasize
problems of the dataset and the estimation. This will be followed by a discussion on the results and the last chapter of this thesis will discuss conclusions one can draw from the results and give suggestions for further studies.
2 Literature Review and Background
2.1 Human Capital
One of the first researchers developing a human capital theory was Becker (1964). Initially this ra-ther empiric concept of human capital was examined to reveal a relationship of one person’s in-vestment in human capital and their later level of income. Becker defines human capital as knowledge and skills that are the result of investment in different kinds of education and experi-ence.
There are two main mechanisms how human capital affects survival or alternatively success of a company. The success of a startup business can for once be very dependent on external financial aid (for example Gimmon & Levie, 2010; Boden & Nucci, 2000 or Colombo & Grilli, 2005a) which is an indirect mechanism. On the other hand there is the influence of human capital itself that has an impact on the performance of the new business (for example Amendola & Bruno, 1990 or Berman, Bound & Griliches, 1994).
To gain trust in a new venture of external financiers the owners have to show some kind of relia-bilities or securities. The qualification of a company can be measured by its human capital and therefore the human capital can be a measurement of security for prospective financiers (Gimmon & Levie, 2010). Another mechanism assumed by studies in financial economics regard-ing fundregard-ing of a company is that higher human capital of entrepreneurs of a new startup leads to higher earlier wages and therefore higher financial capital during the starting period and therefore access to higher credits (Boden & Nucci, 2000 or Colombo & Grilli, 2005a). These are influences of human capital in terms of financial support or as Cressy (1996) puts it ‘the bank is betting on the winner’ (with higher human capital).
Besides the financial aid human capital can help to acquire more qualified employees. Human capital can have an impact on a venture’s innovative activity and therefore its later success. Inno-vation starts with ideas and creativity by the human capital of a firm (Amendola & Bruno, 1990). Therefore the ability to acquire more highly educated employees can be understood as an secur-ing innovative process of a company and therefore again be a sign of quality and security for pro-spective financiers. Other studies come to supporting conclusions. Berman et al. (1994) or Amendola and Bruno (1990) reveal a high correlation of human capital and high degree innova-tions of a company.
To exemplify the importance of human capital one can have a look at Cressy’s (1996) work where the survival of a firm as dependent variable does not correlate at all anymore with finance as soon as human capital is controlled for in his model. In Bates’ (1995) article he writes that his strongest predictors are the variables for human capital for female entrepreneurs starting a new venture.
Intuitively one would think that generally more experience will lead to more success of a start-up company. But there are studies which revealed that the success of a new venture is lower if the experience of the entrepreneur is solely due to starting up a business in general. These studies measured experience as any managing experience and high-growth experience of companies without profound education or only limited knowledge in line with their new businesses (Jo & Lee, 1996). A study on innovative activity of start-ups in Japan could not conclude either that managerial experience in general is statistically significant (Lynskey, 2004), neither could Boden and Nucci (2000) find a correlation between experience in management in general and retaining ownership of their firms.
However, studies which differentiate the variables measuring human capital reveal significant re-sults; the higher the human capital of a start-up company in line with their business is the bigger is the size of it and therefore the probability of survival (Colombo, Delmastro & Grilli, 2004). In line with these arguments are the results concerning that the positive relation between human capital and survival (size of company) is greater if the human capital is measured as knowledge in line with the new venture (Colombo et al., 2004 or Bosma, van Praag, Thurik & de Wit, 2004). It seems that the human capital needs to be differentiated and cannot be measured as one general variable of education. Colombo and Grilli (2005a) find strong evidence for the impact of eco-nomical education and managerial experience in line with the new business on the success for a new venture. Bates (1995) controls for different industries and comes to the same conclusion for most industries: that more expertise brings more success; albeit in there article construction is an exception. Davidsson and Honig (2003) studied on the impact of social and human capital on success of nascent entrepreneurs and revealed a statistical significance for work experience but weak significance for managerial experience. This might be due to the fact that they did not dif-ferentiate managerial experience to different lines of businesses and emphasizes that managerial experience should be controlled for by management experience of resembling products.
These previous studies show that it is important to measure the impact on success or survival (in this thesis later turnover) by differentiated concepts of human capital instead of one overall measurement.
2.2 Size
If one could say that a certain number of initial employees or the growth rate of a company will ascertain with high probability a specific level of high turnover in somewhat later years it could give an entrepreneur guidance to decide with how many employees to start with or how to strengthen the labor force by increasing the sheer number of employees in upcoming years. This would imply that one expects a small new venture to differ a lot in its performance from a big new venture or a fast growing venture from a slowly growing venture. This guidance can apparently not be understood without constraints. The decisions an entrepreneur is facing is limited by different constraints like available money or expertise and therefore can only be made in certain limitations and not totally freely.
There are four main mechanisms of size in general preventing companies from failure (Esteve-Pérez & Mañez-Castillejo, 2008). Firstly, if companies are relatively big they tend to produce closer at the level of common market efficiency and therefore are more likely to stay in business (Audretsch & Mahmood, 1994). Secondly, bigger businesses tend to operate in more branches or products which diversify the risk of failure. Thirdly, size and age are related to each other and come along with experience which prevents firms from failure and helps to be successful. Fourthly, larger companies tend to have better access to additional capital and qualified workers. Some of these mechanisms are applicable for initial size, namely one, two and four, whereas all of them are reasonable for the growth of a firm.
Most of the articles using initial size as a decisive variable on survival just state that initial size is positively related to survival of a company. The findings of how initial size positively relates to survival are very rare. One of the few articles that write out how initial size affects survival as mentioned above is the study by Esteve-Pérez and Mañez-Castillejo (2008). The most stated mechanism (if at all) is the one that understands the impact of initial size on survival is that size works as reliability for prospective financiers (see for example, Baum (1996), Cooper et al. (1989), Cassar (2004)).
The concept of initial size has also its opponents, though. Mata, Portugal and Guimarães (1995) claim that current size compared to initial size is more precise in predicting survival or failure than initial size. Even though there are good reasons to use current size as predictor for later suc-cess this thesis will use initial size instead. Current size is said to be a better predictor (Mata et al., 1995) due to that the size is adjusted to its performance and therefore more up to date than initial size. But the adjustment of the size of a company to its own performance and the market envi-ronment are controlled for in this thesis by the growth rate.
The common comprehension on how growth affects survival is that a business faces lower aver-age costs the bigger it is and therefore the company is more likely to survive (Mata, et al. 1995 and Audretsch 1995). The first one who stressed this issue and is cited from most papers on that topic is Jovanovic (1982). He describes that a firm adjusts its size by earlier performance. The first scale of economy of a newly started company cannot be based on earlier achievements and therefore can only be guessed or be roughly estimated. During the operations on the market a company will learn about its efficiency compared to other companies of the same industry. An efficient company grows and the better it is in predicting its own efficiency in future the more it will grow. This process ensures the likelihood of staying in business. Arrighetti (1994) summariz-es this as: ’… firms grow because they are efficient and survive because they grow’.
Gibrat (1932) was the first one studying on this empiric issue of size of an enterprise. He revealed that size (initial or current) is not an issue of a company’s later development. Nowadays there is an agreement that size actually does matter. My thesis follows the contemporary point of view and aims to reveal the impact of the initial size and the growth rate of an enterprise on the turno-ver of a new venture.
Audretsch (1995) reveals that the initial size of a start-up firm can be decisive if the sector the company is started up in is facing high scale of economies and the firm is not able to grow fast enough. It is easier for a company to survive in a sector with high scales of economy if it either starts big or grows fast. Otherwise it seems not to be competitive enough. Audretsch claims that the higher the scale of economies in one sector the higher the cost disadvantages of a smaller firm compared to other bigger firms in that sector. In order to survive the firm facing a high de-gree of scale economy either has to grow fast or it has to have a relatively large initial size. This implies that in industries with a high economy of scale one would expect the size of a successful startup to be high and in low economy of scale facing industries to be of small size. This is claimed to be only true for early stages of a product in its life cycle but does not hold in the ma-ture stage of a product (Agarwal & Audretsch, 2001). Mata and Portugal (1994) come to the same conclusion that the bigger the entrant the greater the chance of survival is, however they could not verify a significant impact of the scale economies. Another study on size and survival by Mata et al. (1995) confirms that initial size is positively correlated with success whereas if a new plant of an already established business survives it tends to double its size after seven years after the start up. Firms however who entered the market newly (and therefore do not have the advantage of the experience of a parent company) where notably smaller. Cefis and Marsili (2005) published another study on the survival of firms depending on initial size and growth rate of the company. Their findings endorse the studies mentioned above that initial size and higher growth ensure the survival of a company.
On the contrary are findings for Italy which dissent with a positive correlation of initial size of an entrant and later success (Audretsch, Santarelli & Vivarelli, 1999). There is no proof that initial size is positively related to survival which might be due to special market structures in Italy as the say.
Even though the main literature on initial size agrees upon that initial size has a positive impact on later success there might be a tradeoff in deciding about the initial size of a company as shown
by Cooper et al. (1989). In a study on new ventures and their initial size they found that firms that started smaller (just two groups: small and big) tended to have less serious problems. So, if big initial size leads to higher later turnover and small initial size to less problem an entrepreneur might want to be aware of that and decide about the initial size of the new venture by the prefer-ences for either money or security (less problems).
3 Hypotheses
As discussed in chapter two the thesis focuses on how human capital and size affect the success of a newly started business. The previous literature focused thereby on survival of a company whereas this thesis focuses on the impact of human capital and size on later turnover. I men-tioned three different concepts of human capital and two different measurements for size in the previous section which lead to following hypotheses:
(1) The later turnover of a new venture is higher if the owners have former experience in line with their business.
(2) The later turnover of a new venture is higher the faster the percentage of owners holding an academic degree of more than 3 years education grows.
(3) The more the percentage of human capital in a company increases the higher is the later turnover.
(4) The higher the initial size in terms of employees is the higher is the later success meas-ured as the turnover in later years.
(5) The faster the company grows the higher is its later turnover.
All of the hypotheses are expected to have a positive relationship between the independent and dependent variables.
4 Data
4.1 Introducing the Data
The data of this thesis is data from ‘Statistics Sweden’ which holds a wide range of data concern-ing the Swedish Economy. The regression in this thesis is run on a population which is defined by the following features: the company is officially listed since 1997, it still exists in 2005 which encompasses also the span of time where all (growth) rates are based on and it is a limited com-pany. In Sweden limited companies are called ‘Aktiebolag’, in short ‘AB’. It is a population be-cause all companies in Sweden with these characteristics are included in this data set. The number of observations therefore is determined by the selection process enforced by the features just mentioned. The data the thesis is build upon is originally on firm and individual level. The regres-sion was run on the firm level whereby individual characteristics where computed to firm level variables and merged to the firm level data set.
One should mention at this point that there is no available information about the legal stati of the firms before they were officially listed. This causes biases due to that the actual start of a compa-ny could have been several years earlier.
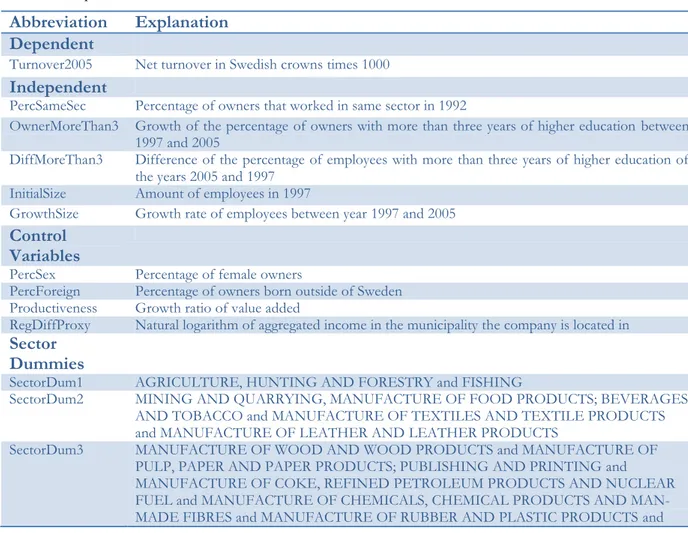
To understand what the labels of the variables stand for the next table (table 1) explains shortly their meanings. More detailed explanations and indications for interpretation for each variable follows later on.
Table 1 – Explanation of variables
Abbreviation Explanation Dependent
Turnover2005 Net turnover in Swedish crowns times 1000
Independent
PercSameSec Percentage of owners that worked in same sector in 1992
OwnerMoreThan3 Growth of the percentage of owners with more than three years of higher education between 1997 and 2005
DiffMoreThan3 Difference of the percentage of employees with more than three years of higher education of the years 2005 and 1997
InitialSize Amount of employees in 1997
GrowthSize Growth rate of employees between year 1997 and 2005
Control Variables
PercSex Percentage of female owners
PercForeign Percentage of owners born outside of Sweden Productiveness Growth ratio of value added
RegDiffProxy Natural logarithm of aggregated income in the municipality the company is located in
Sector Dummies
SectorDum1 AGRICULTURE, HUNTING AND FORESTRY and FISHING
SectorDum2 MINING AND QUARRYING, MANUFACTURE OF FOOD PRODUCTS; BEVERAGES
AND TOBACCO and MANUFACTURE OF TEXTILES AND TEXTILE PRODUCTS and MANUFACTURE OF LEATHER AND LEATHER PRODUCTS
SectorDum3 MANUFACTURE OF WOOD AND WOOD PRODUCTS and MANUFACTURE OF
PULP, PAPER AND PAPER PRODUCTS; PUBLISHING AND PRINTING and MANUFACTURE OF COKE, REFINED PETROLEUM PRODUCTS AND NUCLEAR
MANUFACTURE OF OTHER NON-METALLIC MINERAL PRODUCTS and MANUFACTURE OF BASIC METALS AND FABRICATED METAL PRODUCTS and MANUFACTURE OF MACHINERY AND EQUIPMENT NEC
SectorDum4 MANUFACTURE OF ELECTRICAL AND OPTICAL EQUIPMENT and
MANUFACTURE OF TRANSPORT
EQUIPMENT and MANUFACTURING NEC
SectorDum5 ELECTRICITY, GAS AND WATER SUPPLY and CONSTRUCTION
SectorDum6 WHOLESALE AND RETAIL TRADE; REPAIR OF MOTOR VEHICLES,
MOTORCYCLES AND PERSONAL AND
HOUSEHOLD GOODS and HOTELS AND RESTAURANTS
SectorDum7 TRANSPORT, STORAGE AND COMMUNICATION and FINANCIAL
INTERMEDIATION
SectorDum8 REAL ESTATE, RENTING AND BUSINESS ACTIVITIES and PUBLIC
ADMINISTRATION AND DEFENCE; COMPULSORY SOCIAL SECURITY
SectorDum9 EDUCATION and HEALTH AND SOCIAL WORK
SectorDum10 OTHER COMMUNITY, SOCIAL AND PERSONAL SERVICE ACTIVITIES and
ACTIVITIES OF HOUSEHOLDS and EXTRA-TERRITORIAL ORGANIZATIONS AND BODIES
In this thesis I will use three concepts of higher education in a company; i. e. work experience of the owners in line with their new venture, growth of the percentage of owners with more than three years of higher education and the change of the percentage of the overall higher education of the whole labor force in one company. One concept will reveal the impact of the percentage of owners that worked earlier in the same sector (‘PercSameSec’) on turnover (‘Turnover2005’) eight years after starting up the business following studies by for example Colombo et al. (2004), Bosma et al. (2004) or Cressy (1996). The second concept for human capital (‘OwnerMoreThan3’) will measure how the dependent variable is affected by the growth of the percentage of owners with higher education. The third concept (‘DiffMoreThan3’) will measure how the overall change of percentage of higher educated employees between 1997 and 2005 af-fects the turnover rate. Åstebro and Bernhardt (1999) for example controlled for higher educa-tion also by years of educaeduca-tion. A dummy for higher educaeduca-tion was introduced by Bosma et al. (2004). Boden and Nucci (2000) differentiated higher from lower education by if an owner went to college for more than four years or not.
The common measurement for size is the number of employees. With that I follow for example studies by Colombo et al. (2004), Audretsch (1995), Mata and Portugal (1994) or Cefis and Marsili (2005).
On the two-digit level of the SNI-code of an establishment a variable was generated to check whether an owner worked in the same sector before. In this context it is checked for five years earlier. The value of this ‘PercSameSec’-variable is the percentage of owners that worked in the same sector (five years earlier than the startup) as the company. This is the first concept of hu-man capital introduced in section 2.1.4. The selection of owners that were part of the actively working population in Sweden in 1992 might cause a bias in the results due to that there might be young academics that started a company right after graduation without having work experience in line with their business.
The second concept as mentioned above is the variable ‘OwnerMoreThan3’ that represents the growth of percentage of owners that have a higher education of more than three years where lev-els that were from ‘Statistics Sweden’ reported as unspecified are counted as lower education. Additionally the third variable ‘DiffMoreThan3’ was computed where missing observations are counted as lower education. The variable is the difference of the percentage of employees with more than three years of higher education between the years 2005 and 1997.
The initial size of a company is measured by the amount of employees in the year of foundation. The name of this variable is ‘InitialSize’.
‘GrowthSize’ is a variable which measures how much a company grew from 1997 to 2005 in terms of employees.
The ‘PercSex’ variable stands for the percentage of female owners and it controls for the differ-ence of the performance of a company due to if the owner is male or female.
To control for the potential difference that might occur due to that the owner was born outside of Sweden a variable ‘PercForeign’ was included. The value of this variable represents the per-centage of owners in their company that were born outside of Sweden.
The ‘Productiveness’ variable was computed by the value added of a company divided by the number of employees and of that the growth rate again to control for different levels of produc-tivity between the two years 1997 and 2005.
To control for the different market potentials in Sweden a proxy ‘RegDiffProxy’ was introduced. On the level of ‘AstKommunC’, which is a coded variable for the establishment where an indi-vidual is working, the income of the indiindi-viduals are summed up and merged to the company lev-el. The income of individuals living in the municipality where the company is located in was summed up to control for the different chances for a company to develop in different locations. This variable was included to the model to avoid the implicit assumption of even chances for start-ups all over Sweden.
The sector dummy (‘SectorDum’) was generated by ‘Stata’ on the level of ‘SNI’ (Swedish Stand-ard Industrial Classification) which is a coded variable for the sector a company is operating in. In order to keep the number of dummies low the initially five-digit code was decreased to only one digit. Very few observations missed data for its sector and were added to sector zero. Due to the little amount of missing values the bias is minimal and will not be noticeable. The sectors of the tenth dummy ‘Other Community, Social and Personal Service Activities & Activities of House-holds & Extra-Territorial Organizations and Bodies’ are the sectors all others are compared with.
4.2 Descriptive Data
The following table (table 2) lists all variables used for the regression with the main descriptive statistics to see first indications of non-normal behavior of the data.
The dependent variable of this dataset varies a lot. The mean is relatively low compared to the maximum value which implies that the data is skewed in its distribution and that a ‘high’ turnover in 2005 is very rare. Secondly the standard deviation is more than double as high as the mean which implies that the observations differ a lot from each other. If the skewdness and spread of observations are too high the estimations get unstable which leads to insignificant or unreliable results.
For the variable ‘PercSameSec’ similar is true. The standard deviation is nearly the same amount as the mean which implies a wide spread of the data. But for this variable the mean of 50.78 of 100 in total is reasonable. There are no conspicuous values for ‘OwnerMoreThan3’ or ‘DiffMoreThan3’. The initial size and the growth rate on the other hand are apparently very skewed which will make reliable estimations difficult.
Table 2 – Descriptive table of variables
Variable Obs Mean Std. Dev. Min Max Dependent Turnover2005 1169 8820.64 18222.71 0 205207 Independent PercSameSec 1169 50.78 48.04 0 100 OwnerMoreThan3 1169 3.46 1.42 1 7 DiffMoreThan3 1169 -3.34 1.27 -6.33 -0.78 InitialSize 1169 4.56 6.02 1 102 GrowthSize 1169 0.37 0.97 -0.92 11 Controllvariable PercSex 1169 20.59 32.85 0 100 PercForeign 1169 5.02 19.84 0 100 Productiveness 1169 .08 18.00 -595.5 51.6875 RegDiffProxy 1169 22.42 1.56 19.19 25.79 SectorDum1 1169 .05 .21 0 1 SectorDum2 1169 .00 .06 0 1 SectorDum3 1169 .05 .23 0 1 SectorDum4 1169 .08 .28 0 1 SectorDum5 1169 .01 .12 0 1 SectorDum6 1169 .38 .49 0 1 SectorDum7 1169 .10 .30 0 1 SectorDum8 1169 .22 .41 0 1 SectorDum9 1169 .03 .18 0 1 SectorDum10 1169 .07 .25 0 1
To emphasize the problem of multicollinearity the plots of the variables of interest are depicted which is partly a reason of the poor performance of the regression on the data at hand. In the section of the descriptive table one could already find first hints of weak distributions of the data which lead to biased results due to skewness of the data.
Figure 1 – Data plot of ‘PercSameSec’ against ‘Turnover2005’
The graphs show the scatter plots for each variable of interest against the dependent variable. It is very obvious that the data neither contains useful information for a general statement about the impact of the independent variables on the dependent variable nor does it contain useful infor-mation for forecasting which means there is no linear relationship between the variable of ‘PercSameSec’ and the turnover of 2005.
To actually be able to get an indication of a relationship of ‘PercSameSec’ and ‘Turnover2005’ to some degree the data points of the different levels of ‘PercSameSec’ would need to group around different levels of ‘Turnover2005’. Here are the data points for all levels of ‘PercSameSec’ on a similar low level of the turnover. The same is true for ‘OwnerMoreThan3’ and ‘DiffMoreThan3’, only to some weaker extent.
Interesting to see though, is that the turnover is highest in the companies with either 100% of the owners having experience in line with their business or none at all has worked five years earlier in the same business.
For the variable ‘OwnerMoreThan3’ is no linear relationship apparent, either. One could say that there is somehow regularity in that sense that the overall distribution is more bundled than in the previous plot but there is definitely no linear relationship between how many owners of a new business have a higher education of more than three years and the turnover in 2005. To some ex-tent one can see a similar pattern as in the graph of ‘PercSameSec’ which might be due to the fact that both measures are a kind of human capital.
Again there is no obvious relationship between ‘DiffMoreThan3’ and the turnover in 2005. One can detect by just looking at the plots that there are high correlations of the variables. In the table of correlation below there will be a statistical test on correlation to show formally that the varia-bles suffer from high correlation between variavaria-bles.
The negative numbers of ‘DiffMoreThan3’ indicate that by the companies by growing and stand-ardizing their processes they employ less academically educated but more non-academic workers. The plots for the two variables measuring the impact of size show similar patterns. There is a cloud of data in the lower left corner and some data points spread all over the scatter plot. The high Pearson correlation coefficient of the initial size and the growth rate of size (compare with section 5.5) are easy to retrieve. The high correlation of the two ‘size’-variables, as already noted, will lead to biased results.
Figure 4 - Data plot of ‘InitialSize’ against ‘Turnover2005’
Due to that the data cloud is very localized and in the left lower corner and additionally some da-ta points that are very far away from the main dada-ta points the regression is very unsda-table and might suffer from the leverage effect. This means that the slope of the regression line changes easily if only one or few data points are excluded from the regression.
Again in these plots there are no apparent linear relationships between the levels of initial size in year 1997 or the growth rate of size and the turnover 2005. To some extent the plots indicate that small initial size leads to small later turnover.
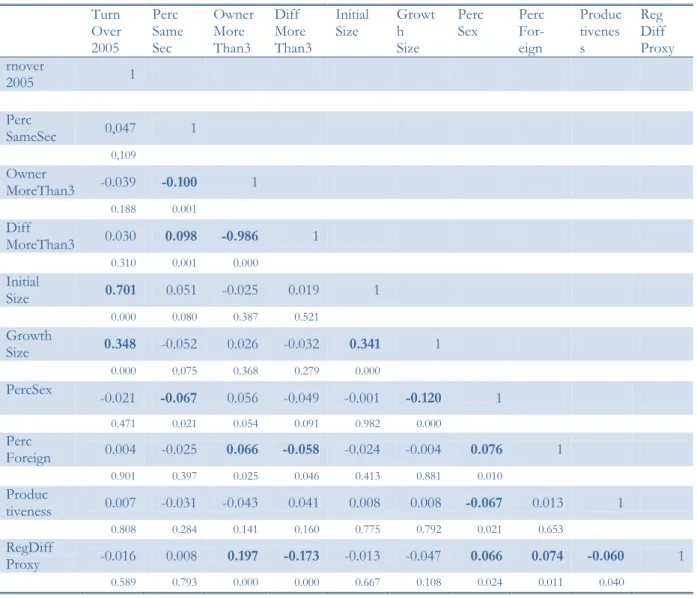
4.3 Correlation
The table below shows the Pearson correlation coefficient between all the variables and their two-tailed significance.
Table 3 – Table of correlation
Turn Over 2005 Perc Same Sec Owner More Than3 Diff More Than3 Initial Size Growth Size Perc
Sex Perc For-eign Produc tivenes s Reg Diff Proxy rnover 2005 1 Perc SameSec 0,047 1 0,109 Owner MoreThan3 -0.039 -0.100 1 0.188 0.001 Diff MoreThan3 0.030 0.098 -0.986 1 0.310 0.001 0.000 Initial Size 0.701 0.051 -0.025 0.019 1 0.000 0.080 0.387 0.521 Growth Size 0.348 -0.052 0.026 -0.032 0.341 1 0.000 0.075 0.368 0.279 0.000 PercSex -0.021 -0.067 0.056 -0.049 -0.001 -0.120 1 0.471 0.021 0.054 0.091 0.982 0.000 Perc Foreign 0.004 -0.025 0.066 -0.058 -0.024 -0.004 0.076 1 0.901 0.397 0.025 0.046 0.413 0.881 0.010 Produc tiveness 0.007 -0.031 -0.043 0.041 0.008 0.008 -0.067 0.013 1 0.808 0.284 0.141 0.160 0.775 0.792 0.021 0.653 RegDiff Proxy -0.016 0.008 0.197 -0.173 -0.013 -0.047 0.066 0.074 -0.060 1 0.589 0.793 0.000 0.000 0.667 0.108 0.024 0.011 0.040
Big numbers: Pearson correlation coefficients, small: numbers two-tailed significant, bold numbers: sign. on 5%-level For the variables of interest one can find six significant correlations between the variables. The highest significant correlation is between the variables of the percentage of the owners with more than three years in higher education and the difference of the percentage of higher education of
ture and its absolute turnover in 2005. This adverts to that the turnover of later years is deter-mined by its initial size. To some extent correlates the growth rate of the size of a company also with the later turnover and the initial size, which is also reasonable. Significant but to small extent does the percentage of owners with higher education correlate with the percentage of owners that worked five years earlier in the same sector.
Due to some high correlations of parameters and the amount of significant correlations there might be the problem of multicollinearity. The problem of multicollinearity imply: (1) imprecise estimation of estimators due to large variances and covariances, (2) which can also lead to that the confidence intervals are too big and therefore the hypothesis that the coefficient is zero is ac-cepted too often, (3) another implication of (1) is that the t-statistic is more often insignificant, (4) the can be very high, (5) the model is very easily influenced by changes of the dataset (dropping outliers)(Gujarati, 2004). In general these problems would lead to instable estimations and the coefficients would not be as precise anymore. Moreover the interpretation of the used model would be unclear.
In order to avoid the bias potentially generated by the two variables ‘DiffMoreThan3’ and ‘Own-erMoreThan3’ two different regressions are run with each regression including only one of the two variables.
5 Methodology
My aim was to examine the widest span of time possible to disclose long term impacts on the success of a new venture. The widest span the data from “Statistics Sweden” would allow was from 1997 to 2005. In order to reveal the impact of human capital and size of a company the var-iables of interest and the control varvar-iables were linearly regressed on the turnover of a firm in year 2005 with the method of ordinary least squares. This gives a linear relationship between de-pendent and indede-pendent variables.
The two regressions that were run on the data are as follows:
(1) (2)
One could say that the normal assumptions of an ordinary least squared regression have not to be taken into account in this context because the regression is run on the population of interest and not on a subsample. Despite this the t-values of the variables of interest will be discussed be-cause they are an indication of the quality of the model.
The interpretation of the coefficients in a linear regression model is straight forward. If quantita-tive or qualitaquantita-tive independent variables increase by one unit the dependent variable increases by the amount of the value of the respecting coefficient.
For the dummies the interpretation is different. The observations of a dummy with value zero implicitly reflect the intercept of the dependent variable. If the dummy takes the value one the dependent variable (here the turnover in 2005) increases by the amount of the respecting coeffi-cient.
This methodology is very sensitive to outliers and therefore the coefficients are easily biased. The outliers of the data that are used are very strong. In the fifth section the plots of the variables of interest will be shown to make the reader aware of the magnitude. The outliers were not exclud-ed because even though they are apparent outliers they belong to this population.
Secondly, there is probably the issue of multicollinearity, but so far there are neither reliable methods to detect certain multicollinearity nor methods to handle the problem (Gujarati, 2004). The multicollinearity was discussed in more detail in section 4.5 and 6.1.
The results of the coefficients will also be biased due to the selection of the data set if one con-siders the set of the sample not to be a population but a subsample and the unknown history of
6 Results
Initially the dependent variable was a growth rate of the turnover but one could expect too high correlation of the growth rate of the company measured by employees and the growth rate of the turnover which would have lead to more problems of multicollinearity. In order to avoid that bi-as the absolute turnover of a company in 2005 wbi-as chosen to be the dependent variable. Moreo-ver, (as already mentioned) two different regressions were run because of the high correlation of ‘DiffMoreThan3’ and ‘OwnerMoreThan3’.
6.1 Summarized results
The results of the linear regressions are summarized in the following table (table 4). The table shows the estimated coefficients for both regressions and their p-values.
Table 4 – Overview of regression results
1st Regression Prob > F = 0.000 R-squared = 0.4872 2nd Regression Prob > F = 0.000 R-squared = 0.4871
Turnover2005 1st Reg. Coef. p-value 2ndCoef. Reg. p-value
Constant -11139.70 0.067 -11226.71 0.066 Independent PercSameSec 0.47 0.954 0.42 0.959 OwnerMoreThan3 341.00 0.270 DiffMoreThan3 -335.05 0.322 InitialSize 1778.30 0.000 1777.60 0.000 GrowthSize 6539.63 0.000 6540.18 0.000 Control Variables PercSex 2.29 0.851 2.30 0.850 PercForeign 21.31 0.277 21.59 0.270 Productiveness -3.94 0.855 -4.03 0.852 RegDiffProxy 202.22 0.433 211.17 0.412 SectorDum1 2802.51 0.246 2735.56 0.256 SectorDum2 6002.45 0.376 5931.06 0.381 SectorDum3 4161.71 0.064 4096.78 0.068 SectorDum4 936.45 0.649 865.32 0.674 SectorDum5 6571.23 0.067 6490.58 0.071 SectorDum6 6502.18 0.000 6427.51 0.000 SectorDum7 510.45 0.800 429.78 0.831 SectorDum8 2278.74 0.184 2300.26 0.180 SectorDum9 -309.27 0.906 -358.76 0.891 Table 5
In general one can say that the models do not fit the data well. A problem of the fit of the models could be the multicollinearity discussed above. As one looks at the plots (section 6.1 and 6.2) it is hard to see any informative patterns and besides the low there are only three significant pa-rameters in this regression (on the 5%-level). The F-test indicates that the independent variables taken together statistical significantly explain the dependent variable.
The bad fit of the model was already expected from the descriptive data and the plots. The de-scriptive of the data set showed that the data is mostly widely spread and one could guess that
there will be problems due to skewed data. The plots depicted the same conclusions that the es-timation will very likely not contain significant results from that one could draw reliable conclu-sions.
6.2 Interpretation of results
PercSameSec. The variable ‘PercSameSec’ is for both regressions at a similar level statistically
insig-nificant. The interpretation would be that if the percentage of owners that worked five years be-fore the startup in the same sector was one percent point higher than the percentage of another company (all other values are the same, ceteris paribus) the own business’ turnover would be 420 Swedish crowns higher (times 1000) (or for the 2nd regression 470 SEK) than that from the other
firm. In other words there is little impact (even if it was significant) on the turnover eight years after the startup if the owners tend to have experience of the sector they started their business in.
OwnerMoreThan3. In the first regression including ‘OwnerMoreThan3’ there is no statistical
evi-dence that the growth of percentage of higher educated owners has an impact on the later turno-ver. If the value was statistically significant and the growth of the percentage of owners that have more than three years of higher education was one unit more than a similar company (all other values are the same) the turnover eight years later would be 341,000 Swedish crowns higher than for the comparing company. So, the impact of higher education in the leadership has a high im-pact on the later turnover for this population. The insignificance however, might be due to that common sense is more important than actual academic education. Another explanation could be that one can employ people with regarding knowledge and that it does not make a difference if the owner or an employee has the knowledge.
DiffMoreThan3. For the second regression including ‘DiffMoreThan3’ there is no statistical
evi-dence, either. If the difference of the percentage of higher education of the whole labor force was one percent point higher (than to a similar company) the turnover eight years later would be 335,050 Swedish crowns lower. This coefficient is insignificant, however. More intuitively one could say that for this population the turnover in later years is negatively affected by the growth of human capital in the company which might indicate that a new venture with an initial low amount of human capital is less competitive and therefore its later turnover is negatively affected.
InitialSize. A high and statistically significant impact on the turnover in year 2005 comes from the
two ‘size’-concepts. On the 0%-level the turnover of 2005 can be increased by about 1,778,000 Swedish crowns if the new venture starts with one additional employee. This is true for both re-gressions of this population.
GrowthSize. If the company manages to grow in terms of percentage of employees by one
addi-tional percent point it can generate a turnover eight years later that is about 6,540,000 Swedish Crowns higher than without an additional employee. Again the results are very close to each oth-er for both regressions.
To sum up for the variables of interest it seems that for Swedish startup companies the issue of size is more important in values of the coefficients and in significance than the concepts of hu-man capital. Moreover, for the conclusions that can be drawn from the regression results about the hypotheses of the thesis are that the first three hypotheses regarding human capital are not found to be confirmed due to its statistical insignificance. The hypotheses on initial size however are confirmed. But again keeping the descriptive and the plots in mind one has to be careful judg-ing the results.
PercSex. The percentage of female owners in the first year is meriting for the performance of the
PercForeign. The nationality influences the turnover rate in that way that a foreign origin improves
the success of a company what might be due to better knowledge of language and culture of an-other country the company is making business with. The percentage of foreign owners in a com-pany increases the turnover rate by 21,000 Swedish crowns if a comcom-pany has one percent point more foreigners in the ownership. This value is not very reliable as forecasting measure, though, due to its low t-value.
Productiveness. In this estimation is the coefficient for productiveness negative. It does not make
sense to have a lower turnover while the performance of a firm increases. The impact is quite low, though, and this value is again insignificant.
RegDiffProxy. As to be expected has it a positive effect on a new venture if it is close to market.
This was measured by the proxy for market potential. Even though the value is not statistically significant for this population the turnover is higher the higher the new venture was startup close to a market.
SectorDum. The sector dummies differ from -358.76 to 6571.23 for the impacts on the turnover.
The only significant impact comes from sector dummy six (‘Wholesale and Retail Trade; Repair of Motor Vehicles, Motorcycles and Personal and Household Goods; Hotels and Restaurants’) which might be due to that this sector is highly over represented in the population. 38% of the companies in this population are within sector six. If one can assume the scale of economies to vary not too much within one group of sectors (separated by the sector dummies) and scale economies matter when starting up a business one would expect the dummies to be statistically significant. Here they are not significant which might imply wrong grouping of industries or sub industries or that the scale of economies are actually not important for Swedish businesses started in 1997.
It seems that the experience acquired in previous jobs within the same field of the new start up is not decisive for the later success which implies that prospective entrepreneurs of varies education will have equal chances starting a new business independent of the sector. When starting a com-pany the entrepreneur might want to consider however, the additional human capital that the company should gain over the upcoming years in order to ensure the overall qualitative perfor-mance of the company. At the same time during the process of learning and standardizing the production process it should be considered to decrease the number of highly educated employees and replace them by non-academically educated workers in order to be more profitable.
To ensure high later turnover the owners of a prospective startup should employ as many em-ployees as possible under their restrictions and keep a high level of additional employments in order to stay competitive within their sector.
7 Conclusions
The similarities in the results of the two different regressions run on the data including ‘OwnerMoreThan3’ and ‘DiffMoreThan3’ and their high collinearity indicate that the decision was right to run two separate regressions.
The hypotheses stated as having experience in line with the own business, fast growth of highly educated owners and fast growth of highly educated workers of the whole labor force cannot be con-firmed if one judges them by their statistic significance. The results of the three concepts of hu-man capital differ a lot in quantity. Knowledge in line with the business and higher education of the owners lead to a higher turnover rate in later years. The growth of human capital in the labor force however, has a negative impact on the later turnover rate. The results have to be handled carefully though, because of the skewness, multicollinearity and the little informative distribution of the data as one can also see in the low significance of the values. If one judges the population of this thesis though, by the quantitative outcome of the estimation one can say that at least the first two hypotheses on human capital are true. It makes a difference if owners have experience in line with their new venture and if they have at least three years of higher education. The nega-tive impact of the growth of human capital of the whole labor force could be explained by that common sense is more important than actual academic education or it could be that there is no difference if the owner has the knowledge itself or that a company can employ people with re-garding knowledge.
The citation of Cooper, Woo and Dunkelberg (1989) from the introduction seems to be proven correct. The impacts of size-related variables are very strong and statistically significant where the impact of the growth rate is 3.5 times higher than initial size. This confirms the hypotheses of this thesis which were stated as that large initial size has a positive impact on later turnover and the faster a company grows the higher is its later turnover. These results are in line with previous literature on survival. If one believes in the results despite the weaknesses of the estimations size in terms of initial size and growth rate is not only decisive for survival of a firm but also for the later turnover of businesses.
Apart from the decision owners can easily implement there are governmental constraints that owners might face. The government could support entrepreneurs in improving infrastructure and the attractiveness of living close to the company in order to provide a higher willingness of po-tential employees to move closer to the company and therefore helping the company to expand. It seems that for Swedish startup companies the size and growth are more important than the human capital. This could be an indication that in Sweden education or experience in line with their newly startup business are not as important for success as maybe willingness to work hard, common sense and a basic intelligence. To be able to make confident statements like this one would have to do more research regarding the importance of academic education in entrepre-neurship in Sweden, though. Therefore, I would recommend for further studies to control for special role of Sweden. Moreover, there should be a comparison between startup companies with different years of foundation and more countries should be included to check for similarities and uniqueness for specific countries or years.
To get the whole picture of the success of new ventures that started up in 1997 it could be inter-esting to see how the results change if one would control for companies that dropped out within the eight years the regression is run on. Another meriting feature could be to compare ventures of different starting years and their performance over a set span of time.
References
Agarwal, R., & Audretsch, D. B. (2001), Does entry size matter? The impact of the life cycle and technology on firm survival. The Journal of Industrial Economics, 49(1), 21-43.
Amendola, M. & Bruno, S. (1990), The Behaviour of the Innovative Firm: Relations to the Envi ronment. Research Policy, 19(5), 419–33.
Arrighetti, A. (1994), Entry, Growth and Survival of Manufacturing Firms. Small Business Eco
nomics, 6(2), Special Issue on Birth and Start-Up of New Firms: Empirical Evidence, 127-137.
Audretsch, D. B. (1995), Innovation, growth and survival. International Journal of Industrial Or gani
zation, 13, 441-457.
Audretsch, D. B. & Mahmood, T. (1994), The Rate of Hazard Confronting New Firms and Plants in U.S. Manufacturing. Review of Industrial Organization, 9, 41–56.
Audretsch,D. B., Santarelli, E., & Vivarelli, M. (1999), Start-up size and industrial dynamics: some evidence from Italian manufacturing. International Journal of Industrial Organization,
17, 965–983.
Bates, T. (1995), Self-employment across industry groups. Journal of Business Venturing, 10, 143-156.
Baum, J. A. C. (1996). Organizational ecology. In S. Clegg, C. Hardy & W. Nord (Eds.), Handbook
of Organization Studies (p. 77–114). Sage.
Becker, G.S. (1964), Human Capital. Columbia University Press, New York.
Berman, E., Bound, J. & Griliches, Z. (1994), Changes in the Demand for Skilled Labor within US Manufacturing: Evidence from the Annual Survey of Manufacturers. Quarterly Journal
of Economics, 109(2), 367–97.
Boden, R. J., & Nucci, A. R. (2000), On the survival prospects of men`s and women`s new busi ness ventures. Journal of Business Venturing, 15, 347-362.
Bosma, N., van Praag, M., Thurik, R. & de Wit, G. (2004), The Value of Human and Social Capital Investments for the Business Performance of Startups. Small Business Economics, 23, 227–236.
Cassar, G. (2004), The financing of business start-ups. Journal of Business Venturing, 19, 261-283. Cefis, E., & Marsili, O. (2005), A matter of life and death: innovation and firm survival. In
dus-trial and Corporate Change, 14(6), 1167-1192.
Colombo, Delmastro and Grilli, (2004), Entrepreneurs’ human capital and the start-up size of new technology-based firms. International Journal of Industrial Organization, 22, 1183-1211. Colombo, M. G., & Grilli, L. (2005a), Founders’ human capital and the growth of new
Colombo, M. G., & Grilli, L. (2005b), Start-up size: The role of external financing. Economics
Letters, 88, 243-250.
Cooper, A. C., Woo, C. Y., & Dunkelberg, W. C. (1989), Entrepreneurship and the initial size of firms. Journal of Business Venturing, 4 (5), 317-322.
Cressy, R. (1996), Are Business Startups Debt-Rationed?. The Economic Journal, 106(438), 1253-1270.
Davidsson, P., & Honig, B. (2003), The role of social and human capital among nascent entre-preneurs. Journal of Business Venturing, 18, 301–331.
Esteve-Pérez, S. & Mañez-Castillejo, J. A. (2008), The Resource-Based Theory of the Firm and Firm Survival. Small Business Economics, 30, 231–249.
Gibrat, R. (1932), Les inégalités économiques, Paris (1932)
Gimmon, E. & Levie, J. (2010), Founder’s human capital, external investment, and the survival of new high-technology ventures. Research Policy, 39, 1214–1226.
Gujarati, D. N. (2004), Basic Econometrics (4th ed.). New York: Mcgraw-Hill.
Hamilton, B. H. (2000), Does Entrepreneurship Pay? An Empirical Analysis of the Returns to Self Employment. Journal of Political Economy, 108(3), 604 – 631.
Jo, H., & Lee,J. (1996), The relationship between an entrepreneur’s background and per for mance in a new venture. Technovation, 16(4), 161-171.
Jovanovic, B. (1982), Selection and the Evolution of Industry. Econometrica, 50(3), 649-670. Lynskey, M. J. (2004), Determinants of Innovative Activity in Japanese Technology-based
Start-up Firms. International Small Business Journal, 22(2), 159-196.
Mata, J., & Portugal,P. (1994), Life Duration of New Firms. The Journal of Industrial Economics,
42(3), 227-245.
Mata, J. & Portugal, P. (2002), The Survival of New Domestic and Foreign-Owned. Strategic Management
Journal, 23(4), 323 – 343.
Mata, J., Portugal, P. & Guimarães, P. (1995), The survival of new plants: Start-up conditions and post-entry evolution. International Journal of Industrial Organization, 13, 459 – 481.
Åstebro, T. & Bernhardt, I. (1999), The winner’s curse of human capital. Working Paper CES 99-5, Center forEconomic Studies, U.S. Department of Commerce.
Åstebro, T. & Bernhardt, I. (2003), Start-up financing, owner characteristics, and survival.