VTI notat 19A-2012 Published 2012
www.vti.se/publications
Performance assessment of road equipment
State of the art
Preface
This study has been carried out within Asset Service Condition Assessment Methodology
(ASCAM), which is a project initiated by ERA-NET ROAD.
Project coordinator was Nederlandse Organisatie voor Toegepast Natuurweten-schappelijk Onderzoek (TNO), where Jos Wessels, Wim Courage, Willy Peelen, Ton Vrouwenvelder and Elja Huibregtse were the key persons. Many thanks to all of you for good advice!
Linköping March 2012
Quality review
Internal peer review was performed on 11 April 2012 by Jan Andersson. Sven-Olof Lundkvist has made alterations to the final manuscript of the report. The research director of the project manager, Jan Andersson, examined and approved the report for publication on 12 April 2012.
Kvalitetsgranskning
Intern peer review har genomförts den 11 april 2012 av Jan Andersson. Sven-Olof Lundkvist har genomfört justeringar av slutligt rapportmanus. Projektledarens närmaste chef, Jan Andersson, har därefter granskat och godkänt publikationen för publicering den 12 april 2012.
Table of contents
Summary ... 5
Sammanfattning ... 7
1 Introduction ... 9
1.1 General Introduction to the ASCAM reports ... 9
1.2 Background ... 11
2 Road equipment in general ... 12
2.1 Road markings ... 12
2.2 Road studs ... 13
2.3 Post delineators ... 13
2.4 Fixed signs ... 13
2.5 Variable message signs (VMS) ... 14
2.6 Road lighting ... 15
3 Questionnaire ... 16
4 Acceptable end user service level ... 17
4.1 Road markings ... 17
4.2 Road studs ... 17
4.3 Delineator posts ... 17
4.4 Fixed signs ... 17
4.5 Variable message signs ... 18
4.6 Road lighting ... 18
5 Deterioration over time and maintenance measures ... 19
6 Monitoring methods ... 20
6.1 Road markings ... 20
6.2 Road studs ... 20
6.3 Delineator posts ... 21
6.4 Fixed signs ... 21
6.5 Variable message signs ... 21
6.6 Road lighting ... 21
7 Inspection intervals and condition assessment ... 22
7.1 Road markings ... 22
7.2 Road studs ... 22
7.3 Delineator posts ... 22
The delineator posts are checked irregularly. At least in the Nordic countries visual inspection is taken place in springtime in order to register damages from ploughs during the winter. In Croatia and Denmark the posts are checked in connection with other equipment, in Croatia as often as every day on major roads. ... 22
7.4 Fixed signs ... 22
7.5 Variable message signs ... 22
7.6 Road lighting ... 22
8 Data handling ... 23
9 Maintenance costs ... 24 10 Summary of findings ... 25 References ... 27
Performance assessment of road equipment – State of the art
by Sven-Olof Lundkvist
VTI (Swedish National Road and Transport Research Institute) SE-581 95 Linköping Sweden
Summary
In order to maintain the performance of road equipment, it is important to take correct action at correct time. This means that repair or renewal of the equipment in question must be carried out when the performance has reached the lowest acceptable end user service level (EUSL). The time of this occurrence should be based on a management model or a condition assessment, which involves physical measurement and/or visual inspection.
This report shows the state of the art regarding condition assessment of road equipment. It deals with monitoring methods, maintenance measures and acceptable end user service levels in seven European countries: Belgium, Croatia, Denmark, Germany, the Netherlands, Sweden and UK. The work has been limited to the more important types of road equipment: road markings, road studs, delineator posts, fixed signs, variable message signs (VMS) and road lighting.
In order to get information on the subjects mentioned above a questionnaire was sent to several European countries. This questionnaire mainly dealt with condition assessment, maintenance routines, end user service level, monitoring methods and data-handling. The responds gave the following information:
There is a lack of physical measurement methods aimed for condition assessment. Generally, a condition assessment of road equipment will involve a large number of measurements and therefore the monitoring method must be quick and simple to use. In practice, this means that the monitoring method should be mobile, i.e. measurement is carried out at speed.
Only regarding road markings mobile instruments are available and such instruments are used in many European countries. At least in Germany and Sweden condition assessment is carried out yearly. In Sweden a road marking management system, comparable to PMS for road surfaces, was introduced 2011. In other countries the instruments are used for traditional checks of road marking performance.
Two other instruments which may be used for condition assessment are under develop-ment: one for measurement of luminance and illuminance in road lighting and one aimed for measurement of retroreflectivity of road signs.
Furthermore, there are some hand-held instruments which could be used to register road equipment performance, at least in limited condition assessments. These instruments measure skid-resistance and daylight luminance coefficient of road markings,
retroreflectivity and colour of fixed signs and illuminance of road lighting. Other types of equipment can in practice be inspected visually, only. However, even data from such inspections can be stored and used for assessment of future maintenance.
The number in the regulations on the lowest acceptable end user service level is in many cases limited by economy and what the manufacturer can achieve. However, the
requirements for road marking visibility and road sign legibility are based on research: For safe night-time driving a road marking must be visible approximately at a distance of 50 metres at 90 km/h. A road sign should be legible during at least 2.3 seconds. The conclusion from this survey is that, unfortunately, condition assessment of road equipment is rare. This fact is to a large extent due to the lack of suitable instruments. However, in the future, if new mobile instruments are developed, such assessments may be valuable tools for deciding when and where maintenance is needed.
Tillståndsbeskrivning av vägutrustning – lägesrapport
av Sven-Olof Lundkvist VTI
581 95 Linköping
Sammanfattning
För att upprätthålla funktionen hos vägutrustning är det viktigt att vidta korrekta under-hållsåtgärder vid rätt tidpunkt. Detta innebär att reparation, förnyelse eller utbyte av utrustningen måste ske då funktionen har nått den, från trafikantens synpunkt sett, lägsta accepterade nivån. Tidpunkten då denna nivå nås kan prediceras med ett s.k. manage-mentsystem eller med en tillståndsbeskrivning som innebär fysikalisk mätning eller visuell inspektion.
Föreliggande rapport visar dagsläget för tillståndsbeskrivning av vägutrustning. Den behandlar mätmetoder, underhållsåtgärder och den lägsta acceptabla funktionsnivån i sju länder: Belgien, Kroatien, Danmark, Tyskland, Nederländerna, Sverige och
Storbritannien. Arbetet har begränsats till sex viktiga typer av vägutrustning: vägmarke-ringar, vägbanereflektorer, kantstolpar, fasta vägmärken, omställbara vägmärken (VMS) och vägbelysning.
För informationsinhämtning sändes ett frågeformulär ut till flera länder. Detta formulär behandlade främst tillståndsbeskrivningar, underhållsrutiner, lägsta acceptabla
funktionsnivåer, mätmetoder och dataanvändning. Svaren som inkom gav följande: Mätmetoder som passar för tillståndsmätningar är fåtaliga. En tillståndsmätning omfat-tar vanligen ett stort antal enskilda mätningar, varför det är viktigt att instrumentet mäter snabbt och enkelt. I praktiken innebär detta att mätningarna ska kunna utföras mobilt, dvs. i den övriga trafikens hastighet.
Den enda vägutrustning som det finns utvecklat mobila instrument för är vägmarke-ringar och dessa instrument används i flera europeiska länder. Åtminstone i Tyskland och Sverige används dessa för att utföra tillståndsmätningar varje år. I Sverige har dessutom påbörjats datainsamling för ett managementsystem för vägmarkering, jämför-bart för PMS för vägbeläggningar. I andra länder används de mobila instrumenten för mer traditionella funktionskontroller av vägmarkeringar.
Ytterligare två mobila instrument som skulle kunna vara användbara för tillstånds-mätningar av vägutrustning är under utveckling. Det ena av dessa avses kunna mäta luminans och belysningsstyrka i vägbelysning och det andra vägmärkens retroreflexion. På marknaden finns även handhållna instrument som kan användas, åtminstone i
begränsade tillståndsmätningar. Dessa mäter vägmarkeringars vithet och friktion, vägmärkens retroreflexion och färg samt belysningsstyrka i vägbelysning. Andra typer av vägutrustning kan i praktiken endast inspekteras visuellt, men även data från sådana inspektioner kan lagras för att användas för bedömning av kommande underhållsåt-gärder.
ringar och vägmärken är de emellertid i flera länder baserade på fakta: För säker mörkerkörning ska en vägmarkering kunna ses på åtminstone 50 meters avstånd i hastigheten 90 km/tim och ett vägmärke ska kunna läsas under minst 2–3 sekunder. Slutsatsen från denna studie är att tillståndsmätningar är sällsynta, vilket beror på avsaknaden av lämpliga instrument. Emellertid, om nya mobila instrument utvecklas framöver kommer tillståndsmätningar att kunna bli ett användbart verktyg för att avgöra när och var underhållsåtgärder ska sättas in.
1 Introduction
This introduction is split in a general introduction equal for all reports and a specific one for each specific report.
1.1
General introduction to the ASCAM reports
The aim of the ERANET ROAD program “Effective asset management meeting future challenges” is to improve the management of the European road network; resulting in an improvement of the performance of the network. One of the topics within this program is the development of a framework for optimized asset management [ref: Effective asset management meeting future challenges, Description of Research Needs (DoRN), version 3.3, January 2010].
Maintenance managers on all levels are faced with the same dilemma. On the one hand they are given “end-user services levels” (objectives like reliability of traffic time, traffic safety, sustainable maintenance program) on the other hand they have their assets, the asset condition and a (dynamic) portfolio of measures which can be taken to ascertain the “end-user service levels”. The dilemma arises through the need for an optimal trade-off between budget available and budget needed for ascertaining the service levels.
ASCAM focuses on a framework for optimized asset management. ASCAM will relate asset condition prediction to measures and network value (end user service levels). It will create a framework to connect existing asset management practices into a holistic, integrated cross asset, pro-active approach. It will relate technical to societal issues, like pavement degradation or failures in the “dynamic traffic management systems” to end-user service levels such as efficient traffic flow, safety, reliability of travel time, noise hindrance or environmental issues. It will link micro, meso and macro levels in asset management and the aims and objectives on the different levels, linking existing
knowledge, tools and practices. The framework will enable policy makers, maintenance managers and their specialist to communicate on different levels and to overcome the boundaries between fields of knowledge.
In this study a proof of concept of the framework is developed in which existing knowledge, tools and practices are implemented and linked to end user service levels. The following approach was followed within this project in order to develop and deliver the proof-of-concept of this framework. Five work packages were established. In one (WP5) all management and dissemination activities were performed. In three of the remaining four work packages (WP2, 3 and 4) an inventory of existing asset
management practices in the EU was made, divided over asset management type; pavement, structures and road equipment. The results were intended and used in the last work packages (WP1) for assessing the feasibility and appropriateness of the framework which was developed in this work package. Also in work package 1 a proof-of-concept in the form of a numerical implementation was made. With this demonstrator the effects and possibilities of applying the framework on asset management was demonstrated. The project lay out is given in the figure below.
Reports
The work done is reported in 5 reports, a power point presentation and demonstrator with a user guide. The 5 reports are:
• Framework principles
• Inventory Pavement Management practices • Inventory Bridge Management practices
• Inventory Road Equipment Management practices • End report ASCAM
The inventories performed in work packages 2, 3 and 4 will deliver a representative view on the asset management in Europe including it’s diversity over the different countries. Such an inventory is efficient and effective for assessing the feasibility and appropriateness of the framework and to deliver the proof-of-concept. They are not intended and do not deliver a full comprehensive inventory of these asset management systems. Therefore it is possible that NRA’s will miss certain information or systems. The terminology used in asset management is not consistent over Europe. This is due to the diversity in e.g., approach, level of implementation, etc. In our reports no attempt is made to identify these discrepancies. This was by no means the purpose of this project. However this necessarily compromises the readability of these reports.
In the reports of WP2, 3 and 4 an attempt was made to develop the existing asset managements system a step further towards the framework principles, by developing relations between asset conditions and EUSL. This is an innovative more creative step, which asked for temporarily abandoning conventional definitions of sometimes well established concepts as for instance safety.
1.2 Background
In order to maintain the performance of road equipment, it is important to take correct action at correct time. This means that repair or renewal of the equipment in question must be carried out when the performance has reached the lowest acceptable end user service level (EUSL). The time of this occurrence should be based on condition assess-ment, which involves physical measurement and/or visual inspection.
This report shows the state of the art regarding condition assessment of road equipment. It deals with monitoring methods, maintenance measures and acceptable end user service levels in seven European countries: Belgium, Croatia, Denmark, Germany, the Netherlands, Sweden and UK. The work has been limited to the more important types of road equipment: road markings, road studs, delineator posts, fixed signs, variable message signs (VMS) and road lighting.
2 Road
equipment
in
general
Simply speaking, road equipment is everything on, or close to the road, which is not asphalt or concrete. Important types of road equipment are traffic lights, road markings, stationary road lighting, signs and rails. Other types are road studs, post delineators, variable message signs (VMS), bollards and game fences. Common for all road
equipment is that it is aimed for, at least to some degree, improvement of accessibility, comfort and traffic safety.
This survey deals with condition check and assessment of six types of road equipment, namely road markings, road studs, post delineators, fixed signs, VMS and road lighting. As most equipment should improve visibility in one or another way, a check or assess-ment generally involves a parameter which describes visibility. The six types of road equipment are discussed below in Sections 2.1–2.6.
2.1 Road
markings
Road markings are applied primarily for visual guidance and leading the vehicles correctly, e.g. in crossings. Therefore, road markings are important for accessibility and comfort. However, the role they play for traffic safety is not clear. On one hand, the number of accidents probably will be reduced by improving the visual guidance. On the other hand, better visual guidance will increase speed [1], which means that a possible accident will be more severe. In fact, only few studies have been able to prove a relationship between traffic safety and the use of road markings, which has been documented by Elvik [2]. Figure 1 shows how road markings may appear in Sweden.
Figure 1 Brand new road markings (left) and road markings showing damage from the plough (right).
The visibility of road markings in night-time traffic (headlight illumination) is quanti-fied by the retroreflectivity and in daylight by the luminance coefficient, both parame-ters having the unit [cd/m2/lx]. The time between maintenance measures is approxi-mately constant for a certain type of road marking on a certain road.
2.2 Road
studs
For improvement of visual guidance on short to medium distances at night, road studs may be used. Generally, they are applied as a complement to longitudinal road markings and especially in darkness when it is raining they improve the drivers’ visual conditions. The performance of a road stud is quantified by its CIL-value, which is the product of the retroreflectivity and the apparent area. Thus, the unit of the CIL-value is [cd/lx].
2.3 Post
delineators
The aim using post delineators is to improve the long distance visual guidance in night-time traffic. This means that they improve accessibility and comfort, but probably not traffic safety. In fact at least one study, by Kallberg, has shown on increased average speed, resulting in a significant increase of fatal accidents [3].
The performance of a post delineator is described by the CIL-value of the retroreflector mounted on the post. The CIL-value is the retroreflectivity times the area of this retro-reflector and has the unit [cd/lx]. The life-time of a post-delineator is approximately exponentially distributed, which means that maintenance follows the Gamma-process and should be related to the traffic density.
2.4 Fixed
signs
Contrary to other road equipment, fixed signs are almost a “must”. Without signs it would be almost impossible to know which regulations there are, or to find the way. Road signs are used for guiding, regulating and warning the drivers and should be important for accessibility, comfort and safety. A precondition for this is that it is conspicuous and can be detected and read at relevant distances.
The performance of the road sign in daylight is given by its position, size and colour: A position in the line of sight gives good conspicuity; a large sign gives good detectability and correct colours imply good legibility. In darkness on roads without public lighting, also the retroreflectivity of the sheeting is important, at least for detectability and
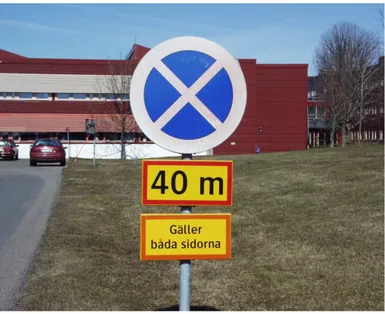
legibility. The colour of the sign sheeting is described using CIE 1931 tristimulus colour coordinates [4], x, y and z, whilst the retroreflectivity is measured in the unit [cd/m2/lx]. The life-time of a fixed sign is approximately exponentially distributed, which means that maintenance follows the Gamma-process and should be related to the traffic density, and, at least in Southern Europe to the orientation of the sign: the red colour of the sign will fade within shorter time if the sign is orientated toward south. Figure 2 shows a road marking which once upon a time had a red border.
Figure 2 “No waiting” sign whereupon the red border has faded.
2.5
Variable message signs (VMS)
An important purpose of using VMS is to give the drivers a message which is relevant for the present driving condition, e.g. slow down when it is slippery. Furthermore, VMS can be used to enhance a fixed sign, e.g. close to a school when the children are on move.
Beside the size of the sign, the detectability and legibility are given by the luminance of the pixels which the symbol is made up of. This luminance is given in the unit [cd/m2]. Furthermore, to ensure good legibility in all light conditions, like opposing sun, the luminance ratio between symbol and background is important. This ratio is the quotient between two luminance values, and consequently, has no unit. Finally, as for fixed signs the symbol must have a correct colour, which is given by the tristimulus colour coordi-nates.
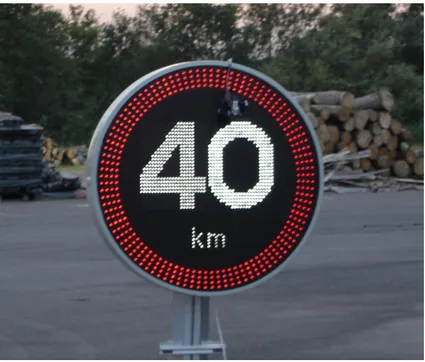
Figure 3 A Danish VMS showing the speed limit.
2.6 Road
lighting
Several studies [2] have shown a large positive influence on traffic safety at night when road lighting is introduced. Furthermore road lighting should have a positive effect on accessibility, comfort and, also, security for pedestrians.
Generally, the performance of road lighting is described by the average luminance and the luminance uniformity of the road surface. However, on minor streets and cycle paths more often the average illuminance at the ground is used. The unit of luminance and illuminance are [cd/m2] and [lx], respectively, while the luminance uniformity has no unit. The time to maintenance, i.e. reconditioning of the light installation, will probably follow the gamma process.
3 Questionnaire
In order to increase the knowledge of condition assessment methods and maintenance strategies used in Europe, a questionnaire was developed and sent to several road authorities. The questionnaire mainly dealt with monitoring methods, time between inspections and maintenance measures. Furthermore, there were some questions on data handling, key-performance indicators and the end user service levels which are
accepted.
Answers on the questionnaire came from six countries. Of course, one can speculate in why the number of answers was low: Probably condition assessments of road equip-ment are infrequent due to lack of usable instruequip-ments. Moreover, the questionnaire dealt with six different types of equipment, which means that in the worst case six different people would answer. This fact may explain why there were no answers on some types of equipment from some countries.
4
Acceptable end user service level
4.1 Road
markings
Research has shown that in headlight illumination, the pre-view-time of the longitudinal road markings must be at least 2 seconds [1], which is comparable to a visibility
distance of 50 metres at 90 km/h (25 m/s). Otherwise there is a big risk that the driver cannot keep the vehicle on the road in the next curve. Roughly, a retroreflectivity of 100–150 mcd/m2/lx gives the desired visibility distance, and most countries use 100 or 150 mcd/m2/lx as the minimum level for dry road marking retroreflectivity. However, in Germany new road markings must fulfil the requirement 200 mcd/m2/lx.
Regarding wet road markings, it is almost impossible to reach levels higher than 100 mcd/m2/lx. In this case the regulation has been adjusted to what the producers can achieve, which means that most countries use a value between 25 and 50 mcd/m2/lx as the minimum level.
Generally, the daylight luminance coefficient is not critical as a typical road surface may have a value about 50–70 mcd/m2/lx and a road marking more than 120 mcd/m2/lx. This means that generally there is sufficient contrast between road marking and surface to make the marking visible in daylight or in public lighting. Only on concrete surfaces there might be problems as those pavements can have values higher than
100 mcd/m2/lx. Most countries use the 130 mcd/m2/lx as the lowest acceptable EUSL. One exception is Sweden, which uses 160 mcd/m2/lx.
4.2 Road
studs
Road studs are used for improvement of night-time visibility on distances in the range 100–300 metres. The big advantage using road studs is that their performance is almost as good in rain as in dry weather. This is an important fact, as the road marking
performance is poor during those weather conditions. However, it must be stressed that the road studs never can be a substitute for road markings, but a complement only: the road studs cannot be seen by peripheral vision and do not help the driver to place the vehicle correctly within the driving lane.
As the apparent area of a road stud is small, the visibility follows Ricco’s law. This means that the visibility in vehicle headlights is proportional to the retroreflectivity [mcd/m2/lx] times the area [m2]. Consequently, a requirement should have the unit cd/lx – the CIL-value (Coefficient d’Intensité Lumineuse). One of few countries using a CIL requirement (220 mcd/lx) on road studs is the United Kingdom.
4.3 Delineator
posts
Like road studs, delineator posts are used to increase night-time visual guidance beyond the visibility of road markings. Most countries have not put a figure on the lowest acceptable end-user service level. However, in Sweden the CIL-requirement is
1100 mcd/lx, which corresponds to a visibility distance of approximately 300 metres in dipped headlight illumination [5].
wise the sign has no legal significance. Consequently, the sheeting of the sign must achieve a certain retroreflectivity (dependent of colour) and colours must be within the limits of the CIE 1931 standard [4]. As the retroreflectivity of the sheeting may be difficult to measure, some countries have put a figure on the shortest acceptable legibil-ity distance. As an example, in Denmark the requirement says that the sign must be legible during at least 2.3 s, which corresponds to 75 metres at 120 km/h [6]. Other countries have stated that only highly retroreflective sheeting may be used on the sign.
4.5
Variable message signs
The performance of a VMS is given by the luminance of the LED’s and the background luminance. The luminance and contrast class of the VMS is specified in accordance with EN-12966 [7] at the time of purchase. However, in spite of practical measurement methods no country has a requirement on these parameters. A lowest acceptable end user service level should be the same as for fixed signs – 2.3 s.
4.6 Road
lighting
Most countries have a regulation of the luminance of the road surface, according to European Standard EN-13201 [8]. Typically, it may be 1–2 cd/m2 on motorways and somewhat lower on other major roads and streets. Furthermore, generally there is a requirement on the uniformity of the luminance, which means that the road surface luminance should be approximately equal all over the surface. On minor streets and cycle paths there is a requirement on the illuminance.
5 Deterioration
over
time
and maintenance measures
As mentioned earlier most types of road equipment should be detected and in some cases also read. This means that a retroreflective sheeting or prismatic retroreflector must have a certain retroreflectivity or that a LED or bulb must emit a defined quantity of light. The deterioration of the performance will be dependent on the road environ-ment, and regarding road markings and road studs also from traffic wear and ploughing. Even delineator posts can be damaged by heavy snow from the plough. This means that the deterioration curve may look different for different types of road equipment:
Road markings have three important performance parameters: retroreflectivity, daylight
luminance coefficient (whiteness) and skid resistance. A brand new marking has drop-on beads drop-on its surface which implies high retroreflectivity. However, the beads make the surface slippery, meaning low skid resistance. Furthermore, the beads make the surface grey. Consequently, the daylight luminance coefficient rises the first months after application. Later, also this parameter will drop, but not as fast as the
retro-reflectivity. Thus, the life-time of the road marking generally is given by the time when the retroreflectivity has reached its lowest acceptable end user service level. Mainte-nance of road markings implies renewing of the whole stretch or a part of it.
Road studs and delineator posts have a retroreflectivity which is almost constant over
time until they get damaged for some reason. Therefore, in most cases there is no reason to replace the stud or post until it is visually damaged. Change of the retroreflector only, is rare.
The sheeting of the fixed sign acts more or less as the retroreflector of the delineator post. This means that generally it has acceptable legibility until it must be changed for some other reason than wear from the road environment. However, the red colour of signs orientated towards south may fade due to UV radiation from the sun. This fact may affect the life length as the red border of the sign has a legal meaning. Generally, maintenance involves replacement of the sign. More seldom, only the sheeting is replaced.
The legibility of VMS may deteriorate as the LED:s lose light intensity and the plastic sheeting protecting the LED:s becomes scratched. Therefore, the legibility deterioration is expected to be almost linear if the sign is not damaged. The maintenance measure means replacement of the whole sign, burnt out LED:s or the sheeting.
The light intensity of road lighting may deteriorate almost linear due to dirt and rust on the reflector of the armature. When it has reached its lowest acceptable level it must be cleaned or replaced. The pole has a longer life-time than the armature, but yet it must be replaced sometime due to rust, mainly caused by dog’s urine.
6 Monitoring
methods
6.1 Road
markings
The retroreflectivity of road markings is difficult to judge by visual inspection. There-fore, it is necessary to use a valid physical method for quantifying the night-time performance. On the market, there are several instruments which measure the retro-reflectivity, hand-held or mobile. At least hand-held instruments are reliable, whilst the readings of the mobile instruments may be influenced by the movements of the
measurement vehicle. The accuracy and repeatability of hand-held and mobile instru-ments is well-documented by HITEC, USA, 2000: Evaluation of pavement marking
reflectometers and mobile instruments later by BRRC, Belgium, 2011: Draft report of the first round robin test for mobile reflectometers. Figure 4 shows an Ecodyn 30
measuring the edge line.
Figure 4 Ecodyn 30 measuring a broken edge line.
There are only two commercially available instruments for measurement of the daylight luminance coefficient. However, this parameter can be assessed visually with acceptable accuracy. Therefore, these instruments are used to small extent, only. There is an on-going development of a mobile instrument which can measure all parameters of interest simultaneously. However, this instrument is not yet on the market.
6.2 Road
studs
There is one hand-held instrument for measurement of road studs commercially available. This instrument is manufactured in USA and has not come to use in Europe. However, lately a mobile instrument, measuring the retroreflectivity of both road markings and road studs has been developed. This instrument provides an opportunity to check road studs in situ, which should make a CIL requirement more meaningful. In the present situation inspection of road markings means visual registration of damages
6.3 Delineator
posts
Delineator posts are checked by visual inspection. Damages and loss of post can be checked daytime, but the performance of the retroreflector must be checked night-time, in headlight illumination. In practice this means that this parameter never is checked or, at best, occasionally.
6.4 Fixed
signs
Generally, the performance of fixed signs is checked visually in order to find out the daytime legibility of the sign. However, there are some hand-held instruments on the market – both aimed for measurement of the colour and retroreflectivity of the sheeting. Therefore, it should be possible to get an objective reading of the road sign appearance in both daylight and darkness. The draw-back with these instruments is that the optical sensor must have physical contact with the sheeting, which means that the operator must reach the sign – often by use of a ladder. Thus, the hand-held methods are unpractical and used mainly for research purpose. One way to make a measurement at distance is the use of a spot-light, making a subjective measurement of the luminance. This method has been tested by Young in USA and found being valid: Alternative to
night-time visual inspection. Development of a new hand-held instrument is under its
way by DELTA Light and Optics in Denmark. This instrument measures at distance, i.e. the operator do not have to reach the sign.
6.5
Variable message signs
VMS are inspected visually or supervised automatically. This means that is only possible to register if the sign works. It should be possible to measure the luminance of the LED:s and the background, but this has been done for research purposes, only. In the Netherlands no inspections are carried out as a management tool has been
developed, see Chapter 6.
6.6 Road
lighting
Luminance is tricky to measure in situ which means that in practice this parameter is never measured. However, it should be possible to predict the luminance from the illuminance of the lighting installation and the brightness of the road surface. A mobile instrument which measures the two last-mentioned parameters is under development in Sweden and will hopefully be used in the future. Illuminance is easier, but not practical, to register and is never measured in practice. So far only visual inspections of lighting installations have been performed. Such inspection involves check of luminaries and poles.
7
Inspection intervals and condition assessment
7.1 Road
markings
Although there are physical measurement methods aimed for road marking perfor-mance, some countries judge the performance by visual inspection, only. Both Denmark and Belgium report that visual inspection takes place once every year. Physical
measurement using hand-held instruments is carried out occasionally, only. In other countries, like Croatia, Germany, UK and Sweden condition assessment of road
marking retroreflectivity is taken place every year using a mobile monitoring method. In Germany all relevant parameters (retroreflectivity in dry and wet condition, daylight luminance coefficient and skid resistance) is monitored twice every year, in spring and autumn.
7.2 Road
studs
Road studs are checked occasionally, only. In some countries, like Belgium and Croatia, this is done in connection with the visual inspection of the road markings. In Croatia some major roads are covered by a road patrol checking road equipment daily.
7.3 Delineator
posts
The delineator posts are checked irregularly. At least in the Nordic countries visual inspection is taken place in springtime in order to register damages from ploughs during the winter. In Croatia and Denmark the posts are checked in connection with other equipment, in Croatia as often as every day on major roads.
7.4 Fixed
signs
Fixed road signs are visually inspected in connection with check of delineator posts. However, in Croatia also physical measurement is carried out yearly using a hand-held instrument. In Germany, in order to make performance assessment easy, a schedule has been developed.
7.5
Variable message signs
In most countries VMS are checked visually, although some are supervised automati-cally. The interval between inspections is the same as for delineator posts and fixed signs. However, in Germany inspections are carried out twice every year by the manufacturer. This inspection involves not only performance, but also electrical and mechanical safety.
7.6 Road
lighting
Generally, road lighting is checked irregularly and time between visual inspections is dependent on type of street and luminaire. Belgium mentions every 3–6 years and this certainly applies to most countries. One exception is Croatia which declares that inspection takes place every day.
8 Data
handling
8.1 Road
markings
In Denmark, Germany and Sweden retroreflectivity data is stored for future assessment of road marking maintenance. A pre-study in Norway [12] indicated that a management system, comparable to PMS for road surfaces should be possible to develop. In Sweden, with start 2011, such a road marking management system (RMMS) is developed. Data will be stored together with pavement data and used for future prediction of the road marking performance.
8.2 Fixed
signs
Generally, fixed signs are registered when set up. In this file the type of sheeting, date of delivery and date of set up is registered. However, there is no management system and there is maybe no need for that. Yet, in Germany there is a technical bulletin for quality assurance of fixed signs, but it is optional to use it.
8.3
Variable message signs
In the Netherlands a web-based tool for judgement of maintenance of VMS has been developed. This tool can be seen as a management system which is based on expert’s best guess. Although there are no physical data in this data base, the expected life-length of different VMS can be estimated. Other countries have less experience from VMS and do not handle any data.
8.4
Delineator posts, road studs and road lighting
There are no physical data registered from delineator posts, road studs and road lighting. Consequently, there is no data to handle. However, in Denmark a checklist is filled in during the visual inspection of road lighting. This list is stored and used for assessment of future maintenance.
9 Maintenance
costs
The cost for maintenance of road equipment is almost impossible to estimate. It varies between countries, within the country and also from year to year. In Chapter 10, Table 2 some figures is given. However, these figures must be read very carefully as they represent an average of several guesses. Moreover, it is impossible to judge the quality of those guesses, so please take the figures with a large pinch of salt!
10
Summary of findings
Chapter 1–8 are summarized in Table 1 and Table 2, below.
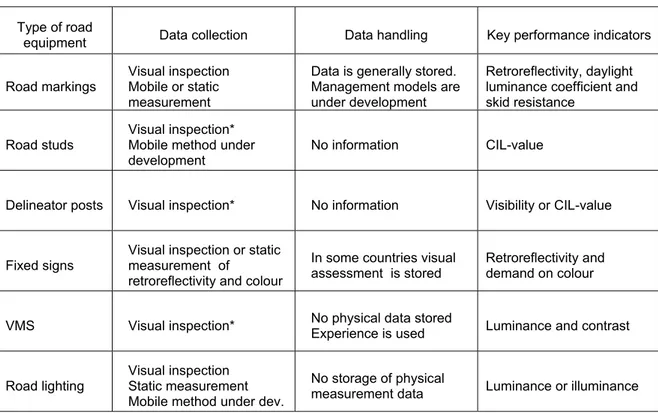
Table 1 Data collection, data handling and key performance indicators. Type of road
equipment Data collection Data handling Key performance indicators Road markings Visual inspection Mobile or static
measurement
Data is generally stored. Management models are under development
Retroreflectivity, daylight luminance coefficient and skid resistance
Road studs
Visual inspection* Mobile method under
development No information CIL-value
Delineator posts Visual inspection* No information Visibility or CIL-value
Fixed signs Visual inspection or static measurement of retroreflectivity and colour
In some countries visual assessment is stored
Retroreflectivity and demand on colour
VMS Visual inspection* No physical data stored Experience is used Luminance and contrast
Road lighting
Visual inspection Static measurement Mobile method under dev.
No storage of physical
measurement data Luminance or illuminance
Table 2 Maintenance measures, EUSL and costs. Type of road
equipment Maintenance measures EUSL Costs per km road and year* Road markings Renewal of part or whole object pre-view-time more than 2 s (50 m at 90 km/h) 1 000 €
Road studs
Replacement of the retroreflector or the whole stud
Visibility distance of at
least 100 m 30 € per stud Delineator posts Replacement of the post Visibility distance of at least 300 m 50 €
Fixed signs Replacement of the sign Legibility time of at least 2.3 s (60 m at 90 km/h) 700 € VMS Repair or replacement Legibility time of at least 2.3 s (60 m at 90 km/h) 14 000 €** Road lighting Replacement of armature and, more rarely, pole Road surface luminance of at least 1,0 cd/m2 *** 100 €
* The estimated costs are very rough.
** The cost is dependent of the number of signs per km road. This is an example from the
Netherlands.
References
[1] COST 331, Requirements for horizontal road markings, Final Report of the
Action, European Communities, Brussels, Belgium, 1999.
[2] Elvik, R., The Handbook of Road Safety Measures, Transportøkonomisk
Institutt, Oslo, Norway, 2004.
[3] Kallberg, V-P., Reflector posts – signs of danger?, Transport Research
Record No. 1403, Washington, D.C., USA, 1993.
[4] CIE, Commission internationale de l'Eclairage proceedings, 1931, Cambridge University Press, Cambridge, UK, 1932.
[5] Helmers, G., Lundkvist, S-O., Visibility distances to retroreflectors in
opposing situations between two motor vehicles at night, VTI Report 323A,
Linköping, Sweden, 1989.
[6] Kjemtrup, K., Randrup, E., Sørensen, K., Grundlaget for vejtavler
læsbarhed of valg af skrifthøjder (Danish), Dansk Vejtidskrift, Copenhagen,
2003.
[7] European Committee for Standardization, Variable Message Signs,
European Standard EN-12966, Brussels, Belgium, 2005.
[8] European Committee for Standardization, Road Lighting, European
Standard EN-13201, Brussels, Belgium, 2001.
[9] Hitec, Evaluation of pavement marking reflectometers, CERF Report 40466,
Collage Station, TX, USA, 1999.
[10] Goubert, L., Lundkvist, S-O., Report of the first round robin test for mobile
reflectometers: research carried out in the frame of the activities of CEN/TC 226/WG2, VTI Notat 30A-2011, Linköping, Sweden, 2011.
[11] Young, J.R., Alternative to night-time visual inspection, Proceeding from
workshop of Field Inspection and Rehabilitation of Traffic Control Devices, Mississippi State Highway Dept., MS, USA, 1990.
[12] Lundkvist, S-O., Johansen, T.C., Road Marking Management System, a pre-study, VTI Notat 21A-2009, Linköping, Sweden.
Appendix A Page 1 (8)
Questionnaire
Questionnaire on road equipment
Dear colleague,
This questionnaire is a part of an ERA-NET ROAD project dealing with maintenance of pavements, structures and road equipment. The questionnaire you read right now is related to road equipment; two other questionnaires which you or one of your colleagues might be asked, or already have been asked to answer deal with pavements and structures.
As a follow up on this questionnaire a second one is being prepared for addressing the relation between service levels and societal costs.
Thank you in advance for taking you time!
This questionnaire deals with six types of road equipment: a Road markings
b Road studs (cat’s eyes) c Delineator posts d Fixed signs
e Variable message signs (VMS) f Road lighting
The questions refer to maintenance measures, not operational or service measures. This means that measures according to Table 1 are relevant.
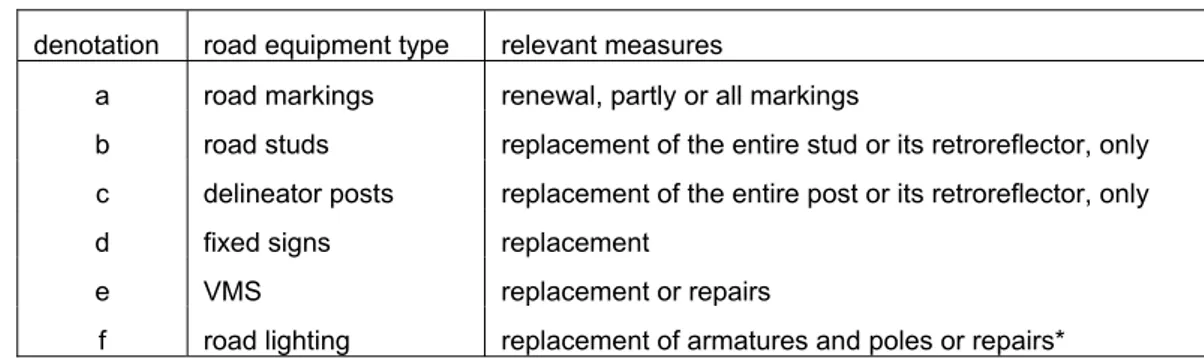
Table 1 Adequate maintenance measures.
denotation road equipment type relevant measures
a road markings renewal, partly or all markings
b road studs replacement of the entire stud or its retroreflector, only c delineator posts replacement of the entire post or its retroreflector, only d fixed signs replacement
Appendix A Page 2 (8)
All questions and estimations refer to road equipment which is ageing without any external influence like vandalism, collision, etc.
When answering the questions assume the following: A new motorway has been built. This motorway is equipped with brand new road markings, road studs, delineator posts, fixed signs, variable message signs and road lighting which fulfil the regulations in your country. This situation is maybe not realistic, but do not mind about that. If you do not
have any experience of a certain type of equipment, you do not have to answer – just leave it.
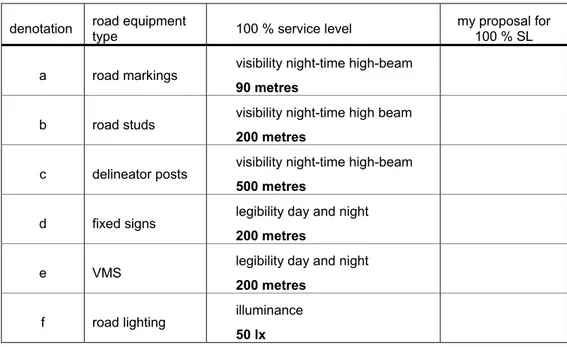
Initially, the service levels may be as shown in Table 2. However, if you have another opinion on the 100 % service level, SL = 100 %, please give this figure in the right-most column.
Task 1 In Table 2, accept or give an alternative value for SL = 100 %.
Table 2 Initial service level (SL) of six types of road equipment (a – f). If you don’t agree with the values given in the 3rd column, please give the alternative in the right-most column.
denotation road equipment type 100 % service level my proposal for 100 % SL a road markings visibility night-time high-beam
90 metres
b road studs visibility night-time high beam 200 metres
c delineator posts visibility night-time high-beam 500 metres
d fixed signs legibility day and night 200 metres
e VMS legibility day and night 200 metres
f road lighting illuminance 50 lx
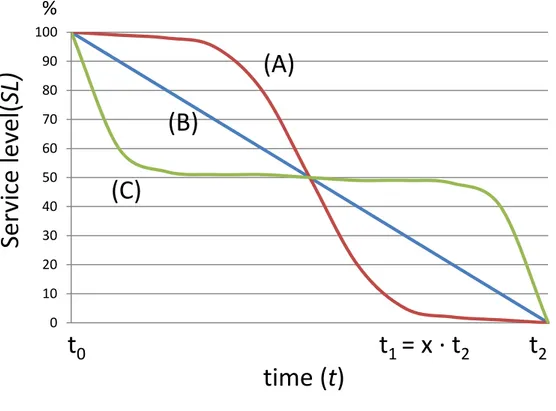
The service level of the road equipment will in almost every case deteriorate after it has been installed, approximately according to one of the curves, A, B or C, in Figure 1.
Appendix A Page 3 (8)
Figure 1 The equipment is installed at time t0, has deteriorated to some extent at time
t1 and has reached its end-of-life service level at time t2. In the figure t1 is x ·
t2, where x may be between 0.1 and 0.9.
The equipment has 100 % service level when installed at t0, has deteriorated down to
SL(t1) % at time t1 and reaches its lowest acceptable service level, 0 % at time t2. If the
deterioration is linear (blue line, B), this means that the service level will be 100 % at time t0, (100 – x) % at time t1 and finally 0 % at t2. If the deterioration follows the green
line, C, the service level will be less than (100 – x) % at t1 and if it follows the red line,
higher.
Please observe that the service level 0 % is the lowest acceptable level, not the level when the visibility, legibility or illuminance has reached 0. At this service level, SL = 0 %, maintenance is supposed to be carried out.
time (t)
Se
rv
ice
leve
l(
SL)
t
0t
1= x · t
2t
2%
0 10 20 30 40 50 60 70 80 90 100(A)
(B)
(C)
Appendix A Page 4 (8)
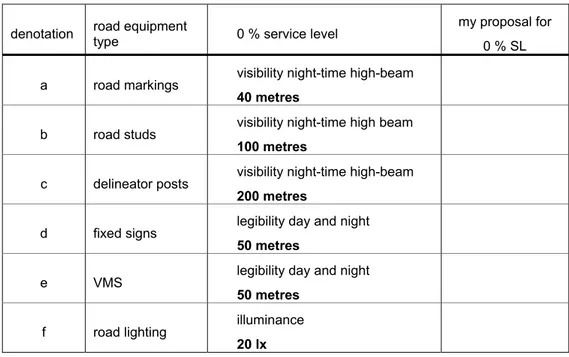
Task 2 In Table 3, accept or give an alternative value for SL = 0 %.
Table 3 End-of-life service level of six types of road equipment (a – f). If you don’t agree with the values given in the 3rd column, please give the alternative in the right-most column.
denotation road equipment type 0 % service level my proposal for 0 % SL a road markings visibility night-time high-beam
40 metres
b road studs visibility night-time high beam 100 metres
c delineator posts visibility night-time high-beam 200 metres
d fixed signs legibility day and night 50 metres
e VMS legibility day and night 50 metres
f road lighting illuminance 20 lx
Now, estimate when the road equipment reaches the service level given (default or your value) in
Table 3. Begin with estimation of t2 and then SL at time t1, where you choose t1: t1 = x ·
t2,
0.1 < x < 0.9. Finally estimate the shape of the deterioration curve in Figure 1: A (red), B (blue) or C (green).
Example: Assume that you have accepted the default values given in Table 2 and Table 3. Regarding road markings, you estimate that they will reach the lowest acceptable visibility distance, 40 metres, 50 months (Task 3) after the application. Furthermore, you estimate that most of the visibility will be lost during the first year after application. Your estimation is that the visibility is 60 metres twelve months after the application. This means that when t1 = x · t2 = 0.24 · t2 = 12 months (Task 4) the service level is 40
% and the deterioration follows curve c in Figure 1 (Task 5). If you are not certain on the figures, you may use an uncertainty interval: In Table 4, write t2 = 25 ± 5 months if
you think that SL = 0 % will be reached 20 – 30 months after application. The same applies to Task 4 and Task 5.
Appendix A Page 5 (8)
Task 3 Estimate when SL reaches the level given in Table 3 (default or
your value). Fill in the estimations in Table 4.
Task 4 Estimate SL at time t
1, where you choose t
1: t
1= x · t
2,
where 0.1 < x < 0.9. Fill in the estimations in Table 4.
Task 5 Estimate the shape of the deterioration curve in Figure 1: A, B
or C. Fill in the estimations in Table 4.
Table 4 Estimation of time to end-of service level, t2, time t1, and service level, SL, at
time t1 for six types of road equipment (a – f).
denotation road equipment type t2 (months) (months) t1 = x· t2 SL at t1 (%) deterioration curve
a road markings ± ± ± b road studs ± ± ± c delineator posts ± ± ± d fixed signs ± ± ± e VMS ± ± ± f road lighting ± ± ±
Appendix A Page 6 (8)
Finally, a few more questions:
Road markings
How often does inspection take place? _________________________________ How is inspection performed? _________________________________ Is data from the inspection stored? _________________________________ Do you use some type of management model? _________________________________ What maintenance measures are taken? _________________________________ What are the yearly costs per km motorway for these measures? ______________ What is the new service level after measure? _________________________________
Road studs
How often does inspection take place? _________________________________ How is inspection performed? _________________________________ Is data from the inspection stored? _________________________________ Do you use some type of management model? _________________________________ What maintenance measures are taken? _________________________________ What are the yearly costs per km motorway for these measures? ___________________ What is the new service level after measure? _________________________________
Delineator posts
How often does inspection take place? _________________________________ How is inspection performed? _________________________________ Is data from the inspection stored? _________________________________ Do you use some type of management model? _________________________________ What maintenance measures are taken? _________________________________ What are the yearly costs per km motorway for these measures? ___________________ What is the new service level after measure? _________________________________
Appendix A Page 7 (8)
Fixed signs
How often does inspection take place? _________________________________ How is inspection performed? _________________________________ Is data from the inspection stored? _________________________________ Do you use some type of management model? _________________________________ What maintenance measures are taken? _________________________________ What are the yearly costs per km motorway for these measures? ___________________ What is the new service level after measure? _________________________________
VMS
How often does inspection take place? _________________________________ How is inspection performed? _________________________________ Is data from the inspection stored? _________________________________ Do you use some type of management model? _________________________________ What maintenance measures are taken? _________________________________ What are the yearly costs per km motorway for these measures? ___________________ What is the new service level after measure? _________________________________
Road lighting
How often does inspection take place? _________________________________ How is inspection performed? _________________________________ Is data from the inspection stored? _________________________________ Do you use some type of management model? _________________________________ What maintenance measures are taken? _________________________________ What are the yearly costs per km motorway for these measures? ___________________ What is the new service level after measure? _________________________________
Appendix A Page 8 (8)
Please write any other information here:
______________________________________________________________________ ______________________________________________________________________ ______________________________________________________________________ ______________________________________________________________________ ______________________________________________________________________ ______________________________________________________________________
www.vti.se vti@vti.se
VTI är ett oberoende och internationellt framstående forskningsinstitut som arbetar med forskning och utveckling inom transportsektorn. Vi arbetar med samtliga trafikslag och kärnkompetensen finns inom områdena säkerhet, ekonomi, miljö, trafik- och transportanalys, beteende och samspel mellan människa-fordon-transportsystem samt inom vägkonstruktion, drift och underhåll. VTI är världsledande inom ett flertal områden, till exempel simulatorteknik. VTI har tjänster som sträcker sig från förstudier, oberoende kvalificerade utredningar och expertutlåtanden till projektledning samt forskning och utveckling. Vår tekniska utrustning består bland annat av körsimulatorer för väg- och järnvägstrafik, väglaboratorium, däckprovnings-anläggning, krockbanor och mycket mer. Vi kan även erbjuda ett brett utbud av kurser och seminarier inom transportområdet.
VTI is an independent, internationally outstanding research institute which is engaged on research and development in the transport sector. Our work covers all modes, and our core competence is in the fields of safety, economy, environment, traffic and transport analysis, behaviour and the man-vehicle-transport system interaction, and in road design, operation and maintenance. VTI is a world leader in several areas, for instance in simulator technology. VTI provides services ranging from preliminary studies, highlevel independent investigations and expert statements to project management, research and development. Our technical equipment includes driving simulators for road and rail traffic, a road laboratory, a tyre testing facility, crash tracks and a lot more. We can also offer a broad selection of courses and seminars in the field of transport.