A case Study
PAPER WITHIN Production Development and Management
AUTHOR: Shravan Dhanpal Harinath and Shakeel Ahmed Siddique JÖNKÖPING January 2018
Identifying specific line
balancing criteria for an
efficient line balancing
software
This exam work has been carried out at the School of Engineering in Jönköping in the subject area Production system with a specialization in Production Development and management. The work is a part of the Master of Science program. The authors take full responsibility for opinions, conclusions and findings presented.
Examiner: Vanajah Siva
Supervisor: Johan Karltun
Scope: 30 credits (second cycle)
Acknowledgement
This thesis is done in collaboration with Electrolux Laundry Systems Ljungby (Sweden), as a part of their lean development projects.
First, we would like to sincerely appreciate and cherish the dedication and invaluable guidance provided by our thesis supervisor Mr. Johan Karltun.
Secondly, we would like to thank Mr. Rikard Karlsson, EPS manager, Electrolux Ljungby, for showing interest in this research topic, and helping us throughout the pro-cess. We would like to thank everyone at Electrolux who has helped us in completing this thesis.
We would also like to express our gratefulness towards our seminar opposition partners and colleagues for sharing their feedback and providing us peer-to-peer reviews along the path.
We would like to express our warm thanks to our examiner Ms. Vanajah Siva for provid-ing thesis guideline and dedicatprovid-ing time to read our final paper.
Finally, for whatever we are today, we thank our parents and friends for their remarkable moral support.
Abstract
For any business, surviving in a competitive market while maintaining all the opera-tional performance indices up to mark is very crucial. There are several theories and techniques to improve the efficiency of the operational performances. Line balancing is one of those well practiced techniques used daily in most of the industries. Line bal-ancing helps balance the assembly lines with regards to man, machine, takt times, etc. This thesis research was done with Electrolux laundry systems, Ljungby in Sweden. With the varying customer demands the case company was balancing its line manually using basic methods. As a part of lean development schemes, Electrolux Ljungby, wanted to transform the line balancing techniques from manual to a fully automated software.
The purpose of this research is to determine the company-specific line balancing criteria which should be considered before performing line balancing. This research further-more lays out a guideline to follow a smooth transition from the manual system of LB to an automated software by concluding the features the software must handle to per-form the LB according to required objectives.
A case study approach was utilized to collect all the required data to achieve the results. Initially with the literature review few generic algorithms which can solve the multi model single sided straight-line balancing problems with an objective to balance the work load are suggested. Later using other data collection techniques such as inter-views, observations and historical analysis we arrived at the data required to design the guidelines with regards to line balancing software features.
The findings suggest that the desired line balancing constraints which are very im-portant in the multi model single sided straight-line balancing problems are flow of materials, assembly precedence, physical constraints, product demand, bill of materials, restricted processes, man power and desired line balancing objectives. Keeping these constraints into consideration the features which are desired in an onlooking line bal-ancing software are the Integration of data and documents/ maximum control, mixed model and option intelligence and analysis, multiple resources, smart variant manage-ment, scenario managemanage-ment, yamazumi chart, constraints and reporting tabs.
The findings of this thesis can be used as guidelines by any manufacturing industry while they consider buying a new software which can handle Line balancing problems. This research is one of its kind which talks purely about the constraints and desired features only in a specific line balancing scenario. Practitioners can use this as a base for conducting further research on constraints and features pertaining to it, for different line balancing scenarios.
Keywords
Multi model line balancing, line balancing constraints, assembly line balancing, multi model, single sided, work load distribution
5
Contents
1
Introduction ... 8
1.1 BACKGROUND ... 8 1.1.1 Company background ... 9 1.2 PROBLEM DESCRIPTION ... 101.3 PURPOSE AND RESEARCH QUESTIONS ... 10
1.4 DELIMITATIONS ... 11
1.5 OUTLINE ... 11
2
Theoretical background ... 12
2.1 ASSEMBLY LINE DESIGN ... 12
2.2 CHARACTERISTICS OF ASSEMBLY LINES ... 12
2.3 ASSEMBLY LINE BALANCING PROBLEMS ... 13
2.3.1 Desired line balancing objectives ... 14
2.4 THEORETICAL LINE BALANCING CRITERIA ... 14
2.4.1 Assembly precedence ... 14
2.4.2 Physical work load constraints ... 16
2.4.3 Material supply ... 18
2.4.4 Product demand ... 18
2.4.5 Cost synergies ... 18
3
Method and implementation ... 19
3.1 RESEARCH APPROACH ... 19
3.2 RESEARCH METHODS ... 21
3.2.1 Case study approach ... 21
3.3 RESEARCH TECHNIQUES ... 21
3.3.1 Literature review ... 21
3.3.2 Interviews ... 22
3.3.3 Observations ... 23
6
3.3.5 Data analysis ... 23
4
Findings and analysis ... 24
4.1 THEORETICAL FINDINGS RQ1 ... 24 4.2 EMPIRICAL FINDINGS ... 26 4.2.1 Company overview ... 26 4.2.2 Findings regarding RQ 1 ... 27 4.2.3 Findings regarding RQ 2 ... 31 4.3 ANALYSIS ... 32 4.3.1 Regarding RQ 1 ... 32 4.3.2 Regarding RQ 2 ... 34
5
Discussion and conclusions ... 36
5.1 DISCUSSION OF METHOD ... 36
5.1.1 Reliability and validity ... 36
5.2 DISCUSSION OF FINDINGS ... 36
5.2.1 Answering research question 1 ... 37
5.2.2 Answering research question 2 ... 37
5.3 CONCLUSIONS ... 38
5.4 FUTURE WORKS ... 39
6
References ... 40
7
Appendices ... 49
7.1 APPENDIX 1INTERVIEW GUIDE USED TO DESIGN THE INTERVIEW QUESTIONS: 49 7.2 APPENDIX 2SEMI STRUCTURED INTERVIEW QUESTIONS: ... 50
7.3 APPENDIX 3DEMAND FOR THE FAST-MOVING MODELS 520 AND 595 FOR THE WASHING MACHINES FROM THE YEAR (2010-2017) ... 51
7
List of figures
Figure 1 EPS temple ... 9
Figure 2 Assembly line design ... 12
Figure 3 Assembly line for single and multiple models, (Bukchin et al., 2002). ... 13
Figure 4 Illustration of precedence diagram (Brahim et.al, 2006) ... 14
Figure 5 Research Design ... 19
Figure 6 Qualitative research design (Williamson, 2002) ... 20
Figure 7 Desired features in a LB software ... 35
Figure 8 Interview guide (Kallio et al., 2016) ... 49
Figure 9 Electrolux Ljungby plant layout- Lean B………..55
List of tables
Table 1 Potential line balancing criteria found in literature... 24Table 2 Line balancing criteria stated during the empirical research ... 27
Table 3 Average product demand for models 520 & 595 (Yearly) ... 30
Table 4 Standard deviation in product demand for products 520 & 595 (yearly) ... 30
9
1
Introduction
This chapter gives a fair insight into what this research is about. Information is divided into different sections background, problem description, purpose and research ques-tions and limitaques-tions of this thesis.
1.1 Background
After agricultural revolution, industrial revolution of 18th-19th centuries triggered world’s second largest expansion in economic productivity. Together with his team at Highland-Park Assembly Plant, Henry Ford introduced a manufacturing process which substantially reduced the assembly time and cost. For the first time in a history, auto-mobiles became affordable to public. Creation of the assembly line made one of the greatest impacts on the world’s history not only by developing manufacturing industry, but also by improving working and living conditions, rising urbanization, life expec-tancy and public wealth.
The principle that was followed by Ford was moving of the work from one worker to another until it becomes a complete unit, this followed by arranging of this units at the right place and right time to form an assembly line from which the finished product comes out. Assembly line typically consists of a series of tasks that are performed on a product at consecutive work stations. Each station is manned by a worker and this worker performs a series of tasks on the product while it’s in that station. When the task is completed the product moves on the next station where next set of tasks awaits it. Since the times of Ford, a lot of transitions have taken place in the manufacturing and assembly methods. Due to the constantly-increasing customer demand the fast mass-producing lines have taken shape as multi-model assembly lines, flexible systems and customized lines. These changes in the assembly lines also include parallel work sta-tions or tasks in the same assembly line, customized mixed models and multi-model lines, U-shaped lines and un-paced lines with buffer (Becker & Scholl, 2006).
Assembly lines were mostly seen in those industries which typically produces high-quality standardized products. Recently, assembly lines have also gained an importance in the customized low-volume productions (Becker & Scholl, 2006). It is eminently important for any industry to continuously increase its productivity considering chang-ing customer demand in order to maintain its competitive advantage. Accordchang-ing to Schmenner (2001), productivity can be achieved if the production systems are efficient and effective. Assembly line balancing plays a key role while managing the assembly systems (Becker & Scholl, 2006).
Installing a new assembly line is a tedious and long-term decision which requires ex-tensive investments. Hence, line balancing (LB) plays a vital task in the medium-term production planning. These assembly lines should be designed and balanced in an op-timum way to work effectively and efficiently. LB is a process of distributing the as-sembly task equally between the available work stations. LB is not only done to newly-installed lines, instead it is also implemented on the existing lines when the production processes are being altered and to maintain them regularly. The balancing decisions
9
have a long-term effect on the assembly lines which makes it highly important for the companies to align them with the strategic goals of the organization.
A traditional assembly line consists of definite set of tasks which are associated with a processing time. Each of the tasks comes with a set of precedence relations, which spec-ify the order of tasks to be carried out (Ghoush & Gagnon, 1989).
The basic function of LB is to assign the tasks in a defined sequence of stations. Helge-son was the first one to formulate analytical solution for LB in 1954 (Ghoush & Gag-non, 1989). After that in Salveson (1995) introduced a mathematical form and sug-gested a linear programming solution. Since then the assembly line balancing has be-come a topic of interest for numerous researchers.
In an intermixed sequence, the mixed model assembly lines produce range of products with varying attributes such as colors, components, size etc. Due to this, such elements as precedence, takt time, operator skills and equipment must be constantly adjusted, and these adjustments must be taken into consideration while balancing the line. Find-ing a perfect balance between all the changFind-ing attributes in highly unlikely. Hence, there is a need for a mixed model line to be flexible regarding precedence, takt times, operator skills and equipment (Becker & Scholl, 2004).
1.1.1 Company background
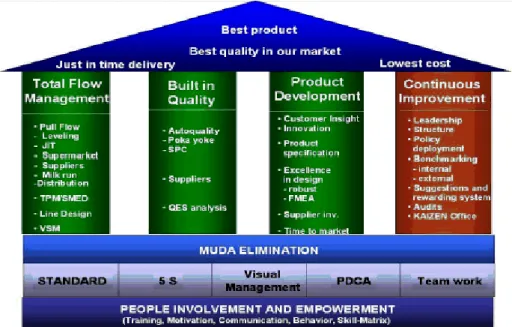
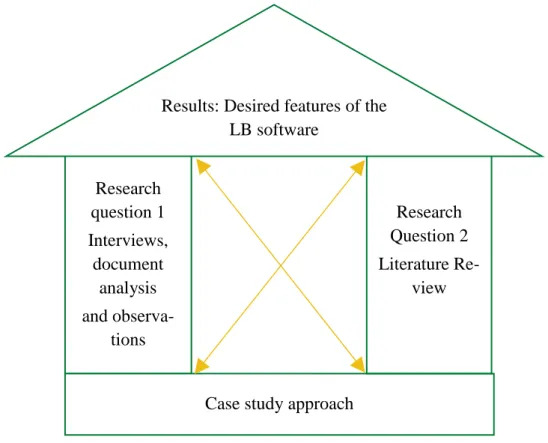
Electrolux strives every day to achieve its vision “To be the best professional laundry factory in the world” in terms of its customers, employees, shareholders and other stake-holders. The production techniques of Electrolux have been evolving over the years and currently the company is a complete lean production site aiming to eliminate the wastes and getting efficient in resources daily. Electrolux has also introduced its defined pro-duction system, called EPS temple.
10
The base of the company is substantially built by valuing the people involvement and empowerment in regards with standards, 5S, Visual management, PDCA and Team work. To achieve certain goals such as “Just in time and lowest cost which in return benefit the company with Best quality product in the market”, Electrolux has designed four pillars which stand tall such as Total flow management, Built in quality, Product development and Continuous improvement.
Electrolux laundry systems in Ljungby concentrate on three distinct types of delivery time codes for distinct product types which are listed below:
Class A products are ready for delivery and are always kept ready to ship in the inven-tory as the customer is guaranteed to receive a product within 24 hours.
Class B products are made for market, the lead time is 5 days from the date of order while they have only 3 days to finish the product and send it to the warehouse.
Class C products are delivered on demand, the lead time can vary from 1 day up to several weeks.
Class B products which have only 3 days in the plant are called TR3. They were opti-mized from higher lead times such as TR7, TR8 etc. meaning that Electrolux has been able to achieve immense optimization with the lean production techniques.
1.2 Problem description
Electrolux laundry systems at Ljungby have a vast variety of Laundry systems to be manufactured daily as per the customer demand. It is a global company delivering to a large customer base all over the world. To keep up with this level of variety there is a need for making assembly line balancing faster and more efficient. At present the com-pany performs line balancing using the tool MS Excel where they must deal with a wide range of calculations to be done manually daily, making it hard to understand and change the values as per the changing customer demand. Electrolux also considers changing current way of dealing with line balancing problems by changing the existing system from working on a manual MS Excel sheets to a line balancing software which is more accurate and time efficient considering the applicable line balancing criteria of the company.
1.3 Purpose and research questions
The purpose of this research is to determine the company-specific line balancing criteria which should be considered before performing line balancing. This research further-more lays out a guideline to follow a smooth transition from the manual system of LB to an automated software by concluding the features the software must handle to per-form the LB according to required objectives.
The research questions according to the purpose of the thesis are categorized into two. RQ 1: What are the different criteria which should be met for ideal Line balancing in the context of Electrolux Ljungby?
11
RQ 2: How can these criteria be transformed to required specifications for a Line bal-ancing software?
1.4 Delimitations
This research is confined to a specific case company and a specific line balancing sce-nario. Hence, the results may not be generalized unless the new line balancing scenario is very similar to the case company. Moreover, the research mainly concentrates on the LB problems of assembly lines, excluding the sub-assembly lines.
1.5 Outline
This section describes all the important chapters of the thesis report in a very short note. Chapter - 2
Theoretical background
In this section various terms and their definitions collected from the literature are given which is crucial to know before further thesis content.
Chapter - 3
Method and implementation
In this section the research methodology is thoroughly explained while giving an insight on the data collection techniques used and the data analysis methods.
Chapter - 4
Findings and analysis
This section is further divided into two sub sections called as Theoretical findings and the Empirical findings. All the data required to answer both research questions is pre-sented in this section.
Chapter - 5
Discussion and conclusion
In this section the research methodology and the findings are discussed in order to arrive at a conclusion. Moreover, visual representation of the whole research is provided. To conclude, suggestions for further research are presented.
12
2
Theoretical background
In this chapter, Definition of the terms and theories regarding the LB are explained, which are important to be known before going on to the core of this research.
2.1 Assembly line design
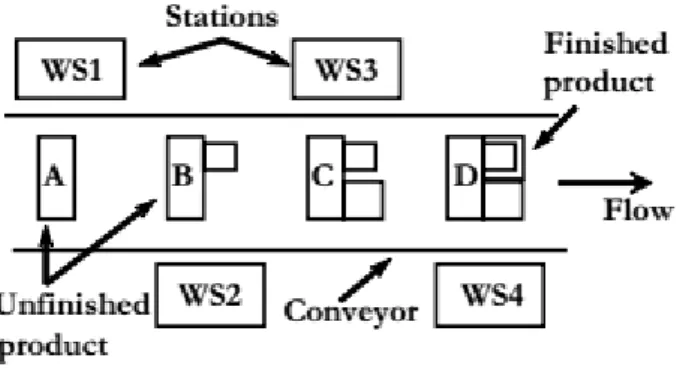
Assembly line design is a result of the continuous evolution of manufacturing technol-ogies over time. Henry Ford was one of the firsts to invent the assembly line. Which in turn changed the way the cars are manufactured in terms of cost and the pace as they are manufactured. Henry Ford was also the first one to introduce the conveyor belts. Conveyor belts were helpful in implementing the principle of “Division of labor”. Di-vision of labor made it easier for the employees to concentrate on one piece of a product at once instead of concentrating on the whole product all at once (Brahim et.al, 2006). The basic assembly line is that there are several numbers of workstations positioned along a moving conveyor belt. Every station performs either one or more tasks while every station performs a value-added task. These tasks are performed by workers and with the use of appropriate machines and robots. The conveyor belts move according to a time termed as Cycle time. By repeating this process for several times, the final product is obtained at the last workstation. It is also possible that these tasks are asso-ciated with the precedence relationships (Brahim et.al, 2006). By using the principles of specialization and work division, high productivity of mass production system can be achieved (Bukchin et.al, 2002).
2.2 Characteristics of Assembly lines
Since industrial manufacturing systems are different in each case, assembly line bal-ancing problems corresponding to each assembly line are also different. (Rekiek et al., 2002b) and (Rekiek and Delchambre, 2001) provide a detailed classification of assem-bly line balancing issues (Becker et al., 2004). In every assemassem-bly line the time every product spends in each station is limited to the cycle time ‘c’. This is the maximum value of each product. Since tasks performed on the product are inseparable work
13
elements, the minimum value of c is always equal to the largest task time. Each assem-bly line has a fixed production rate, this is due to fixed cycle time. This fixed production rate is referred to as takt time.
In the absence of a predetermined cycle time, each station operates at its own individual speed. This causes uneven flow of product in the assembly line and the product may have to wait before it enters the next work station. This puts the current work station in the state of idleness when they have wait for the next product. This situation is partially overcome by introducing a buffer. In case of an assembly line that has buffers, assembly line problems are accompanied by additional decision problem of dimensioning and positioning the different buffers (Dolgui et al., 2002a)
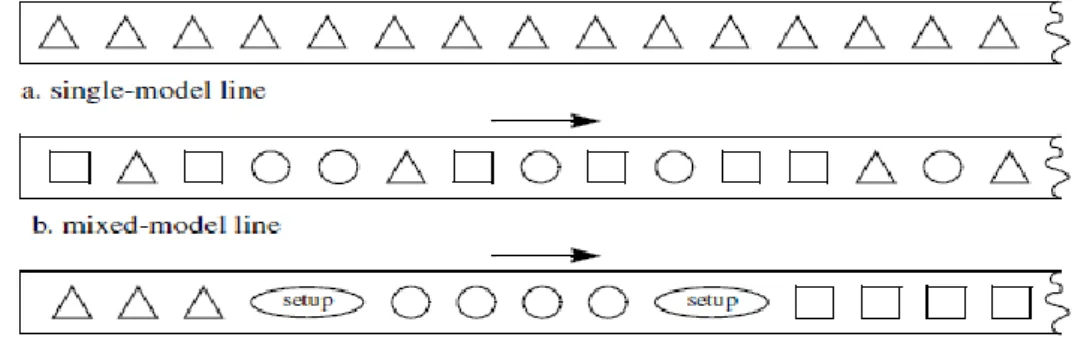
If the assembly product is of only one type, then all the tasks that must be performed are identical and this assembly line is termed as ‘(A)Single-model assembly line’. If the manufactured products have several models on the same line the assembly line balanc-ing problems are now connected to a sequencbalanc-ing problem. These sequencbalanc-ing problems must decide the sequence of assembly of different model units (Merengo et al., 1999). To have higher efficiency of the line this sequencing is important because various prod-ucts may have considerable different task times. Based on the type of sequencing two categories of products arise.
• Single model assembly line: single model is assembled repeatedly, or one as-sembly line is complicated to a single model.
• Mixed-model assembly line: Where in the assembly line produces units of var-ious models in an arbitrarily intermediate sequence (Bukchin et al., 2002). • Multi-model assembly line: Where in the assembly line produces a sequence of
batches of each model. Each batch contains a unit of only one model or a group of very similar models.
2.3 Assembly line balancing problems
The researchers who have been researching on this topic of assembly line balancing are dated to be as from past 40 years. Many of the research carried out throughout these years are on the simple single model and without considering the constraints such as
14
precedence relations. It is very recently that the mixed model assembly lines came into the topic of interest for researchers as most of the industries now a day run on a mixed model line due to the pressures of sustaining in the market by satisfying the customers with more variety of products (Gocken, 1997). Mixed model assembly lines became the topic of interest as a result of market competition to satisfy varied customer demands (Gocken, 1997).
2.3.1 Desired line balancing objectives
In assembly line balancing various objectives are considered. The goal is to optimize one or more objective without exploiting the assembly line restrictions (Ghosh et.al, 1989). The most common objectives that are widely investigated are as follows
• Minimizing cycle time
• Reduction of number of workstations • Maximizing work relatedness
• Maximizing workload smoothness
• A combination of maximization of work relatedness or workload smoothness (Kim et al., 1996)
2.4 Theoretical line balancing criteria
2.4.1 Assembly precedence
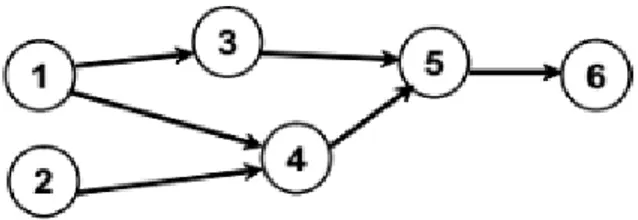
Precedence is the order in which the tasks must be carried forward while performing the assembly process of any product. These constraints are because of the technological restrictions. The nodes in the diagram are termed as the tasks which should be carried out and the arrows represent the precedence directions which indicates which task must be completed before the other. (Brahim et al., 2006)
Traditionally an assembly line comprises of limited set of tasks, each of these tasks has a predetermined fixed processing times. This fixed processing time occurs within the precedence network, this precedence network indicates the permitted order of the tasks. Assembly Line Balancing problem (ALBP) assigns tasks to workstations in a system-atic way so as the precedence relationships are not violated. ALBP also ensures that some effective measures are optimized such as line efficiency, number of workstations (Boysen et al., 2008). All these factors make balancing assembly line have significant effect on performance and productivity of the manufacturing system (Hamta et al.,
15
2011). Assembly lines comprises of series of workstations in which the product enters the assemble line through a particular station and a set of predefined operations are executed on it. This happens in a straight line and the product finally reaches the end of the assembly line. The time duration between the entry of the product into a particular station and the exit of the product from the same station is referred to as cycle time. Simple assembly line balancing problems (SALBPs) is where the focus lies widely till now.
There are two types of SALBPs (Boysen et al., 2007)
1. SALBP type 1: This type of problems aims at reducing the number of workstations for a predetermined cycle time. This situation generally arises when the company de-cides to design new assembly line.
2. SALBP type 2: This type of problem is usually intended for already available assem-bly systems and focuses on improving their line efficiency. The goal is to minimize the cycle time or to maximize the production rate for a specific station.
To bridge the gap between real problems and academic studies, more realistic relevant features have been considered such as U-shaped lines, parallel stations, equipment se-lection and other processing alternatives. These types of problems are called as General assembly line balancing problems (GALBPs) (Becker et al., 2006)
Time always plays a key role in real industrial situations. When considering new ma-chines that shortens the processing time, we must account for the factors that will reduce the lifetime of the machine, such as wear, corrosion, and fatigue. In most assembly lines, reducing the cycle time will increase the production rate. By using new machines with flexible operation time, we can reduce the processing time which might shorten the cycle time and increases the production rate. Cost and Operating time vary with the working and use of machines, but for simpler calculations a linear function between the two is considered. The problem is to reach a trade-off point between the cost of reducing the task time and the value of the cycle time. For straight assembly lines the problem is commonly known as Flexible task time assembly line balancing problem (FTALBP) (Hamta et al., 2011). Assembly lines problems can be categorized into different do-mains and researchers have focused on each of these fields. Straight assembly lines, U shaped assembly lines and parallel assembly lines are the most considered assembly lines (Hamta et al., 2011). Various algorithms are developed to obtain optimal balanc-ing in reasonable time. Numerous algorithms are developed and can be classified into genetic algorithms (Chen et al., 2002), tabu search (Lapierre et al., 2006), ant colony optimization (Simaria et al., 2009), simulated annealing (Özcan, 2010), petri-net heu-ristic algorithms (Kilincci et al., 2010), Computer Method of Sequencing Operations for Assembly Line (COMSOAL) meth-od (Toksarı et al., 2010) and Graphical Repre-sentation of Algorithms, Structures and Processes (GRASP) algorithms (Andres et al., 2008).
16 2.4.2 Physical work load constraints
Physical work load (PWL) is the cost that is related to an individual when performing a task with specific demands while considering their capacity of achieving that level of performance (DiDomenico, 2003). The PWL considers several factors that are related to work and environment. The factors related to work include repetitive movements, awkward posture, vibrations, lifting, and prolonged sitting or standing, and those related to the environment include lighting, temperature, and humidity. Not considering these factors may lead to an excess of workload.
PWL is a necessary part of designing a job, as excess of workload leads to injuries, such as musculoskeletal disorders (MSD) (Fredriksson et al., 2001), (Marras et al., 2009). MSDs are muscle injuries that affect the ligaments, nerve and tendons. MSD affect many employees and constitutes of about one-third of all injuries reported each year. The economy and the businesses also pay heavily, because of its effect on the workers. The Factors such as awkward or static postures, repetitive activities, lifting or moving and vibrations are the main cause of MSD. The frequency, intensity and duration of exposure to these factors determine the level of risk. Such factors are always found in assembly lines, and hence assembly workers are most exposed to MSD (Moreau 2003, Landau et al., 2008). Hence it is important to consider PWL when designing the work-stations so that the risk of injuries, such as MSD, are minimized.
It is important to ensure that the employees are not overworked to reduce the risk of MSD. Hence the assembly line should be designed to limit the workload at every sta-tion. Most of the assembly line problems only consider duration and task precedence when it comes to minimizing cycle time. PWL is a vast concept considering many di-mensions. When talking of the physical work the following factors should be consid-ered (Mutlu et al., 2012).
• The requirements of the job like, repetition, work posture, duration etc.
• Workplace conditions like floor, seating arrangement, the height of the work-space etc.
• Conditions of the workspace environment like temperature etc. • Psychological factors like stress etc.
PWL can be assessed in diverse ways which are subjective methods, direct methods, psychophysiological methods and observational methods (Li and Buckle, 1999). The subjective method uses different tool, like rating scales, interviews, questionnaires etc., to collect data directly from the workers. Workload can also be calculated using the Fuzzy set theory. The simplicity and the validity of the subjective approach makes it the most frequently used (Li et al., 1999). The direct method accounts for the physical factors, like heart rate, blood pressure, electromyogram (EMG), oxygen consumption, electrocardiogram (ECG), respiratory rate etc., while determining the PWL. Consider-ing such factors requires the use of software and devices that are tailored for each factor. (Mutlu et.al, 2012). The method of observation determines the position of the body, like trunk, head, lower and upper arms etc., when the workers are observed while they per-form a task. Deviation from the observed data, in terms of neutral position, repetition
17
and force required for an action, is observed and scores are assigned for each body part based (Mutlu et.al, 2012).
Another problem derived from the assembly line are those related to ergonomics. The human factor was considered by Chen et al., (1994) while constructing a model that calculates the degree workload after determining the several reasons that increase the workload. Moreover, Hagberg et.al., (1995) concluded that excluding factors other than processing time when balancing an assembly line would result in an increase in the number of workers which might lead to physical injuries to the workers (Choi, 2009). To avoid such situations, Carnahan et al., (2001) realized that physical factors play a key role in designing an assembly line and derived a formula to reduce the cycle time of a single model which considered grasping power to be the physical factor. The work-ers performance is affected by their workload level, so Jung et al., (2001) analyzed the several reasons that affect the workload and established a scale to determine the level of workload for the workers. Landau et al., (2008), Kumar et al., (2008), and Newell et al., (2008) further researched the problem of physical work and found several areas where a solution could be implemented. (Choi, 2009)
Many researchers have been working to determine a solution to both the single and mixed-models balancing problem (Gagnon et al., 1991). A detailed literature review has been presented by Matanachai and Yano (2001) documenting 1980-1990 develop-ment. Becker and Scholl (2006), Boysen, Fliedner, and Scholl (2007, 2008) have best addressed the balancing problem by providing a structured classification and analysis of concerns related to the single and mixed models (Choi, 2009).
The research that has largely impacted the balancing problem of traditional mixed model are listed below. The first approach, by Roberts and Villa (1970), was to ensure continuous operation by using an integer program model that constraints the number of work stations. The approach was implemented in real life and further improved by Macaskill (1972), Raouf et al., (1983), Berger et al., (1992), and von Zante-de et al., (1997). Erelbacher et al., (1991) recommended integrating the different work categories at each station and using that data to determine the best way to assign the job. Hsu (1992) introduced a way to refine an existing workstation to cut down the rate of over-load and to curtail the cost. The shortest path model was introduced by Erel et al., (1999) which aims at ensuring a continuous work flow. Matanachai et al., (2001) es-tablished a way to account for the change in model combination while determining and assigning the processing time. Resource constraints was addressed by Agpak et al., (2005) who proposed the use of 0-1 integer formulation. (Choi, 2009)
After extensive research Scholl et al., (2006) introduced a survey about the algorithms that are used to design a stable assembly line. A few of the main algorithms are listed below. Branch-and-bound algorithm was introduced by Berger et al., (1992), which constrained the fixed cycle time to reduce the number of workstations. The Branch-and-bound algorithm gained prominence when Bukchin et al., (2006), Miralles et al., (2008) recommended its use. Using goal programming, Gokcen et al., (1997) were able to eliminate imbalances in the assembly line, furthermore, the fuzzy goal programming
18
formulae were introduced by Özcan et al., (2008). Simaria et al., (2004) suggested the use of genetic algorithm for a heuristic approach.
2.4.3 Material supply
Material supply is a salient, but critical part of an assembly line. In recent times auto-mated vehicles are used to transport materials directly to the station, but a traditional method it to use containers that are transported alongside the product. Implementing the traditional approach of transport requires answers to many questions such as the size of the container, quantity of material, the system to connect different stations, the number of stations to be connected, the distance between the container and the operator (Bukchin et al., 2005). A decision must be made for each of the factors before imple-menting the transport system. To simplify the decision-making process, it is always recommended to consider the material supply problem while balancing an assembly line (Boysen et al., 2008)
2.4.4 Product demand
Manufacturing of products requires accomplishment of diverse types of tasks and this task assignment is done by assembly line balancing (ALB). The problems associated with this ALB are called simple assembly line balancing problems (SALBP) (Scholl, 2006). SALBP basically considers two constraints while assigning tasks to the work-stations, which are precedence constraints and cycle time constraints. Bautista et al., (2007) proposed a more realistic ALB problem which is an extension of SALBP. The authors considered an additional space constraint which is much closer to real world situations. This gave birth to the term “time and space assembly line balancing prob-lem” -(TSALBP) (Chica et al., 2013). TSALBP is a more realistic multi objective ver-sion of industrial problems associated with line balancing which also takes into consid-eration of the area of the working stations.
However, in a real industrial situation these are not the only important constraints, fluc-tuation of product/customer demand must also be considered. Chica et al., (2013) con-sidered TSALBP and introduced a real scenario which comprised of mixed products with fluctuating demands. The authors suggested a novel robustness functions which measures the robustness of the assembly line configuration when demand changes the production plan. The robustness value is graphically represented which forms a generic model and in turn gives a better picture of the effect of demand.
2.4.5 Cost synergies
A cost synergy is observed when different tasks demand the use of a constant set of resources. The synergy presents an opportunity of reducing the capital cost by assigning the set of resources to a particular station. Zoning constraints are also implemented for the task performance. Using cost synergies, the resources are conserved, but the line balancing is pared down which add to the cost. An explicit cost synergy model is used to determine if minimizing resources could compensate for reduced line balancing. Dur-ing a theoretical calculation the cost synergies are usually included with the station and process costs, although in actual practice cost synergies are incurred when resources
19
are either used, or when the stock is replenished. Therefore, the cost of resources should be separated from the rest (Boysen et.al 2007).
3
Method and implementation
3.1 Research approach
It is said that the three major checkpoints in any research start from formulating a prob-lem, then the collection of empirical data through observation of various sources of information regarding the problem formulated and connecting the collected data with the available problem-specific research papers which are already published (Jacobsen, 2002).
The the end results of this research work are expected to be qualitative and hence the flexible design of the qualitative approach is implemented.
The figure above depicts the research approach followed, using the case study approach. All the empirical data is collected from the case company regarding the LB criteria which set up the firm base to the structure of this research work. To collect the empirical data from the case company, interviews were adapted as the best option as it was nec-essary to have a deeper knowledge about the problem. Semi-structured interviews were conducted with a specific set of questions which led to discussions. The company’s historical documents such as demand trends, company structure, plant layout was
Research question 1 Interviews, document analysis and observa-tions
Case study approach
Research Question 2 Literature
Re-view Results: Desired features of the
LB software
20
analyzed using document analysis as the secondary source of empirical data for (RQ1). Another data collection technique which was used are observations. Observations was chosen to validate the line balancing criteria which were collected through interviews and document analysis, it was made sure through the observations that all the LB crite-ria are seen on the assembly line in real time.
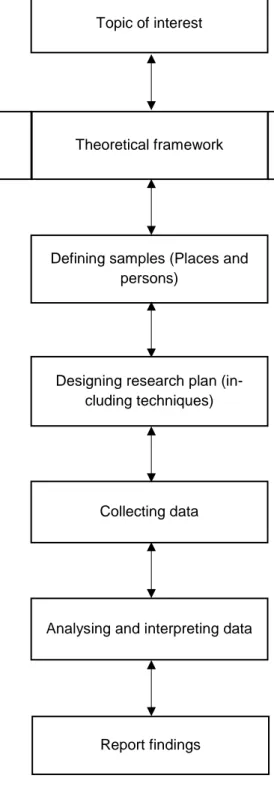
Figure 6 Qualitative research design (Williamson, 2002) Topic of interest
Literature review Theoretical framework Formulate research question
Defining samples (Places and persons)
Designing research plan (in-cluding techniques)
Collecting data
Report findings
21
The literature review was done to build the theoretical base of this report which includes various definitions and concepts needed to be known before going deeper into the sub-ject area. Literature review is also done to narrow down the knowledge gap regarding the multi model line balancing techniques which the company are unaware. The arrows in the Figure 5 represent the flexible nature of this research design. It is said to be flexible because there were a lot of iterations in the very beginning of this research where based on the literature knowledge obtained the aim and research questions were modified a few times, meanwhile the literature search took us back and forth throughout the process. The top most part of the diagram which is called as roof represents the results of this research, which is strongly supported by all the other sections of this report.
This research started by understanding a specific theory by conducting the literature review and then choosing the topic of research and framing the research questions. Later suitable data was collected from the case company and analyzed the data in the last section to get to the conclusions. Hence this design becomes iterative and nonlinear in nature. The figure above depicts the qualitative and iterative research design where one can see that there is a two-way arrow marks between every step which is the nature of it (Williamson, 2002).
3.2 Research methods
3.2.1 Case study approach
The case study is a method which investigates a phenomenon in a real-life context (Yin, 1994). The case study approach was chosen for this research because it was very ap-propriate to the Electrolux context where there was a need to examine and understand a specific context.
It is a single-case study as this research heads to solve a problem which is specific to a single company. Anyhow the results can be generalized to the manufacturing industries with a similar environment as Electrolux such as multi model straight assembly lines with batch production.
3.3 Research techniques
3.3.1 Literature review
Literature review is nothing but gathering all the available theories and research papers regarding the topic of interest, which enhances the knowledge we have with respect to the research topic and gives the knowledge which is required to carry out the topic of research. (Jesson et al., 2011). This research has a two-step approach in doing the liter-ature review, where the first step is the traditional review and the second step is the systematic review. In the traditional review process, papers were searched based on a set of keywords with all possible combinations such as Line balancing, Mixed model, Line optimizing, Customization, workload balancing, Precedence constraints etc. (Jes-son et al., 2011).
22
Later the systematic approach of the literature review was implemented where the pa-pers which were very close to the research topic and those which were helpful to build the research were chosen after reading the abstract and content of the paper.
Literature review in this research was used to build a theoretical base to understand the concept of Line balancing and for defining a few terms which are largely used in the concept of Line balancing. Literature review was also used to search for the research papers which deal with the Line balancing techniques which closely match to the line balancing scenario of the case study company which is Multi model single sided straight type. The papers which deal with the Multi model single sided straight type with its objective to balance the work load across the assembly lines are summarized in the theoretical findings sections.
The literature search was done using the three search engines Primo, Scopus and Sci-ence Direct, these three searching sites are relevant to articles related to technology. Because most of the advancements in line balancing are recent, time line filter was set between 1985 to 2017. With the term “Assembly line balancing” a total of 216205 hits in Primo, as little as 2632 hits in Scopus and 599829 hits in Science Direct were found. Since these are vast number of papers and the probability of having papers which are not relevant to this research was high, the combination of keywords such as Multi model line balancing, Line balancing constraints, Multi model, Single sided, Work load dis-tribution were added for the filter. Then the number of papers reduced to around 800 to 900. Further, the titles and abstracts were read to check if the papers can contribute to the aim and research questions of this research. For the papers which were in ambiguity with its content, the problem descriptions and the conclusions were read. Finally, 10 papers which were useful for this research were found. Later using the snowball tech-nique, few more papers were found which helped to build the whole report.
3.3.2 Interviews
Interviews are the most used data collection techniques for a case study, it is a technique which is used when you are planning to extract qualitative data and when it is hard to arrive at the desired information just with simple survey questions. With the interviews, a deeper knowledge is obtained on a specific case (Williamson, 2002). There are three distinct types of interview techniques which are structured, semi structured and unstruc-tured. The type of interviews adopted in this research was semi-structured where there was a scope to divert from the topic to a certain extent while giving knowledge on other topics which could be useful. There were definite set of questions designed in the inter-view guide, the interinter-view guide can be seen in the “appendix 2”. The interinter-view ques-tions were direct while the list of LB criteria listed from the literature review was given to the interviewees and asked for their relevance in the Electrolux context. Care was taken according to the interview guide to design the questions. These questions led to informal discussions about diverse topics while giving insight and deeper understand-ing about the company problem. Purposive samplunderstand-ing was done to pick the interviewee candidates who had key information of the subject and could contribute to the purpose.
23 3.3.3 Observations
Observations fall under ethnographic techniques. Observation is the most flexible data collection technique which is available. There is no proper defined way to perform ob-servations, they can be designed according to the context. There are a few ways in which the researcher can do the observations. The different types of observations are best ex-plained by (Glense and Peshkin, 1992) in their research.
For this research, the entire process was observed standing next to the participants in the participants point of view. This helped to identify some patterns of line balancing criteria and to observe rare failures which resulted in the stoppage of a whole line for one complete day (Williamson, 2002).
3.3.4 Document analysis
The historical documents are a collection of data. Relevant documents when observed and analyzed for over a period shall give a lot of information which might be helpful for the present research work being carried out (Williamson, 2002). In this research various documents from the case company were analyzed to find out if there is some information regarding the LB criteria. The documents which were analyzed include customer demand sheets, operator work instructions, product variation sheets, plant and line layout.
3.3.5 Data analysis
As this research is qualitative in nature, there is no proposed theory or a method by any of the researcher’s which can be followed to carry out the data analysis. There is liberty to perform the data analysis in one’s own way. Anyways, pertaining to this thesis the data analysis is done by taking the points into consideration mentioned in the research paper written by (Williamson, 2002). Firstly, all the data collected through observa-tions, semi structured interviews and historical research were transcribed onto paper. It was clear what to look out for in the transcribed data because the literature review was done well before. For example, the patterns such as yearly variations in products 520 and 595 were observed in the transcribed data. Once these data were found, they were categorized into different line balancing criteria. This helped in completing the analysis and concluding the report. Qualitative data is something which gives you a meaning or views of the researcher regarding a specific topic, and hence it is dealt with the qualita-tive data in this research, a deducqualita-tive approach was followed which allows to confine and group the collected data according to the research questions.
24
4
Findings and analysis
In the findings, authors arrive at the theoretical line balancing criteria from literature review, and the company-specific LB criteria through document analysis and inter-views. These data were compared and evaluated for its significance in the context of Electrolux. Also, the findings regarding LB theories with workload balancing and num-ber of workstations as its objective are shown and analyzed. Using all these above data the research questions are answered accordingly.
4.1 Theoretical findings RQ 1
Theoretical potential line balancing criteria:
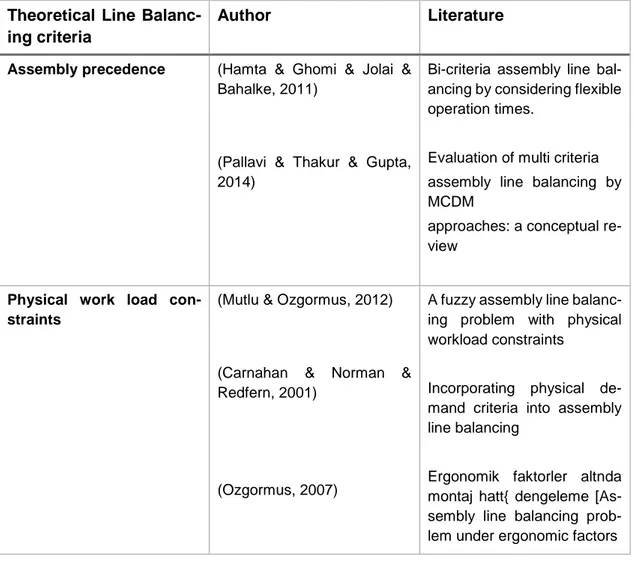
The literature review was done to figure out the various Line balancing criteria which researchers have given importance and applicable to the present case specific Line bal-ancing situation. After reviewing the literature, a list of criteria was found evident which are shown in the table below.
Table 1 Potential line balancing criteria found in literature
Theoretical Line Balanc-ing criteria
Author Literature
Assembly precedence (Hamta & Ghomi & Jolai & Bahalke, 2011)
(Pallavi & Thakur & Gupta, 2014)
Bi-criteria assembly line bal-ancing by considering flexible operation times.
Evaluation of multi criteria assembly line balancing by MCDM
approaches: a conceptual re-view
Physical work load con-straints
(Mutlu & Ozgormus, 2012)
(Carnahan & Norman & Redfern, 2001)
(Ozgormus, 2007)
A fuzzy assembly line balanc-ing problem with physical workload constraints
Incorporating physical de-mand criteria into assembly line balancing
Ergonomik faktorler altnda montaj hatt{ dengeleme [As-sembly line balancing prob-lem under ergonomic factors
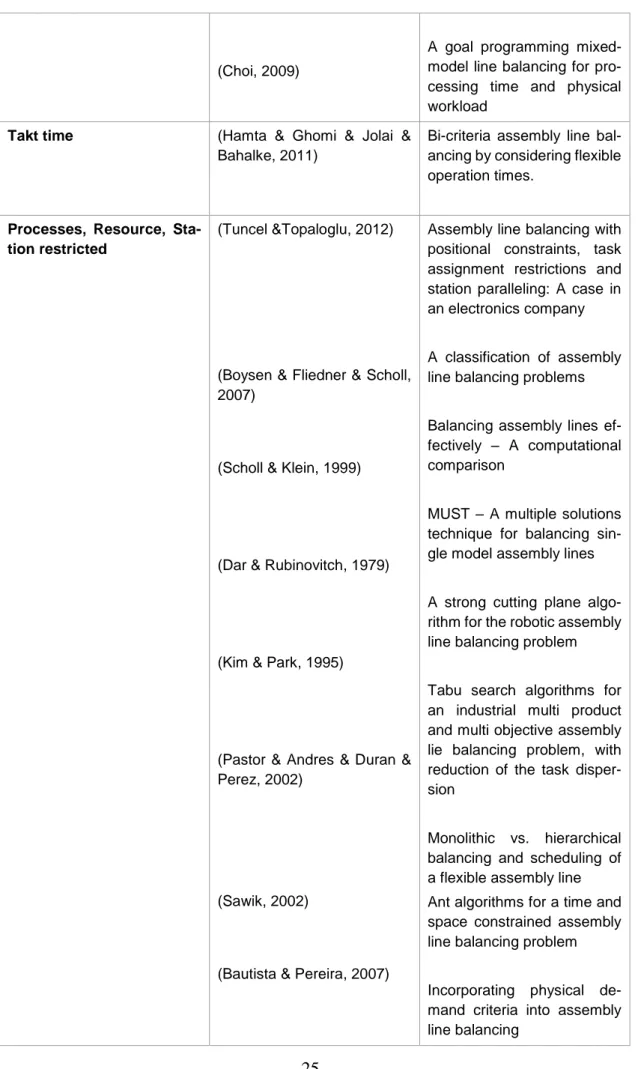
25 (Choi, 2009)
A goal programming mixed-model line balancing for pro-cessing time and physical workload
Takt time (Hamta & Ghomi & Jolai & Bahalke, 2011)
Bi-criteria assembly line bal-ancing by considering flexible operation times.
Processes, Resource, Sta-tion restricted
(Tuncel &Topaloglu, 2012)
(Boysen & Fliedner & Scholl, 2007)
(Scholl & Klein, 1999)
(Dar & Rubinovitch, 1979)
(Kim & Park, 1995)
(Pastor & Andres & Duran & Perez, 2002)
(Sawik, 2002)
(Bautista & Pereira, 2007)
Assembly line balancing with positional constraints, task assignment restrictions and station paralleling: A case in an electronics company
A classification of assembly line balancing problems
Balancing assembly lines ef-fectively – A computational comparison
MUST – A multiple solutions technique for balancing sin-gle model assembly lines
A strong cutting plane algo-rithm for the robotic assembly line balancing problem
Tabu search algorithms for an industrial multi product and multi objective assembly lie balancing problem, with reduction of the task disper-sion
Monolithic vs. hierarchical balancing and scheduling of a flexible assembly line Ant algorithms for a time and space constrained assembly line balancing problem
Incorporating physical de-mand criteria into assembly line balancing
26
(Carnahan & Norman & Red-fern, 2001)
(Johnson, 1983)
(Lapierre & Ruiz, 2004)
A branch and bound algo-rithm for assembly line bal-ancing problems with formu-lation irregularities
Balancing assembly lines. An industrial case-study
Product demand (Manuel & Chica & Óscar & Cordón & Sergio & Damas & Joaquín &Bautista, 2003)
A robustness information and visualization model for time and space assembly line bal-ancing under uncertain de-mand
Man power (Iskander & Chou, 1990) Unbalanced production line scheduling with partial job specialization.
Desired LB objective (Yong & Yeo & Yongkyun,1998)
(Bautista & Jaime, 2008)
(Chen & Lu & Yu, 2002)
A Heuristic Based Genetic Al-gorithm for Workload Smoothing in Assembly Lines
Minimizing work overload in mixed-model assembly lines.
A hybrid genetic algorithm approach on multi-objective of assembly planning prob-lem
4.2 Empirical findings
4.2.1 Company overview
Electrolux Ljungby consists of four major assembly lines which are established in par-allel. These lines are called as Lean A, B, C, and D respectively. The products assem-bled on this line include washing machines and dryers. Complete assembly is not done on these lines, there are other lines which does the sub-assemblies, then these sub-as-semblies are assembled in the assembly lines A, B, C and D. The product mix on these lines are categorized based on the product family and the part commonality which makes it easier for balancing the line and since most parts are common between the product mix, no special training is required for the lay men. The busiest line among all these is Lean B and the focus of our thesis is on Lean B for the same reason.
27
The Lean B assembles washing machines with model numbers 520 and 595. This Lean B runs at different takt times depending on the demand variations. Mostly this line works on 75% takt. Lean B has no room for buffers, the products move from one station to the other at the same instance, if there is a delay even in one of the stations then the whole line stops which is why it is very important to balance the lines in such a way that there are no stoppages. Lean B has 12 stations all together, assembly takes place between stations 1 and 7, 8 and 9 are testing stations and stations 10, 11 and 12 is where the packing is done. Whenever an assembly exceeds the takt time with a great margin on the line, the product is removed from the line and is sent to a separate area called as testing area where the remaining part of the assembly is completed and tested at the same station. Later the product is reintroduced at station 10 where the packing is done. Since the products produced on these lines 520 and 595 are same product family and the only difference is in the size of drums. Assembly precedence’s cannot be combined for two models because of the difference in the part sizes. These products are assembled in batches with batch sizes according to the demand.
4.2.2 Findings regarding RQ 1
When the term LB criteria is used, it means that these are the constraints which should be considered in balancing the line without fail.
In this section findings through interviews and document analysis are shown. Five semi structured interviews with four persons belonging to various levels of organization on the same assembly line. were conducted separately with the same set of questions. All the findings are shown below.
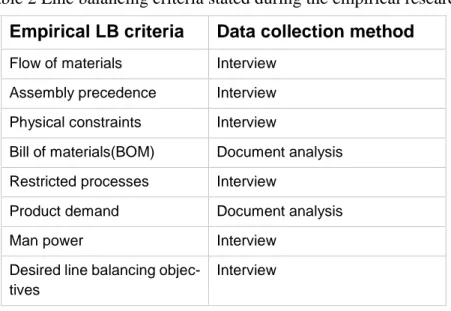
Table 2 Line balancing criteria stated during the empirical research
Empirical LB criteria Data collection method
Flow of materials Interview Assembly precedence Interview Physical constraints Interview
Bill of materials(BOM) Document analysis Restricted processes Interview
Product demand Document analysis
Man power Interview
Desired line balancing objec-tives
Interview
All the listed LB criteria in the case study are explained in detail as told by the inter-viewees at the case company and gathered through observations and document analysis. Supporting documents regarding the same are placed in Appendix.
28
Flow of materials
Some interesting information regarding flow of materials were obtained in the empirical study, this information helps us to draw some conclusions on how it affects the LB. The points below are a summary of the information gathered.
• All the raw materials are always refilled at the line (By a material handler) • Refilling the raw material on the line follows milk run concept.
• Production is planned on the available material in the super market. Hence there is no stoppage on the line once the assembly process is started.
• Daily production is planned by the planning department
• Material handler has all the information regarding the takt’s so that he knows how to refill the material in a right order and right place at the right time. Keeping track of the material flow inside the plant is of utmost importance for the as-sembly process to keep running without any interruptions. Case company has realized through various incidents that not keeping track of the material consumed daily, might lead to poor replenishing of the raw material which in turn lead to lack of material on time to continue the production. Hence the need for a system which records the material consumption, quality of material, material loss in rework etc. is important.
During the first day of the observations, it was observed that an entire assembly line (Lean A) had no production for the entire day and probably till the material arrives, due to the lack of material. In this case it was a single part which was crucial for the pro-duction while rest of the parts were available. Unavailability of even a small part can prove fatal to the company’s productivity. When asked about the same who was re-sponsible for that line, the operator said that keeping track of the material flow plays a key role in balancing the line, which helps to the assembly scheduling and product mix based on the available material in the master storage.
Assembly precedence
This constraint was observed in the work instructions available on assembly line, few important points are listed down
• All the processes in Electrolux follow assembly precedence.
• The work instruction provided for the operators on line were studied for the precedence.
• Since, Lean B is multi model assembly line and the two different models are manufactured in specific batch sizes, the precedence’s cannot be combined. There is a set of precedence’s attached with every individual product. Sequence of pro-cedures were observed for a few products through the documents such as work instruc-tions available on assembly line, which signifies the importance of precedence con-straints
Regarding the assembly precedence at Electrolux Ljungby, the products which were studied in this research (models 520 & 595) are bound with a set of precedence con-straints. This can also be generalized to all the models at the case company. These prec-edence constraints play a role in deciding the assembly process of each model
29
separately which also helps in fixing the cycle times. As the lines in the case company are multi model and not mixed model the models are produced in batches. Hence, there is no need to consider combining the assembly precedence of the different models on the same line. This empirical information regarding the assembly precedence was col-lected through document analysis and interviews. The interview question and the infor-mation deferred from it can be seen in the appendix. The type of document which was analyzed are the work instructions which are present on the assembly line for workers. As these work instructions documents were confidential it was not able to retrieve them.
Restricted processes
In the assembly line there can be few processes which are restricted with respect to the assembly process, precedence, man, equipment, positioning etc. This particular con-straint was not found prominently on Lean B but this was generally found on other lines in the company. Electrolux have a few products which are assembled on an assembly line because they have the right equipment to assemble that product only on that line. One such example comes from the model 590 which was assembled on Lean A, where the drum of the washing machine was huge and complicated to handle, it needs a special fixture to be fixed on. This assembly cannot be done on any other assembly lines avail-able. Hence, it becomes very important to make sure that product is assigned on the same line and station while balancing the line.
BOM
The BOM is associated with the flow of materials. The usage of materials should be updated in the BOM as soon as they are consumed in the assembly line. This entry should be made either manually or by a software. In case if the BOM consumption is not updated, it could result in unanticipated stoppage of the assembly line. This was seen during observations at the company, where an assembly line (Lean A) had stopped due to shortage of materials. Hence BOM is one of the main constraints which indirectly affects the line balancing process.
Product demand
After analyzing the documents related to the demand variations for past few years a few conclusions can be drawn. After reading the documents available from the case com-pany regarding the demand fluctuations from 2010 till 2017. It is evident that there are no prominent fluctuations in the demand over the period observed. The demand graphs are drawn using the data available from the document which is analyzed (Graphs can be seen in appendix). Very few instances are seen with unexpected fluctuations like 2014-12-04 where only model 595 had 100% while model 520 had 0% demands. In 2010-04-15 again model 595 had 100% while model 520 had 0% demand. Observing the demand trend, it is evident that the demand is deterministic. Product demand is also an important constraint to be considered as the production is planned prior in three days to meet to-day’s demand. This planning before three days is termed as TR3 technique in the company. For unplanned demand variations, there is a finished products inven-tory with approximately 1500 finished products. (capacity 2500)
30
Table 3 Average product demand for models 520 & 595 (Yearly)
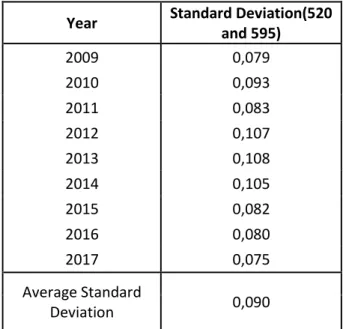
Table 4 Standard deviation in product demand for products 520 & 595 (yearly)
The average demand and the average standard deviation for the two models (520 and 595) through the years 2009 to 2017 is shown in the tables 4 and 5 respectively. This indicates that the early demand is stable and hence predictable. This information can also be used determine the emergency stock needed and in turn help to create a more efficient line balancing.
Man power
The case company have man power who are skilled equally to work on various models across the assembly line. These men work with different takt’s based on the possibility and the man power available. For example, laymen work with 75% takt and 50% takt which simply means that 3 men working on 4 machines or 2 men working on 4 ma-chines respectively. This was discussed during the interviews and it was also observed
Year Average demand
Model 520 Model 595 2009 88 % 12 % 2010 85 % 15 % 2011 84 % 16 % 2012 83 % 17 % 2013 83 % 17 % 2014 82 % 18 % 2015 83 % 17 % 2016 84 % 16 % 2017 83 % 17 % Total Average 84 % 16 %
Year Standard Deviation(520 and 595) 2009 0,079 2010 0,093 2011 0,083 2012 0,107 2013 0,108 2014 0,105 2015 0,082 2016 0,080 2017 0,075 Average Standard Deviation 0,090
31
at the assembly line where the men were working at 50 % takt while 2 of them were managing 4 machines.
The expectation of the case company through Line balancing is to vary this takt per-centage to the least possible and efficient way. Right now, the case company does a lot of man power balancing in various occasions. The company also like to continue to do the man power balancing along with the line balancing with other objectives such as work smoothening and work station reduction in future. Hence, man power is consid-ered as one of the criteria of LB.
Desired line balancing objectives
The line balancing is performed with various desired outputs. It can be to achieve lesser number of work stations, lesser lay men, lesser cycle times, balancing work load etc. The interviews conducted suggest that the product cycle time audits are done very fre-quently on the assembly line and hence they are not very keen to achieve optimized cycle times through LB. They also suggest that the workers are equally skilled in all the areas of production and hence they can put them on different jobs whenever desired which is not a problem again. But the company is very keen in balancing the work load equally as they face work over loads and idleness very often.
4.2.3 Findings regarding RQ 2
Theoretical general features of a LB software:
It was quite difficult to find the relevant literature regarding the features of different LB software, however a brief study of the user manuals and web pages of different com-petitive LB software’s such as Proplanner and Avix have helped establish a list of gen-eral features of a LB software and are listed below.
1. Integration of data and documents/ maximum control
Each balancing operation comes with its specific data and when such an operation is moved in the balancing sequence so does the data. Engineering changes will be easily reconciled in the balancing process.
2. Mixed model and option intelligence and analysis
When establishing a task assignment line balancing for all the products it is not enough to consider a few product variants when there are thousands of product variations in the line. This mixed model and option intelligence and analysis feature will identify com-mon tasks and unique tasks between the product modules. The data in the form of charts and report provide a detailed analysis of the different labour times that each module requires.
3. Multiple resources
Multiple resources tab allows several operators to work on different tasks simultane-ously, simple handling of various resources helps analyse setups with multiple ma-chines. Easy determination of time spent on different tasks and actual time necessary for different tasks.
32
4. Smart variant management
This LB feature makes it easy to see how different product variations will affect the workload on different stations and show the effect of different product mixes to the balancing.
5. Scenario management
Whenever a change is made in the balancing process, it creates a new scenario. Changes made in takt time, takt assignment, models etc create new scenarios and these scenarios will be saved and is assessable for further use.
6. Yamazumi chart
Yamazumi in Japanese means “stack” or “pile”. The Yamazumi chart is used to visual-ize the passive wastes, it is a lean management tool used to highlight workload between and within processes (Pieńkowski M, 2014). This feature will generate mixed model
Yamazumi charts which are easy to read and reassign tasks as required.
7. Virtual assembly
Visual confirmation of the balancing sequence eliminates errors in the actual assembly process. It helps engineers anticipate issues with their task assignment by viewing the progression of the assembly process.
8. Value added analysis
Charts that display value added, non-value added and supporting work are generated using this feature. This data will be extracted from initial time studies done on the dif-ferent activities of assembly lines.
9. Constraints
Physical and other type of constrains such as precedence, tools that are required for certain tasks, work zone, task groups that much be performed in the same station, in-spection or other tasks that cannot be performed at the same station etc will be consid-ered in the balancing process.
10. Reporting
Balancing summaries and comparison, standard work documents, parts and tool sum-maries etc will be available when required.
Assembly planner user manual. (2015) and Assembly planner website. (2018) and Avix PLM software website. (2018)
4.3 Analysis
4.3.1 Regarding RQ 1
In this part of the chapter the credibility and the importance of the line balancing criteria which were observed by the company are compared and analyzed. The interviews con-ducted in the company and line balancing criteria in the literature are also analyzed. All the criteria found through literature and case study are represented in a table and they are marked according to who has mentioned about it in the interview and literatures.
33
This gives a clear idea about which criteria are most important and should be considered before any line balancing problem.
I 1 – I 4 in Table 5 are the interviewees who all belong to the case company designated at various levels.
I 1 is EPS manager I 2 is Project manager I 3 is Line leader
I 4 is laymen on the production line
Table 5 Analysis by comparing the theoretical and empirical LB criteria
LB Criteria I 1 I2 I 3 I 4 Literature Observations Ranking
based on number of occurances in the findings Flow of materials × × × 3 Assembly precedence × × × × × × 1 Physical constraints × × × × × 2 BOM × × 4 Restricted processes × × × × × × 1 Product demand × × × 3 Man power × × × × × 2
According to the number of times the occurrence of LB criteria in various occasions such as literature studies, interviews and observations, they can be ranked with their priority levels.
Assembly precedence, restricted processes, desired line balancing objectives fall under the most valued line balancing criteria according to the analysis. Followed by physical constraints and the man power in the ranking as these were not talked by two interview-ees when interviewed. Flow of material and BOM are the two criteria which are of less priority, but these should still be considered as these were said by the key members of the organization who are working very close to this research work.
As the company is now in the transition phase from manual way of working to an au-tomated software which deals with their line balancing problem, while considering a software which can handle line balancing problem which perfectly fits into the case study situation, the software should be able to consider all these constraints while de-fining the LB problem on software.