Bachelor thesis 15HE credits
Electrical Power Engineering 2014-05-25
Serial No. EL1405
Department of Applied Physics and Electronics, Umeå University
Lastområdesutvidgning med aktiv
flödeskontroll i Francisturbiner
Expanding operation ranges using active flow control in
Francis turbines
~ ii ~
Acknowledgements
I want to thank all personnel at Jämtkraft that has been very helpful and provided with experiences and information about their facilities. Also I want to thank my handlers Michel Cervantes at LTU1, Talib Morad at UMU2 and Peter Palmqvist at Jämtkraft for the aid they have provided with.
I want to thank Knut Magne Olsen, technical chief at Troms Kraft who has been very helpful and given a well guided tour at Skibotn power plant. I also thank Torbjørn Kristian Nielsen for the study visit at NTNU3.
For technical information I want to show special gratitude towards Håkon Francke at FDB4 that has shared and allowed presentation of his test results and extensive knowledge about the water injection technique.
I thank Patrick March at HPP5 Inc for allowing presentation of his graphical findings regarding aeration techniques and efficiency.
For allowing publication of research material I thank Smith Brennan T, Sabin Mathew, Jo Magnus Solberg, Patrick March and Håkon Francke.
I also thank Henrik Lindsjö at Andritz Hydro and Urban Andersson at Alstom for discussions and practical perspectives on ae ration techniques.
For economic information I show large gratitude towards Morten Kjeldsen at FDB for making an economic estimate of installing the peripheral water injection system at the case study.
1
Luleå University of Technology
2 Umeå University
3 Norwegian University of Science and Technology 4
Flow Design Bureau
~ iii ~
Sammanfattning
Denna rapport innehåller en undersökning av fluidinjiceringstekniker för att reducera skadliga flödeseffekter i sugröret hos Francisturbiner som arbetar utanför optimal last. Det finns ett fokus på implementerbarhet hos Jämtkrafts anläggningar och två vattenkraftverk har undersökts som är
placerade i serie med varandra vid namnen Lövhöjden och Ålviken. Det enda lönsamma scenariot som upptäcktes med en viss grad av säkerhet var en ökning av lastområdet uppåt för att tillåta överlast. Upptäckter visade att både luft och vatten kan införas på olika platser för att förbättra hydraulisk verkningsgrad kring turbinens delar såväl som att reducera tryckpulsationer i skadliga lastområden. Investeringar i sådana system har visat sig vara användbara och lönsamma på flera platser med dåligt anpassade manövreringsvillkor. Men på grund av förluster i effektivitet då injektionssystem körs visar det sig olönsamt i situationer där de inte förbättrar lastområdet på ett sådant vis att det resulterar i ökad årlig eller topp-produktion.
~ iv ~
Abstract
This report contains an investigation of fluid injection techniques used in the purpose of reducing deleterious flow effects occurring in the draft tube of Francis turbines when operating outside nominal load. There is a focus on implement ability at Jämtkrafts hydroelectric power plants and two power plants were investigated, located in series with each other named Lövhöjden and Ålviken. The only profitable scenario found with some degree of certainty was an increase in the operating range upwards to allow overload operation.
Findings show that both air and water can be introduced in various locations to improve hydraulic efficiency around the turbine parts as well as reduce pressure pulsations in harmful operating regions. Investments in such systems have proven useful and profitable at several facilities with poorly adapted operating conditions. But due to losses in efficiency when operating injection systems, it turns out unprofitable in situations where it does not improve the operating range in a way that is resulting in increased annual or peak production.
~ v ~
Table of contents
Acknowledgements ... ii Sammanfattning... iii Abstract ... iv 1 Introduction ... 1 2 Aim ... 23 Method and sources ... 2
3.1 Air injection ... 2
3.2 Water injection ... 2
4 Structure ... 2
5 Theory ... 2
5.1 Francis turbine ... 2
5.2 General flow characteristics ... 4
5.3 Deleterious flow effects ... 6
5.3.1 Vortex breakdown ... 7
5.3.2 Vortex rope ... 8
5.3.3 Hydro acoustic resonance ... 9
5.4 Countermeasures ... 10
5.4.1 Air injection ... 10
5.4.2 Water injection ... 13
5.4.3 Other countermeasures ... 21
5.5 Case study Lövhöjden power plant ... 24
6 Results ... 26 6.1 Technical summary ... 26 6.1.1 Air injection ... 26 6.1.2 Water injection ... 29 6.2 Economic summary ... 40 6.2.1 Air injection ... 41 6.2.2 Water injection ... 41 6.3 Case study... 42
7 Analysis, discussion and conclusions ... 43
8 Proceeding work/Research/Recommendations ... 44
~ vi ~
Nomenclature
Following physical quantities are mentioned in the report; they are explained individually in the text [ ] [ ] [ ] [ ] [ ] [ ] ̇ [ ] [ ] [ ] [ ]
Following abbreviations are used in the report
~ 1 ~
1 Introduction
Today hydropower acts as an important part of the Nordic electrical grid due to capabilities of storing fuel and varying production of both active and reactive power. The ability to sell regulating power is becoming increasingly desirable with establishment of the north European power market NORDPOOL together with development in intermittent power production sources. Investments to increase power production in facilities using renewable resources are also eligible to receive electricity certificates in the EU, a factor that increases incentives to invest in hydropower drastically.
Most hydropower plants equipped with reaction turbines, especially Francis, are only able to produce power within a limited operational range around BEP6 of the turbine. Undesired operational modes usually exist due to the occurrence of deleterious flow effects in the turbine runner and draft tube when operating at part loads. These effects are mainly pressure surges due the draft tube geometry and residual swirl in the flow entering the draft tube. The residual swirl is due to mismatch in angular momentum provided by the guide vanes and the angular momentum extracted by the turbine, resulting in uneven mass transfer of water to its surrounding structure. Some periodic fluctuations even risk falling inside the resonance frequencies of the water system, leading to so called hydro-acoustic resonance, causing hazardously large vibrational amplitudes.
Water flows needed to maintain the rivers in accordance with water-rights judgments or to maintain downstream reservoirs are often so low that they fall outside the acceptable operational range of the turbine. This can lead so scenarios where water is spilled pass the turbine without utilizing it for power production. Also a normal production scheme is to run a facility at max efficiency during peak hours and stop it at lower price periods in order to maximize the extracted profit from water reservoirs, a scenario in which the equipment may suffer many and harmful annual start and stop cycles. Countermeasures can be made to reduce destructive flow effects, resulting in increased plant availability that in turn reduces conflicts of interest in power production planning and reliability viewpoints. In some cases it is possible to increase the annual power production at a hydropower facility by being able to utilize smaller flows then originally designed for. Many countermeasures include physical inserts in the draft tube or turbine, something that risks having a negative impact on the turbine efficiency at BEP.
This study is focusing on the investigation of two techniques where fluid is injected in the draft tube flow in order to reduce the pressure surge phenomena’s. Water and air are the working fluids in these systems and even with consideration to their differences they have both been proven to produce positive results and can both be turned off to operate at BEP. Pay-back times of these investments has in the most successful case been a few months, but most facilities are too small to make a noticeable profit or have already solved the operational range problem by installing several turbines in parallel or are using turbines with extended operating range.
The goal is to attain knowledge about implement ability and profitable scenarios related to these techniques at hydropower stations owned by the job requestor. Also a presentation of the problems present at the undesired operating modes of the Francis turbine should be made. Information is gathered via research of literacy and company documentation as well as from adepts within the field. Results show a good degree of overall system implement ability and an operating environment with low economic incentives at all enquired facilities.
6 Best Efficiency Point
~ 2 ~
2 Aim
The aim of the project is to make an economic and technical investigation of two fluid injection techniques. The fluids injected will be air and water which will have different effects, system structure, investment costs, planned installation time and technical properties.
A case study shall be made at Lövhöjden, an 8,5MW plant with 99m water head, annual production of 24GWh and is owned and operated by Jämtkraft. The goal is to appreciate the technical implement ability and economic environment surrounding the investment of both the water and air injection systems.
3 Method and sources
3.1 Air injection
A literacy study and discussions with adepts at Alstom and Andritz Hydro will act as the fundament for the theoretical understanding of the air injection system.
H. Lindsjö at Andritz Hydro is consulted to make an economic estimate of the installation costs of an atmospheric air injection system at the case study.
3.2 Water injection
The theoretical understanding will be built from literacy research, meetings with adepts at NTNU and FDB. Also a visit is made to Skibotn, a 72MW facility owned and operated by Statkraft, utilizing the water injection system. At FDB H. Francke provides with results from the systems and M. Kjeldsen is consulted for an estimate of the installation costs at the case study.
4 Structure
The report starts with a theoretical introduction of turbine equipment, its related problems and a description of countermeasures to these problems as well as a description of a certain case study. Following the theory is a results chapter which consists of technical and economic summaries of the air and water injection systems separately, referring to results from several documented scenarios. The results chapter ends with the case study findings. The report is finished with an analytical discussion about attained results and further research.
5 Theory
This section concerns some basic theory surrounding the investigated phenomena’s and techniques. It is presented to give a general understanding of the key factors.
5.1 Francis turbine
The Francis turbine is the most commonly used turbine in hydropower plants globally and can be designed to utilize a large range of water heads with high efficiency. Most Francis turbines suffer a common problem related to pressure surges in the draft tube occurring around half load and operating at these loads is therefore avoided. To explain the Francis turbine makeup, a short review of its parts is presented below. They are presented in the same order as water is passing through the turbine. A cut through picture is seen in Figure 5-1
~ 3 ~
Penstock – Provides pressure potential and flow of water to the spiral casing. Pressure is exerted by the weight of the above water head.
Spiral Casing – Surrounding the runner with spiral geometry of area decreasing with its length, this is to maintain uniform velocity to the stay vanes. This structure is housing the stay and guide vanes that are spatially distributed around the runner in the center.
Stay vanes – Fixed fins that convert pressure potential to kinetic energy and are reducing swirl of the inlet flow by aligning the direction of the flow towards the runner section.
Guide vanes – Movable fins that are used to regulate flow rate and the angle of attack to the runner. These are connected in a circular structure called a wicket gate, which can be moved hydraulically to change their position simultaneously.
Runner – Converts kinetic energy and pressure potential energy in the water to torque
transferred by the shaft. Water enters radially and leaves axially exerting both impulse and lift force to the runner blades.
Draft tube – Connects to the runner outlet and converts kinetic energy to pressure potential due to a diffusing geometry meaning an area increasing along its length.
Shaft – Connecting the turbine runner and generator rotor and is transferring the torque extracted by the runner from the water. This part is not characteristic for the Francis turbine but can due to its sometimes hollow structure be used as an air path when injecting air and is due to the nature of this report mentioned here.
Figure 5-1 – Francis turbine [1]
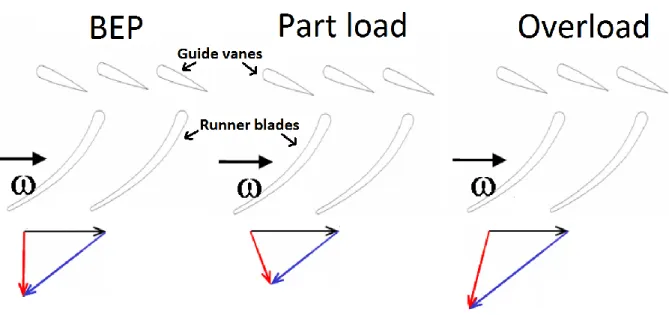
When water is leaving the turbine operating at BEP and enters the draft tube, its velocity profile should ideally consist only of an axial and no angular component. When the turbine is operated in part or over load modes the swirl generated by the wicket gate in the spiral casing is not matching the angular momentum extracted by the runner, hence leaving a residual rotational velocity component at
~ 4 ~
the runner outlet. Direction of water flow leaving the runner is depicted by the red vector in Figure 5-2.
Figure 5-2 – Velocity distribution for water leaving Francis runner at BEP, Part load and Overload
The residual swirling velocity is thought to be the cause of severe pressure surges in the draft tube and it is noted that at part loads the swirling flow is rotating in the same direction as the runner and at over load the swirl is rotating in the opposite direction of the runner.
Difference in pressure at runner and guide vanes varies with the difference in water head over the turbine. Power plants with large head variation may suffer operational problems due to the difficulties in designing a turbine runner that can handle the different operating regimes sufficiently.
5.2 General flow characteristics
A general understanding of the relation between pressure, elevation and velocity in a fluid flow can be achieved by studying a simple one dimensional version of Bernoulli’s principle as presented below
is relative velocity in a control region [ ] is gravitational acceleration [ ]
is elevation [ ]
is pressure in the control region[
]
is density [ ]
The equation is expressing continuity of enthalpy in the flow where the effect from changing each variable easily can be mirrored into the others. The inverse relation between pressure and velocity is of most importance when studying flow behavior since it can give a simple understanding of effects such as cavitation and pressure pulsations.
~ 5 ~
It should be noted that the Bernoulli expression above is valid for laminar flows and the flows discussed in this report is turbulent patterns and breakdown of these into less structured turbulent flows.
Using Darcy-Weisbach equation for turbulent flow the only addition is a decrease in the relation between pressure loss and velocity relative to the decreased in wall friction as velocity and Reynolds number increases.
A dimensionless number used to describe the amount of swirl present in the flow is the so called swirl number S, which is defined as the ratio between angular and axial momentum in the studied boundary as depicted below. The axial velocity profile of the draft tube flow at runner exit for different swirl numbers is depicted in Figure 5-3 below.
Figure 5-3 – Expected axial velocity profiles in the draft tube at different swirl numbers [2]
An increase in the swirling velocity component will result in increased axial velocity around the draft tube edges and a reduction in axial velocity at the center of the tube.
In swirling flows the velocity relative to the surrounding fluid can become very high and if
recirculation starts to occur in the central region of the flow, the water at the boundaries of this region experiences very large differences in relative velocity which results in a drastic decrease in pressure.
~ 6 ~
5.3 Deleterious flow effects
Pressure surges are normally divided into synchronous and asynchronous types, both of these types can cause effects in the flow which might show harmful to the plant infrastructure. The effect believed to be most harmful and mainly responsible for the draft tube pressure surges are named vortex
breakdown and vortex rope, these are discussed in this section and are depicted in Figure 5-4 below.
Figure 5-4 –Low part load, normal part load, high part load and overload draft tube vortices
Pressure surges can propagate through the whole hydraulic system and even cause pressure and head variations in the penstock. Some problems associated with draft tube surges include severe vibrations, noise, power swings, bearing and shaft run-out, and increased stress on the runner.
Although it should be noted that statistical investigation covering 34 low head Francis runners manufactured the years 1928-1967 with heads between 20m to 80m shows that the number of yearly starts and stops together with the height of water head has the strongest negative correlation to the turbine lifetime. [3]
This suggests that the start stop problem is more prominent and that it is not only desirable to decrease pressure pulsations at part loads in order to increase the permissible operating range. But it can also be interesting in cases where it is possible to decrease the number of yearly start and stop cycles as a result of the extended operating range.
~ 7 ~
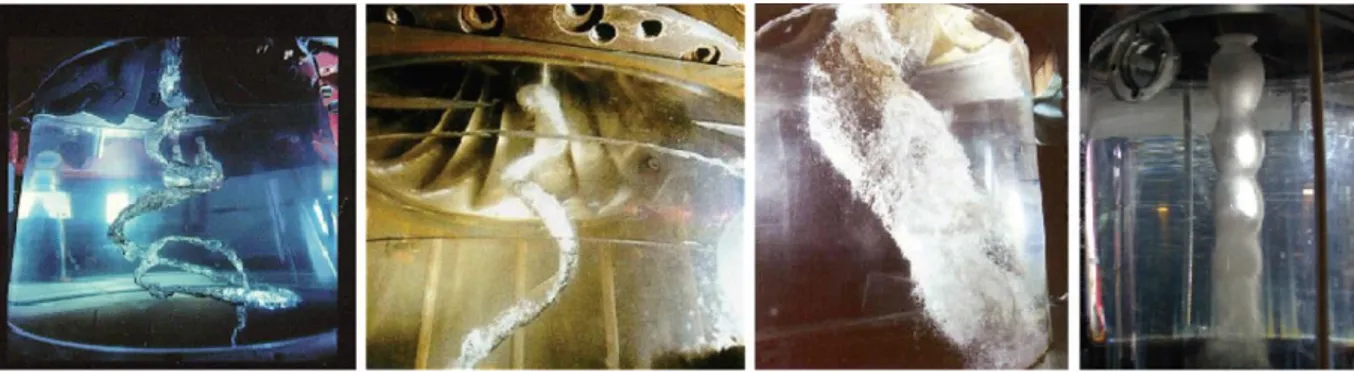
5.3.1 Vortex breakdownAs the swirl increases to a critical level, a sudden change of the flow characteristics can be observed. Namely a reverse flow starts in the stalled center region, see Figure 5-3. A helical vortex will form at edges of this reverse flow region. In this boundary the pressure can decrease to vapor pressure, causing evaporation. The water gas bubbles will make the vortex visible and when such a flow structure occur the phenomena is called vortex breakdown. See Figure 5-4
It should also be mentioned that the axial velocity of the water flow usually is depicted as a steady profile with non-changing vector sizes. When recirculating flow occurs there is a discontinuous break in the velocity profile, called boundary layer separation.
As the flow continues along the positive pressure gradient in the draft tube, the vortex is gradually loosing kinetic energy until the cavitated core condenses and the vortex dissolves into turbulent flow in almost all cases. When the cavitated bubbles collapse to liquid there is a resulting pressure pulse. Some flow patterns can be termed regular and some irregular. Laminar flow and synchronous flow patterns can then be seen as regular. As turbulent and unstable flow patterns can be seen as irregular. A depicted test setup using dye injection to picture a helical vortex flow pattern is seen in Figure 5-5.
~ 8 ~
5.3.2 Vortex ropeThis flow pattern is the most severe cause of efficiency reduction and pressure fluctuations experienced by most Francis turbines at part load. These fluctuations can in extreme cases even propagate to the electrical grid due to the oscillating pressure experienced by the runner. This is more prominent in facilities that have a considerably small amount of rotational mass.
The residual swirling component left in the flow due to off design operation of Francis turbines is entering the expanding and often non-conical geometry of the draft tube. This is causing uneven pressure increase as well as velocity decrease in the flow, resulting in a change in the rotational axis of the swirl. This gives as a result a helically precessing vortex rope, such as depicted in Figure 5-6. This vortex rope is rotating at the so called Rheingans
frequency, which is found to be in the region of about ¼-½ of the runner frequency but is empirically found to be
of the runner frequency. [4] Any stationary point in
this region of the draft tube will experience uneven mass transfer and pressure pulsations as the vortex rope rotates, see Figure 5-7.
This flow pattern is quite robust and is rotating uniformly and regularly. At the limits of the range of its occurrence it can however become intermittent as neighboring flow patterns become prevalent. [5]
The length of the cavitated core is related to flow speed and when the cavitated vortex core or parts of it
implodes, sharp pressure shocks are produced. This happens in flow regions between two different flow patterns which can occur at different loads in the draft tube as the velocity and pressure changes along its length. This vortex has received many names such as helical vortex, spiral vortex, corkscrew vortex and the term vortex rope
which is used in this report. The rotating motion around its axis has been termed the precession of the vortex. [6]
Figure 5-7 – Pressure signal from rotating vortex core at a fixed point in the draft tube
~ 9 ~
5.3.3 Hydro acoustic resonanceAll structures in nature resonate at a certain frequency and can be associated with springs whose resonant frequency is depending on its mass and stiffness/rigidity. Just as potential energy and kinetic energy is exchanged between each other in the oscillating motion of a spring is the potential and kinetic energy within a material structure is exchanged between each other in a periodic manner as it oscillates. This exchange will result in positive interference if oscillating forces are in phase with each other in the systems characteristic frequency. This causes amplification of the oscillation amplitudes and something that becomes highly undesirable in the maintenance and reliability point of view. The resonance frequencies of the water way system is usually quite low, somewhere between a few Hertz to a few tens of Hertz and in most cases lower then 200Hz. The frequency of the so called water hammer phenomena is related to the length between two free water surfaces and the propagation speed of acoustic waves in the water as in the manner expressed below:
is the acoustic propagation velocity
is the length between two free water surfaces
The Rheingans frequency usually has the largest pressure amplitude in the hazardous frequency range but pulses that are tuned with the resonance frequency will not need high amplitudes to cause severe vibrational swings.
The following frequencies are commonly found in relation to Francis turbines: [7] Runner frequency: [ ]
Runner blade frequency: [ ] Guide vane frequency: [ ] Rheingans frequency: [ ] is the runner rotation speed
is the number of runner blades is the number of guide vanes
It is believed that higher frequencies that is originating from the runner often is suppressed by the dynamics of the vortex rope and Rheingans frequency is the most prominent frequency related to the draft tube surge. Even though the wake flow between rotor blades and guide vanes and the draft tube surge exist at different locations and is usually viewed as separate phenomena, they are likely to influence each other. [8]
It has also been stated that the pulsation of the overload vortex is corresponding to one of natural frequencies of the water way system [9]
~ 10 ~
5.4 Countermeasures
In this section the theory related to countermeasures is investigated. The air and water injection technique is in focus and it should be mentioned that both systems can be operated in such ways that they cause additional problems instead of reducing them. However, a great advantage in comparison to fixed structure inserts as a countermeasure.is their adjust ability. Making it possible to tune the
systems to each operating point and shut them off when desired. Countermeasures can be categorized either as passive or active depending on energy expenditure and the existence of a control loop. 5.4.1 Air injection
As will be seen in the next section regarding other countermeasures, there has been various techniques tested to reduce the impact of the draft tube pressure pulsation and air admission is one of the most commonly used of these. A turbine is delivered with a rated operating range and air injection will usually be implemented if it is required in order to meet delivery agreements.
Air will mitigate to the low pressure zones in the flow, drastically changing the pressure dynamics in the flow along its path. The air path is mainly determined by the flow speed and the location of
aeration points. Air can be introduced at several locations, both above and below the cavitation zone of the runner and can either be ejected using compressors or sucked from the atmosphere by the low draft tube pressure. Figure 5-8 depicts some possible admission locations of air.
Figure 5-8 – Section view of Francis turbine with different aeration techniques shown [10]
When injecting air into the draft tube flow the resulting air/water mixture will have a dramatically reduced dispersion speed of longitudinal compression/decompression waves; i.e. pressure pulsations. These waves are of the same nature as sound waves and since the harmonic content and the amplitudes of studied draft tube flow phenomena fall outside the definition of sound, the notation acoustic waves are used.
The reduced propagation speed of acoustic waves occurs mainly since the mixture inherits properties of compressibility from the air and density from water. It is also conceivable to deduct that the
~ 11 ~
temperature in the mixture will deviate slightly when introducing air, however the influence of the thermal properties of the mixtures on the wave propagation speed is neglect ably small in comparison to the mechanical properties.
Dangerous frequencies that can exist in the working fluid are the ones coinciding with the natural frequencies of the water system and the materials in contact with it. Pressure pulsations of these frequencies are critical to avoid in a maintenance and reliability point of view and can both be induced and reduced using air injection.
Special aerating turbines have been developed due to the environmental interest of maintaining aquatic habitats by increasing levels of DO7 in the water. This need is strongest in warmer regions and the turbines are designed to minimize efficiency losses due to the air injected, the loss in efficiency is however considerable large in most cases.
Aeration can also be made through check valves mounted at the draft tube periphery, this aeration technique mainly concerns problems with DO but may due to its simple installation procedure provide with an easy solution in some special flow problems. [11]
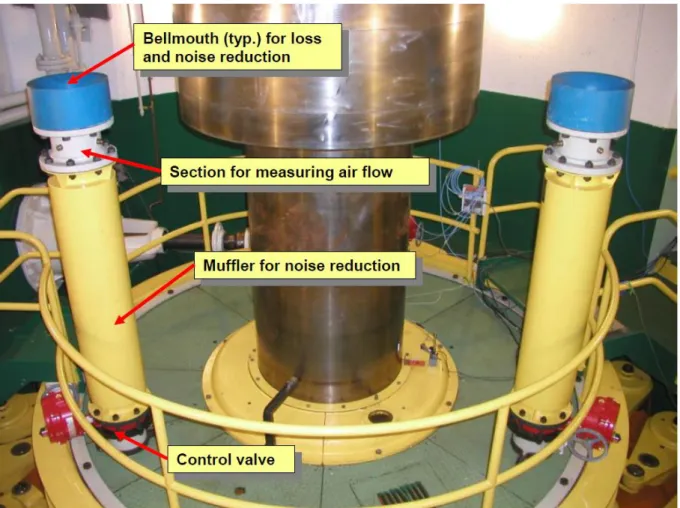
In general, a air injection system normally consists of the following parts seen in Table 5-1 [10] Air Intake Designed intakes to reduce pressure losses and noise levels at the
intake, typically bell mouths
Properly designed intake can be used for air flow measurements Air Flow Instrumentation A variety of technologies are available, some examples are Venturi
meters, Orifice plates, Pitot static tubes, Hot-film anemometers, Bell mouth inlets, Calibrated elbow meters with velocity measurements And depending on the air flow meter selected it might be
complemented with Manometers, Thermometers, Barometers and/or Hygrometers
Type of instrumentation is depending on the intension of the system Sound Mufflers Designed noise dampers to reduce noise to a safe level without
decreasing the air flow significantly
Control Valves Valves used to regulate the air flow, these may be operated manually, remotely or by a control system
Air Supply Piping Structural air paths to the aeration points. Vacuum breaker systems usually have too narrow air paths for supplying enough air flow. The shaft is in many cases hollow and can be used as a good air path, usually through the generator
Check valves Used for unidirectional flow, some check valves that can be used are Ball check valves, Lift check valves, In line check valves and Swing or tilt check valves
Control system Computer system monitoring air flow and regulates control valves. Injection holes Designed holes or nozzles at the injection points that usually is either in
the spiral casing, the draft tube, the runner blades trailing edge, the runner cone or in an aeration ring mounted on the runner
Table 5-1 – Typical air injection system components
7 Dissolved Oxygen
~ 12 ~
Table 5-2 shows physical quantities of interest when evaluating aeration systems, separated into performance aspects.
Mechanical performance Hydraulic performance Environmental performance Turbine efficiency
Maximum power output Cavitation levels Vibration Shaft run-out Thrust load Aeration-influenced efficiency change Airflow
Pressure at aeration outlets
Change in DO uptake Total dissolved gas TDG Other water quality parameters Airflow
Table 5-2 – Measureable performance aspects of interest when evaluating aeration systems
Air introduced in the runner can most easily be taken from the bearing gallery and through the shaft and generator. Peripheral air can be supplied from the machine room where the draft tube is mounted. In Figure 5-9 is a picture of air inlets used for distributed aeration mounted in the bearing gallery.
Figure 5-9 –Francis distributed aeration system inlet, bearing gallery [10], [12]
Escudier, M states that the air injection at the center of the recirculating region will produce a stable axis-symmetric flow with an air core surrounded by the swirling water; this is the blue path in Figure 5-8. Air injection is said to change the breakdown form from a spiral to a bubble. [13]
Central air injection results in a quick efficiency reduction with increased air flow, the technique with least efficiency losses attributed is distributed aeration followed by peripheral aeration. [12] More is presented about this in the results section.
~ 13 ~
5.4.2 Water injectionInjecting water as a countermeasure to the draft tube swirl is a relatively new method but several solutions already exist. It can become efficiency neutral due to the increase in draft tube and runner efficiencies counteracting the losses due to water bypassing the turbine blades. Systems where water is injected through the runner cone and draft tube walls has been found [13] and this study focuses on the latter of these.
The water injection system focused on in this report has been installed at Skibotn power plan, Owned and operated by Troms Kraft Produksjon. This system is developed by M. Kjeldsen and uses specific flow rates through nozzles that are mounted at the draft tube walls. They are mounted at a horizontal and vertical angle to the draft tube and are located at a distance from the runner, as depicted in Figure 5-11 below.
Figure 5-11 - Vertical and horizontal angles spatial representation [14]
Water is usually taken from the penstock where pressure already exists, but can also be pumped when water head is low or when other water sources are used. Such alternative water sources could be from the spiral casing or further down in the draft tube. [7]
The water jet provides angular momentum to the fluid in relation to the mass flow, velocity and the radius from the center of momentum in the manner depicted in the below expression and in Figure 5-10.
̇ [ ]
Due to the large inertia of moving water in comparison to air, it is possible to change the flow characteristics dramatically by only using small volumes of fluid. This technique aims to counteract the swirl by introducing a counteracting swirl momentum. It can also, delay or avoid boundary layer separation by energizing the boundary layer. [14], [15]
~ 14 ~
H. Francke [14] states that there are many degrees of freedom related to the nozzle system such as vertical and horizontal alignment of nozzles as well as variation in flow rates and geometry. Also different number of nozzles could be used at different distances from the runner. All variables are depending on the operating conditions and the turbine. The expected results from the water injection system are presented below:
- Reduction in swirl strength
- Reduction in vibrations and pressure pulsations
- Help filling the center of the draft tube and smoothen the velocity profile (boundary layer) - Better utilization of the draft tube, thus better draft tube efficiency
- Increase in the Francis turbine operating range
In general, a water injection system normally consists of the following parts seen in Table 5-3
Water Intake Water can be taken from lower parts of the draft tube, the penstock, the spiral casing or from other accessible water source
Pumps Used to give sufficient flow rates to the injection system. Taking water from a penstock with sufficient water head can avoid the need for a pump.
Water flow measurements Various techniques used to measure the discharged water flow. Such techniques are mechanical, pressure-based, optical, acoustic, thermal or induction based.
Water piping Pipes that conducts the water from intake to exit
Valves Manual, safety and automatic valves. Automatic and safety valves can be remotely or automatically controlled with software or mechanical feedback
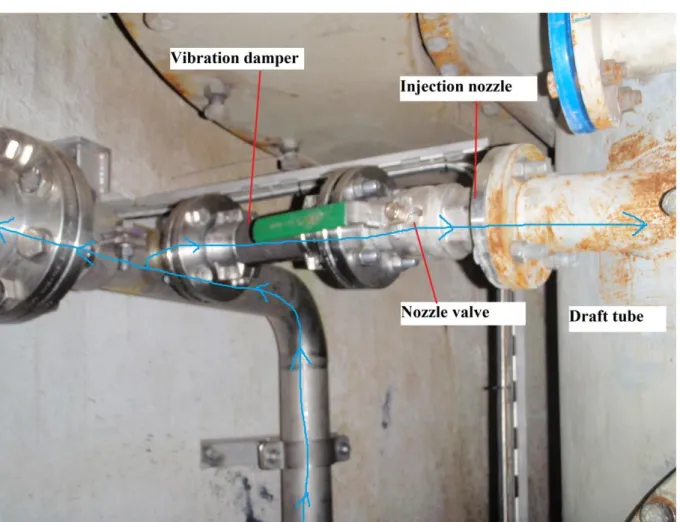
Vibration dampers Dampers in series with the piping in order to reduce vibrations propagation
Feedback transducers Usually vibration and pressure transducers but also other transducers such as spatial measurements may be used as feedback
Control system Computer system monitoring operating conditions with feedback from transducers and regulates the nozzle flow in accordance to stored calibration data
Exit nozzles Nozzles designed to give proper water jet without harmful noise
Table 5-3 – Typical water injection system components
In Figure 5-12 to Figure 5-17 on following pages are pictures of the water injection system installed at Skibotn power plant presented. The direction of water flow is indicated with a blue arrowed line. Pressure transducers have been mounted on valves as visible, something that really simplifies their installation procedure.
~ 15 ~
In Figure 5-12 is the control system overview tab visible, also providing with a schematic model of the system. Noteworthy is that a lockable manual valve is omitted from this overview that is visible in Figure 5-13 on the following page.
Figure 5-12 – Water injection control system overview
The nozzle flow set points used in the software is found from field tests at each operating point using feedback from the mounted transducers and stored in a database. Operating condition is measured with a system sample rate of 1000Hz and incorporates data from the last minute when changing output commands, which happens 4 times per second.
~ 16 ~
Figure 5-13shows the beginning of the water injection system with its connection to the penstock shown. Two manual valves where one is lockable, a water hydraulic safety valve and one automated regulating valve are coupled in series before entering the nozzle system inlet.
~ 17 ~
Figure 5-14 shows the automated regulating valve and the nozzle pipe pressure transducer. This part was hidden in Figure 5-13 and regulates the water flow from the penstock to the nozzle system inlet. The valve is of the brand AUMA and is equipped with a motor and can be regulated by the control system.
~ 18 ~
After the water has passed the automated regulating valve it enters the so called nozzle system inlet seen in Figure 5-15. Here a pressure and a vibration transducer is mounted. Downstream from this part are the nozzles.
~ 19 ~
Figure 5-16 shows the most upstream nozzle in the system with its manual valve and vibration damper. Water that is continuing at the left in the picture is connected to the two downstream nozzles. Nozzles are mounted approximately 250mm downstream the runner, L/D=0.19 in Figure 5-11. The flow can be varied between 0-220l/s, which is approximately 1.2% of the nominal flow of 18 .
~ 20 ~
Figure 5-17 shows the draft tube with the two first nozzle connections visible. The water continues on the right side behind the draft tube to the third nozzle. Residual transducer valves and nozzle
connections from field tests are visible. To the left can be seen the vibration transducer and its intended position, this was not mounted at the time of visit.
~ 21 ~
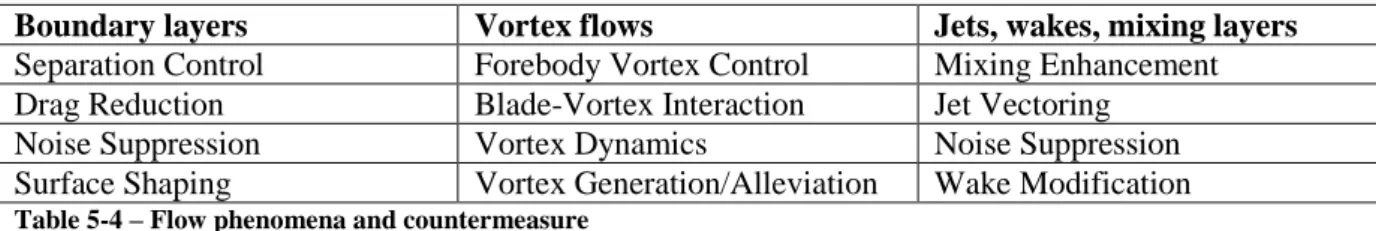
5.4.3 Other countermeasuresAn overview of some flow phenomena and the topics of their countermeasures are seen in Table 5-4 Boundary layers Vortex flows Jets, wakes, mixing layers Separation Control Forebody Vortex Control Mixing Enhancement Drag Reduction Blade-Vortex Interaction Jet Vectoring
Noise Suppression Vortex Dynamics Noise Suppression
Surface Shaping Vortex Generation/Alleviation Wake Modification
Table 5-4 – Flow phenomena and countermeasure
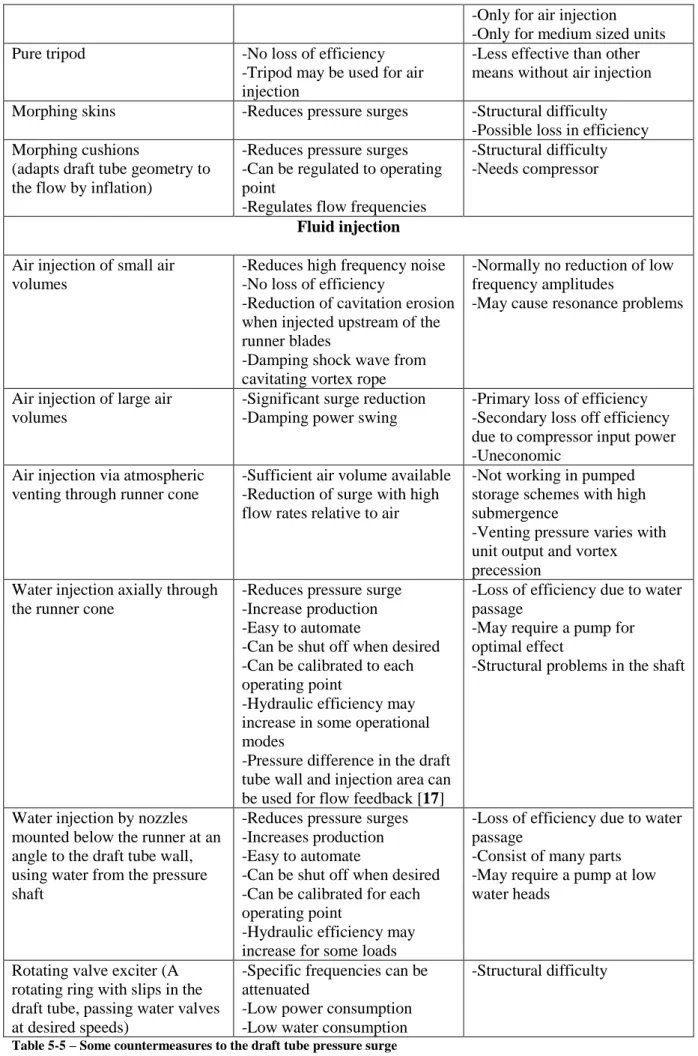
There has been many actions made during the years to mitigate the draft tube pressure surges and some of these countermeasures has been summed up together with their related benefits and losses and is presented in Table 5-5 on the following pages [13], [14], [16]
This table has no significance to the report aim but is presented to give further insight into some tested solutions.
~ 22 ~
Action Benefit Loss
Operational tools Avoid operation in exposed
ranges
-Solving vibration and efficiency problems
-Reduction of availability -Loss of energy production -Harder to automate Design
Runner design with specified velocity distribution at exit
-Swirl and surge characteristics can be affected in certain ranges
-Affecting performance and cavitation characteristics Draft tube design (angle,
contour and length)
-Limited reduction of surge -Length affects the natural frequencies
-Loss of efficiency -Risk for boundary layer separation
Morphing turbine crown -Increased operational range -Expensive and technically advanced installation Asynchronous guide vanes -Improves transient response
-Reduces risk of hydro acoustic resonance
-Structural problems
Geometrical inserts Fins attached to draft tube wall -Reduces surge at part loads
-Increases surge frequency -Works for all machine sizes
-Fins are sometimes subjected to cavitation erosion and structural vibrations
-Loss of efficiency especially at high loads
Stiff cylinder mounted with tripod
-Good experience with pumped storage and mixed turbines -Effective surge reduction -Tripod can be used as vent pipe, but is normally not needed
-Loss of efficiency, increasing with specific speed and load -Tripod is subject to cavitation -Lateral forces acts upon cylinder
-Not practicable for large units Coaxial hollow cylinder,
curving with the draft tube elbow
-Damping pressure surges -No significant efficiency loss -Increase of surge frequency -Tripod may be used for air injection
-Heavy structural problems -Limited to medium sized units
Combination of hollow cylinder and prolonged fins
-Damping pressure surge -Heavy structural problems -Loss of efficiency
-Limited to medium size units -Subject to cavitation
Extension of the runner cone -No significant efficiency loss -Length can be varied with operating point
-Increased lateral forces upon bearings
-Only small effects on vibrational behavior Long runner cone extension
attached with double tripods
-Damping pressure surges -Tripods may be used for air injection
-Structural problems- -Loss of efficiency Cone extension “snorkel” with
tripod
-Sometimes good surge damping effects
-Tripod may be used for air injection
-Less effective then other means without air injection
Pipe spanning the draft tube -Relatively cheap solution -Only small effect on efficiency
-Not effective without air injection
~ 23 ~
-Only for air injection -Only for medium sized units
Pure tripod -No loss of efficiency
-Tripod may be used for air injection
-Less effective than other means without air injection Morphing skins -Reduces pressure surges -Structural difficulty
-Possible loss in efficiency Morphing cushions
(adapts draft tube geometry to the flow by inflation)
-Reduces pressure surges -Can be regulated to operating point
-Regulates flow frequencies
-Structural difficulty -Needs compressor
Fluid injection Air injection of small air
volumes
-Reduces high frequency noise -No loss of efficiency
-Reduction of cavitation erosion when injected upstream of the runner blades
-Damping shock wave from cavitating vortex rope
-Normally no reduction of low frequency amplitudes
-May cause resonance problems
Air injection of large air volumes
-Significant surge reduction -Damping power swing
-Primary loss of efficiency -Secondary loss off efficiency due to compressor input power -Uneconomic
Air injection via atmospheric venting through runner cone
-Sufficient air volume available -Reduction of surge with high flow rates relative to air
-Not working in pumped storage schemes with high submergence
-Venting pressure varies with unit output and vortex precession
Water injection axially through the runner cone
-Reduces pressure surge -Increase production -Easy to automate
-Can be shut off when desired -Can be calibrated to each operating point
-Hydraulic efficiency may increase in some operational modes
-Pressure difference in the draft tube wall and injection area can be used for flow feedback [17]
-Loss of efficiency due to water passage
-May require a pump for optimal effect
-Structural problems in the shaft
Water injection by nozzles mounted below the runner at an angle to the draft tube wall, using water from the pressure shaft
-Reduces pressure surges -Increases production -Easy to automate
-Can be shut off when desired -Can be calibrated for each operating point
-Hydraulic efficiency may increase for some loads
-Loss of efficiency due to water passage
-Consist of many parts -May require a pump at low water heads
Rotating valve exciter (A rotating ring with slips in the draft tube, passing water valves at desired speeds)
-Specific frequencies can be attenuated
-Low power consumption -Low water consumption
-Structural difficulty
~ 24 ~
5.5 Case study Lövhöjden power plant
The case study is made at Lövhöjden and Ålviken power plants see Table 5-6. The machine installed at these power plants is of Francis type and come in two sets with different water heads. These machines are producing at highest efficiency and best price and are usually operated simultaneously, equating to an amount of 14,5MW marketable production. They are often turned off at low price periods to save water and do not require to pass any certain flow at these times.
Lövhöjden (large reservoir) Ålviken (small reservoir) Location Stor-forskvattnet (Upstream) Lill-foskvattnet (Downstream)
Rotation speed 600rpm 600rpm
Rated capacity 8,5MW 6,0MW
Annual production 24GWh 17GWh
Water head 99m 75m
Maximum flow rate 10 10
Reservoir head variation 11m 40cm
Table 5-6 – General information of Lövhöjden and Ålviken power plants
Both of these machines are horizontally mounted and do not have hollow shafts, making central air admission more difficult. In Figure 5-18 is a schematic overview of the turbine.
~ 25 ~
Lövhöjden suffers from an undesired operating point at 5,5MW load and has an compressed air injection system installed to ease the many start and stop procedures. Increased part load availability from fluid injection techniques are of moderate interest at these facilities since no minimal flow is required to be passed according to water rights-judgments. They would experience tradeoff in efficiency and loss of possible revenue due to usage of the water storage at low price periods. The possible benefits from fluid injection is increase in reliability and overload capabilities, this is however restricted by the installed generator size.
Lövhöjden has the first and larger reservoir called Stor-forskvattnet, in which the water surface is allowed variations between 476-487MAMSL8, which equates to 11m allowed head variation.
Ålviken has the second reservoir called Lill-foskvattnet in which the allowed water surface variation is between 387,80-388,20MAMSL, which equates to 40cm variation.
At maximum flow of 10 it takes 4hours and 28minutes to reach the water head surface limits at Lill-foskvattnet according to Jämtkraft software simulation. Suggesting that either both system need to be equipped with injection systems or Lövhöjden is equipped and their production schemes needs to be altered.
Then full load production time at Ålviken needs to exceed the one of Lövhöjden with a time that is proportional to the discharge and time that Lövhöjden has operated at since the last stop of Ålviken and it is not allowed to exceed this time by more than the time needed to reach the lower surface limit. Restraints on the Ålviken run time is illustrated in the below expression.
is the time of full discharge at Ålviken
is the time of full discharge at Lövhöjden
is the time of some load differentiating from nominal load at Lövhöjden since Ålviken stopped is the load factor at Lövviken and is the quota between discharged flow and nominal flow represents the time needed to reach the lower limit of the allowed water surface due to full
discharge at Ålviken and is held less or equal to 4h28min. It should be noted that this term depends on the current water level and difference in flow at Ålviken and Lövhöjden.
Frequencies that are expected in the case study can be calculated with information that the turbine is equipped with 20 guide vanes and 16 runner blades. The expected frequencies to be found at Lövhöjden and Ålviken turbines are presented in Table 5-7 below
Runner frequency
Runner blade frequency
Guide vane frequency
Rheingans frequency
Table 5-7 – Expected pressure pulse frequencies in the flow at Lövhöjden and Ålviken
The dominating pressure pulse amplitudes are assumed to be in the range of 2.5-5Hz.
~ 26 ~
6 Results
In this sector results from each technique are gathered. Good potential for reduction of deleterious effects in the draft tube has been found for both techniques. This part has been subdivided into technical and economic summaries.
6.1 Technical summary
Included in the technical summary are reported technical effects of the fluid injection techniques. At the case study no proper aeration path was found due to the unhallowed shafts. Peripheral aeration could be an easier alternative but no estimates were attained for this technique. A conclusion is that technical implementation of peripheral water injection is to be preferred at the investigated turbines. 6.1.1 Air injection
The design of the aeration system in a Francis turbine has a significant impact on the efficiency, performance and reliability. Turbines may experience small to moderate efficiency losses of about 0.2%-1%, even with the aeration system shut off if geometrical modifications such as baffles and thicker blade design are present due to the aeration system. With aeration active, turbines can experience a significant loss of efficiency in the range of 3%-10% depending on the location and amount of injected air. Turbines that are using the existing vacuum breakers as an aeration path and those who have central baffles installed can experience significant reduction in capacity and flexibility [10]
Air injection is often used in order to increase the DO9 levels in the water to reduce the risk of damaging the aquatic habitat downstream the power plant. It has been found that distributed aeration through the trailing edges of the runner blades has the smallest effect on efficiency as well has the highest increase in DO, followed by peripheral aeration. [10]
Little is published on effects of aeration on turbine efficiency but it is generally decreasing in relation to the air flow rate relative to turbine discharge. Information about losses in efficiency has sometimes been collected in relation to test aiming to increase the DO levels. In turbines with high submergence such as pumped hydro turbines, the effect of air injection can become counterproductive in certain cases due to resonance in the draft tube pulsations induced by the of the injected air. [5]
Air admitted centrally through the runner cone can reduce the oscillation amplitude of the vortex rope, hence reducing the risk of hitting the draft tube walls. [19] It is also a zone where atmospheric air easily can be admitted with good results. The air-water mixture will affect the systems hydraulic response and the excitation of natural frequencies in the water passage system.
R. Fraser et al found in model tests that an efficiency increase of almost 4% using centrally admitted air through the runner cone was achieved around 50% discharge, no tests were made at lower discharge then this and there was a 1-5% loss in efficiency at all operating modes above this [20] When testing an aeration system through the whole operating span the central air will in general have the largest influence on turbine efficiency with an almost linear increase to air flow, but also provides with a good method of mitigating the vortex rope. At low air flows, peripheral aeration shows the lowest effects on turbine efficiency but at increasing air flows a distributed aeration systems seem to result in the lowest efficiency losses. [12]
9 Dissolved Oxygen
~ 27 ~
It is stated by R. Fraser and N. Désy that it is more favorable for machine performances to use
continuous air admission around the machine instead of having a unique injection point such as central aeration through the runner cone or distributed aeration with a few points around the draft tube. [20] Andritz, Alstom, American Hydro and Voith Hydro are major turbine manufacturers that are operating on the market of designing aerating turbines. P. March has conducted experiments presented that show the effects on efficiency from central aeration of an eighty year old runner and two modern runner installed 2002, The efficiencies are normalized to four state of the art aerating runners installed 2008 using distributed aeration, seen in Figure 6-1. [12]
Figure 6-1 – Normalized hydraulic performance of central air injection [12]
Ulith found 1968 in tests carried out on a model turbine that the most effective location for compressed air injection is in the ring shaped space between the wicket gates and the runner inlet. Here airflow corresponding to only 0.08% of turbine discharge was required in order to achieve a satisfactory damping effect. Additionally injection at this location did not cause any noticeable reduction in efficiency. [6] Confirmed by [21]
At Itaipu power plant there has been many problems and machine stops due to the aeration system installed, averaging to 1.35 failures per year. Worst problems were due to valve failures and a third of the stops were due to accidental protection actuations. It was presented that when studying other machines the presence of the aeration system was responsible for 3.64% of machine stoppages during 1991-2012. Noted should be that the Itaipu aeration system is connected to the spiral casing above the cavitating zone of the runner. [22]
~ 28 ~
In Figure 6-2 is experimental results found by P. March showing the effect on efficiency with peripheral aeration system with respect to the upper load curve.
Figure 6-2 – Normalized hydraulic performance of peripheral aeration [12]
At high tail water or at highly submerged turbines compressed air is needed. It is stated by H. Grein that 3% of the turbine discharge is required in order to achieve a significant pressure pulse reduction, which causes significant losses in efficiency due to the power expenditure of the compressor. [16] Gibberd, J. J. found diagnosing a 30MW UK hydro station that the penstock vibrations around 30% of runner speed was successfully mitigated by air injection. Suggesting that mitigation of upstream flow problems can be successfully achieved with this technique. [23] Presented in [5]
S. Muntean et al found in a case study that for air injected through a tripod located below the runner exit the operation was significantly improved at 69.1% of BEP but was worsen at 41.8% of BEP. A mitigation of the pressure spectrum content was observed in this study and the conclusion made included that individual investigation of each turbine shall be made in order to identify the dangerous operating regimes when using air control [24]
In general P.Döfler et al mentions many times in [5] that centrally introduced air, both injected in small quantities and admitted from atmosphere connections has proven useful when eliminating parasitic pressure pulsations. It is also stated that straight conical draft tubes as well as horizontal axis turbines has a lower response to aeration since air can easily escape and is not well retained in the vortex.
~ 29 ~
6.1.2 Water injectionMainly results found by H, Francke regarding Skarsfjord, Skibotn, Svorka and a test rig of Tokke power plant is presented and investigated in this section. Results are separated according to turbines utilizing the peripheral draft tube water injection technique.
6.1.2.1 General overview
Slightly different versions of the injection system has been developed and tested at these power plants, all yielding different but positive results, see Table 6-1 below for a short summary of these facilities.
Skarsfjord Skibotn Svorka
Owner Troms Kraft Produksjon Troms Kraft Produksjon Statkraft
Turbine Francis Francis Francis
Manufacturer Kværner Kværner J.M.Voith
Head 150m 430m 260m
Power rating 4,04 MW 72MW (55 MW BEP) 25MW
Annual Production 18 GWh 355 GWh 101 GWh
Rotational speed 750 rpm 600 rpm 600 rpm
Year 1994 1979 (runner 1995) 1961
Table 6-1 – Short summary of investigated facilities utilizing the water injection system [14]
The reasons for installing injection systems are varying for these facilities.
- Skarsfjord has acted as a test facility used in development of system design with a manually controlled injection system.
- Skibotn were required to pass water flows in accordance with water rights judgment that coincided with a dangerous operation regime of the turbine.
- Svorka experienced cavitation problems suspected to be related with draft tube pressure surges.
It was found that the water injection worked with some condition restraints and gave a reduction in pressure pulsations both in laboratory and field experiments. It also had a surprisingly positive effect on the overload conditions in a Tokke power plant model turbine, considering that the nozzle flow was aligned with the swirl direction. An increase in hydraulic efficiency was found both in laboratory and in field measurements, the overall efficiency was however always reduced due to water being
~ 30 ~
Table 6-2 [14] below summarizes the effects of the Skarsfjord and Skibotn power plants after
installation of the system.
Skarsfjord
Skibotn
Rheingans pulsation were slightly
Reduced
STD
10of pressure measurements was
reduced with use of nozzles
Static wall pressure increased with
number of activated nozzles
Negative pressure in the draft tube
Jet noise occurred from the nozzles
when activated
Rheingans pulsation were strongly
reduced
STD of pressure measurements
increased with the use of nozzles
Static wall pressure decreased with
number of activated nozzles
Overpressure in the draft tube
Jet noise occurred from the nozzles
when activated
Table 6-2 Summary of results from Skarsfjord and Skibotn
Similar to the Skarsfjord and Skibotn power plants are the comprehension of more steady operation of the units when using the water injection system. At Skarsfjord this was due to reduction of random pressure noise and at Skibotn due to noticeably smaller vibration in the draft tube cone. [14] In Table 6-3 below is a summary of the test injection systems info at Skarsfjord and Skibotn
Skarsfjord Skibotn
Number of nozzles 5 7
Nozzle outlet diameter 13 mm 27 mm
Nozzle angle α 8 deg 0 deg
Nozzle angle β 35 deg 35 deg
Nozzle flow rate 0-32 l/s 0-220 l/s
Table 6-3 – Nozzle info at Skarsfjord and Skibotn
Nozzle angles α and β are fixed and are illustrated in relation to the turbine in Figure 5-11
The vertical angle α showed strong relation to pressure pulsation reduction and the optimal angle was dependent on the turbine operating condition. This angle also had a noticeable effect on the draft tube hydraulic efficiency with losses due to nozzle flow disregarded; this was especially found at part load conditions. In general it was found that nozzles aimed downstream improved the hydraulic efficiency and nozzles aimed upstream could reduce the hydraulic efficiency. The best swirl reduction was also found when nozzles were aimed downstream [14]
The horizontal angle β showed some relation to the reduction of pressure pulsations and best results were found at the lowest tested angles. It did not affect the hydraulic efficiency notably but influenced the swirl reduction at positive values of α [14]
Common results of Skibotn and the Tokke test rig is that the correct nozzle flow is needed for the desired effect. Too high flow induced “jet noise” from the nozzles and too low flow did not dampen the pressure fluctuations satisfactory. At the optimal point the pressure pulsations were damped without the noise becoming a problem. [14]
10 Standard Deviation
~ 31 ~
6.1.2.2 SkarsfjordSee Table 6-4 for a short summary of the Skarsfjord power plant.
Owner Troms Kraft Produksjon
Location Ringvassøy, Tromsø municipality, Troms county
Installed capacity 4MW Water head 150m Turbine Francis Turbine power 4,04MW Rotational speed 750rpm Annual production 18GWh
Table 6-4 – Skarsfjord power plant
Irregular pressure slams were present when operating the Skarsfjord power plant at 50% load. The sounds from these were audible throughout the plant and outside the draft tube outlet. After activating one or more nozzles, these pressure slams disappeared immediately. [14] This facility is also affected by large water head variations due to tidal variations; this creates a dynamic operating environment for the runner.
Measurements performed involved pressure pulsations in draft tube, pitot static measurements in draft tube cone, nozzle flow and hydraulic efficiency. Nozzles were mounted approximately 340mm downstream the runner outlet, L/D=0.52 in Figure 5-11.
The measurements led to an increase in static pressure at the draft tube wall with increased number of activated nozzles with the exceptions of when going from zero to one nozzle and the fact that lower static pressure was found using five nozzles then four at some operating points. [14]
The hazardous operating point was approximately in the area of 35%-50% load and appeared to become reduced with nozzle activation, irrespective to the number of nozzles activated, see Figure 6-3.
Figure 6-3 – STD of draft tube pressure as function of generator loads with different number of activated nozzles [14]
The pressure seems to decrease at the lowest load region with the number of activated nozzles and at the high load region the opposite appears to happen. The fluctuations corresponding to a rotating vortex rope was found to be reduced most effectively using 2 or 3 nozzles but was still present, suggesting that the vortex still rotates inside the draft tube. [14]
~ 32 ~
It was found that the hydraulic efficiency increased linearly with nozzle flow up to a 0.6% increase as depicted in Figure 6-4 below. Dahlhaug and Brandåstrø found that the total efficiency of the system was reduced with 2.4%-4.6% with nozzles activated. [25] found in [14]
Figure 6-4 – Measurement of hydraulic efficiency improvement with nozzle flow at Skarsfjord October 2005 [14]
On the following page in Figure 6-11 is the results of pressure readings when operating at 43% load using different number of activated nozzles.
~ 33 ~
6.1.2.3 SkibotnSee Table 6-5 for a short summary of the Skibotn power plant.
Owner Troms Kraft Produksjon
Location Skibotn, Storfjord municipality, Troms county
Installed capacity 80MW
Water head 430m
Turbine Francis
Turbine power 72MW (BEP at 55MW)
Rotational speed 600rpm
Annual production 355GWh
Table 6-5 – Skibotn power plant
At the location of this facility the water-rights judgment requires that around 4 of water is
continuously flowing between June and October. Before installation of the water injection system this operating point was hazardous and this water flow was not passed through the turbine for power production. This flow amounts to about 15MW electricity production at the present water heads. At this facility the measurements performed by Francke aimed to measure draft tube pressure pulsations, vibration of the nozzle system, run-out of the shaft and nozzle inlet pressure and flow. The averaged pressure was found to be the lowest with 3 nozzles activated but already with 1 nozzle active a significant reduction of the pressure pulsations were achieved, see Figure 6-5 below.
Figure 6-5 – Average draft tube pressure at 24MW with different number of activated nozzles [14]
In this facility additional information from measurements of shaft run-out fluctuations is available from the already existing control system. Below, in Figure 6-6, readings are shown with the number of activated nozzles present in between the peaks. [14]
~ 34 ~
Figure 6-6 – Shaft run out measurements with different number of nozzles activated [14]
This suggest that axial forces are reduced using the nozzle system hence a positive effect on the turbine and generator bearings life times can be expected.
On the following page in Figure 6-7 is pressure measurements at 50% load presented using different number of activated nozzles. To the right is a FFT11 up to 10Hz for each scenario.
11 Fast Fourier Transform
~ 35 ~
~ 36 ~
6.1.2.4 Tokke model turbineH. Francke has conducted measurements at a model of the Tokke power plant, see Table 6-6.
Owner Statkraft
Location Tokke municipality, Telemark
Installed capacity 480MW Water head 377m Turbine 4xFrancis Turbine power 4x110MW Rotational speed 375rpm Annual production 2203GWh
Table 6-6 – Tokke power plant
Francke observed from the measurements that a considerable vibration occurred at high swirl numbers, which was radically reduced as nozzles were activated. The model was able to operate without difficulties at part load, but a moderate increase in surge was found at two part load and one over load condition and tests were performed at these loads.
It was also found that the cavitating vortex core due to overload is not influenced significantly by the use of nozzles, however the reduction of pressure pulsations are prominent and can be seen as a step function of nozzle flow. This is depicted in Figure 6-8 with the set value of 3litres/s nozzle flow. [14]
Figure 6-8 – Tokke model turbine pressure pulsation at overload when nozzles are turned on [14]
A trend with considerable correlation can be observed in the overload point where the axial loads seems to be reduced as nozzle flow increases. The standard deviation of axial shaft load in relation to nozzle flow is seen in Figure 6-9 below. [14]
~ 37 ~
Figure 6-9 – Tokke model turbine axial load fluctuations measured at overload as a function of nozzle flow [14]
The nonlinear trend further suggests that nozzle flow should be carefully matched to each load condition in order to avoid unnecessary nozzle flow and jet noise.
It was also found that the Tokke model turbine pressure spikes at part and full load appears to be different in both size and in appearance of the pressure spikes as seen in Figure 6-10
Figure 6-10 – Part and over load pressure spikes [14]
It is stated that the injection gave similar results as adjusting the inlet flow speed but with power loss as a side effect [14]
~ 38 ~
~ 39 ~
6.1.2.5 SvorkaSee Table 6-7 for a short summary of the Svorka power plant.
Owner Statkraft
Location Surnadal municipality, Møre og Romsdal
Installed capacity 25MW Water head 260m Turbine Francis Turbine power 25MW Rotational speed 600rpm Annual production 101GWh
Table 6-7 – Svorka power plant
This facility has newly been equipped with the water injection system and little data is available for analysis of the results. The distinctive half load problems characterized by Francis turbines is however clearly visible in the draft tube pressure measurements seen in Figure 6-12 below.
Figure 6-12 – Svorka draft tube pressure measurements as a function of power output [14]
Newly produced results from this facility can be used to gain further understanding about cavitation reduction effects of water injection system.
~ 40 ~
6.2 Economic summary
Members of the European Union can receive electric certificates if making investments that is
increasing production in renewable energy sources. Installation of the investigated systems could give an increase in production which is justified to receive energy certificates, increasing the production income from the facility during the coming 15 years. This economic aid is available to the year end of 2035, making 2020 the last year of implementation that can fully benefit from full certificate period. This tradeoff in efficiency is always present when operating outside the BEP but can be compensated by either increased energy production or producing at increased energy prices. The most profitable scenarios resulting from implementation of these techniques are related to increased total production or peak capacity. There are also possible profits related to reduced maintenance costs and increased equipment life time and reliability. But economic results related to increased reliability are assumed to be less significant due to large prediction uncertainties and the fact that reliability increase exerts a considerably smaller economic influence in comparison to that of changes in efficiency, peak or total production often does during just a fraction of the equipment lifetime.
The investigated power plants Lövhöjden and Ålviken are producing electricity at peak hours and are usually stopped during the nights. Lövhöjden already has an compressed air injection system that is used during startup and stop. There is no minimal flow required to be passed through these facilities so water can be saved until next price peak.
Since Lövhöjden has experienced problems at startup and stop it might be desirable to run this facility at lower loads instead of shutting it off at low price times. This might have a positive effect on the life time expectancy but is time restricted due to loss in revenue and the small downstream reservoir. In general Jämtkraft does not have problems utilizing streams needed to be passed according to water rights judgments. Producing at overcapacity would be the most interesting results to invest in. The overload flow pattern differs from the part load and there is very scarce information available about results in this region, however there are some indications that this can be possible using fluid injection also. But in this scenario investments are not eligible to receive electricity certificates and there would be utilizing water resources with less efficiency. The yield would be due to increased marketable power during price peaks on the electrical energy market.
No flow statistics were investigated as initially planned; this was planned with assumptions that increased production could be achieved at some of their facilities by utilizing spill water effectively.
![Figure 5-3 – Expected axial velocity profiles in the draft tube at different swirl numbers [2]](https://thumb-eu.123doks.com/thumbv2/5dokorg/4615757.119014/11.892.132.756.381.940/figure-expected-axial-velocity-profiles-draft-different-numbers.webp)

![Figure 5-8 – Section view of Francis turbine with different aeration techniques shown [10]](https://thumb-eu.123doks.com/thumbv2/5dokorg/4615757.119014/16.892.111.784.522.929/figure-section-francis-turbine-different-aeration-techniques-shown.webp)
![Figure 5-10 – Radius of swirling torque [14]](https://thumb-eu.123doks.com/thumbv2/5dokorg/4615757.119014/19.892.119.847.384.1022/figure-radius-swirling-torque.webp)