Water Quality and its Environmental Implications
within Tigris and Euphrates Rivers
Nadhir Al-Ansari1, Sadeq Jawad2, Nasrat Adamo3 and Varoujan K. Sissakian4
Abstract
Iraq relies greatly on the water of the Tigris and Euphrates Rivers. These rivers rise in Turkey. As far as the water quality of the Tigris River, when it enters the Turkish- Iraqi border is considered normal where the total dissolved salts do not exceed 450ppm. In Iraq, the salinity increases downstream and it reached undesirable limits downstream Baghdad. As far as the Euphrates River is concerned, the salinity of its water reached 600 ppm at the Syrian-Iraqi border. The salinity increases downstream and it reaches 1500ppm downstream Kufa city. This indicates that the salinity of the major Rivers (Tigris, Euphrates and Karkheh) that are supply Shatt Al-Arab River with water is increasing with time. Causes of water quality deterioration is due to several factors. These are: i) construction of dams and irrigation projects in the upper parts of the catchments and the reduction of flow of these rivers ii) Al-Tharthar Scheme, where some water from this reservoir having salinity of 2500ppm is diverted to the River Euphrates iii) Agricultural and Irrigation Projects iv) dumping wastewater directly to the rivers v) Waste of Wars vi) Climate Change vii) disposal of solid waste directly to the rivers viii) Population Growth. All these factors are affecting the population and the environment in Iraq. Keywords: Tigris River, Euphrates River, Water Quality, Environment, Iraq
1 Lulea University of Technology, Lulea 971 87, Sweden.
2 Member of Advisory Commission for the Iraqi Prime Minister, Baghdad, Iraq. 3 Consultant Engineer, Norrköping, Sweden.
4 University of Kurdistan, Howler, KRG, Iraq, and Private Consultant Geologist, Erbil, Iraq.
Article Info: Received: October 20, 2019. Revised: November 11, 2019.
1. Introduction
Quality of water is as important as its quantity for human health, agricultural and industrial practices as well as the environment. The water quality is influenced due to natural processes and human activities [1]. About 300-400 million tons of polluted materials are dumped into water each year [2] as well as 80% of sewage in developing countries is discharged untreated directly into water bodies [1]. For this reason, number of local and international organizations had put outlines and standards for water quality to be adopted. As a consequence, the World Health Organization has put water quality standards that is updated continuously according to the changes in the variables involved [3]. Other countries have made their own standards that fulfils their requirements [4]. In view of the importance of water quality, the UN organizations (World Health Organization, WHO and United Nations Children’s Fund) published a report in 2017 have indicated the following facts:
1. Seventy-one percent of the global population (5.2 billion people) is using a safely managed drinking water service; that is, one located on premises, available when needed and free from contamination.
2. Estimates for safely managed drinking water were available for 96 countries (representing 35 per cent of the global population), and for four out of eight Sustainable Development Goal
(SDG) regions.
3. One out of three people using safely managed drinking water services (1.9 billion) are living in rural areas.
4. Eight out of ten people (5.8 billion) are using improved sources with water available when needed.
5. Three quarters of the global population (5.4 billion) are using used improved sources located on premises.
6. Three out of four people (5.4 billion) are using improved sources free from contamination.
7. Eighty-nine per cent of the global population (6.5 billion people) are using used at least a basic service; that is, an improved source within 30 minutes’ round trip to collect water.
8. Eight hundred and forty-four million people are still lacking even a basic drinking water service.
9. Two hundred and sixty-three million people are spending over 30 minutes per round trip to collect water from an improved source (constituting a limited drinking water service).
10. One hundred and fifty-nine million people still collect drinking water directly from surface water sources, 58% are living in sub-Saharan Africa.
According to this report, 90% of the people in the Arab countries use basic drinking water facilities.
Furthermore, for sanitation facilities 52% use basic and 34% use safety managed facilities in the Arab World. Furthermore, people living near contaminated
waterways and having no alternative access to safe water or to improved sanitation are mostly affected [5].
South of the Mesopotamia was occupied by Sumerians since the dawn of civilization about 8000 years ago where water resources and Lush River valleys served as the basis for the civilization, which started at Sumer [6]. The first form of irrigation to improve agricultural production was invented in the lower Mesopotamian plain and also, where the first written communication, and handwriting were devised. This continued through time and it can be noticed through the work of rulers like Hammurabi (1792-1750 B.C.), Cyrus (550-530 B.C.), Darius (520-485 B.C.), Alexander the Great (336-323 B.C.), and the Abbasids Dynasty (750-1258). Rivers were used and canals were dug for irrigation and transportation and for this reason it is called the hydraulic civilization. Despite its productive wealth and prosperity for many millennia, Mesopotamia saw wave after wave of conflicts, which were reflected in their myths, legends and historical accounts that survived from earlier times, e.g. Epic of Gilgamesh [7]. Disputes were over access to water supplies regional attacks on water supply systems during wars [8]. Another example of such wars is the invasion of the Mongols in the thirteenth century, destroying the majority of elaborate canals systems, built centuries before. After that and until the nineteenth century, Mesopotamia has moved towards a more rural society, creating a huge dependence on irrigated agriculture for its survival. At the present, water resources are still essential to life, socioeconomic development, and political stability in the Middle East.
As far as the Tigris and Euphrates Rivers water are concerned, three countries heavily rely on the water of these rivers. These are Turkey, Syria and Iraq. Turkey depends 98% on water resources inside its borders, while Syria and Iraq rely only on 28% and 39%, respectively on water resources inside their borders [9]. Despite these facts, water status is affected also by efficiency of water management and water scarcity. For the three riparian countries the published water scarcity indicator [10 and 11] suggests that Syria relatively faces the worst situation regarding the availability and use of water resources and the capacity to adapt to water stress. In addition, water resources available per capita are decreasing with time (Figure 1) [12]. In 2015, 6% of the people in Syria drink delivered water, and 96% drink water from improved sources. In Iraq, [13] indicates that the m3/capita/year was 2100 in 2015, but in 2025 it will be 1750. In Syria it was 1250 in 2015 and it will be 800 in 2025.
In addition to the decrease of renewable water resources, the water quality is deteriorating in Syria and Iraq. This is greatly due to the drain of irrigation water into the rivers. Hazardous materials also are discharged to the river; such as fertilizers and pesticides [12]. The situation becomes more acute downstream of the two rivers and there are number of researchers highlighted the fact that the water downstream is not suitable for drinking and irrigation [14]. In addition, dehydration, sanitation-related illnesses, animal deaths, farm losses and displacement were reported [15, 16].
When we analyze the present allocations and percent of population with access to safe water and adequate sanitation (Table 1) in Syria, Iraq and Turkey, the situation is expected to be more severe with time where population growth rate is relatively high (Table 2).
Figure 1: Renewable water resources available per capita, 1962–2014 [12]. Table 1: Population with access to safe water and adequate sanitation [17].
Country
Percent of Freshwater Use, by Sector
Percent of Population with Access to Safe
Water
Percent of Population With Access to Adequate
Sanitation
Domestic Industrial Agricultural Total Urban Rural Total Urban Rural
Iraq 3 5 92 85 96 48 79 93 31
Syria 4 2 94 80 94 64 90 98 81
Table 2: Population growth and fresh water [17].
2. Flow of the Tigris and Euphrates Rivers
Both the Tigris and Euphrates Rivers rise within the southeastern parts of Turkey (Figure 2).
2.1 River Tigris
Tigris River headwater is located within the southeastern part of Turkey on the eastern slopes of Taurus mountain 25km southeast of Elazig city at a height of 4500m (Figure 3). The drainage area reaches 472,606km2 of which about 53.6% lies in Iraq, 12.2% in Turkey, 0.2% in Syria and 34% in Iran [18] (Figure 3). The total length of the river reaches 1718km. The river flow from Turkey for 400km toward the south and it becomes the border between Turkey and Syria for about 44km. Then, it flows in Iraq till it joins the Euphrates River near Qurnah in Iraq. The elevation of the river at that point does not exceed few meters above sea level (Figure 4). The Tigris River referred to as Dijla Su has three major tributaries in Turkey, these are Butman Su, Karzan and Razuk. Its mean annual flow is about 64m3/s and increases to 413m3/s at Razuk city after the contribution of the tributaries. Country Population (millions) Percent of Population Living in Urban Areas, 2001 Annual Renewable Fresh Water (km2) * Per Capita Annual Renewable Fresh Water (m2) 2001 2025 2001 2025 Iraq 23.6 40.3 68 96.4 4,087 2,392 Syria 17.1 27.1 50 46.1 2,700 1,701 Turkey 66.3 85.2 66 200.7 3,029 2,356
* This indicator represents freshwater resources in a country; actual annual renewable supply will vary from year to year. The data typically include both surface water and groundwater supplies, including surface inflows from neighboring countries. The United Nations Food and Agricultural Organization (FAO) refers to this as total natural renewable water resources. Flows to other countries are not subtracted from these numbers; therefore, these data represent the water made available by the natural hydrologic cycle, unconstrained by political, institutional, or economic factors.
Figure 2: Tigris and Euphrates Rivers.
The Tigris River enters Iraq at Fiesh Khabur town and at small distance to the south of this town, Khabur tributary joins the river from its eastern side. The drainage area of Khabur reaches 6270km2 and its length reaches 160km. The mean daily flow of this tributary is 68m3/s. Then, the Tigris River flows toward the south till it reaches the first major city “Mosul”. Its mean annual flow reaches 630m3/s at Mosul. Sixty
kilometers south Mosul, the Greater Zab tributary joins the river from the east. The catchment area of the tributary reaches 25,810km2 (62% lies in Iraq) and its mean annual flow is 418m3/s. The Tigris River continues towards the south where the Lesser Zab tributary joins it from the east. This tributary has a catchment area of 21,476km2 (75% lies in Iraq) and its mean annual flow is 227m3/s. South of Fatha gate, the mean annual flow of the Tigris River reaches 1340m3/s. Further south, the Adhaim tributary joins the Tigris River from the east. The catchment area of this tributary reaches 13,000km2 that lies in Iraq only and its mean annual flow does not exceed 25.5m3/s. The Tigris flow towards Baghdad and south of Baghdad, Diyala tributary joins the river from the east. This tributary has a catchment area of 31,846km2 of which 80% lies in Iraq. Its mean annual flow reaches 182m3/s. At Baghdad, the mean daily discharge of the river used to reach 1140m3/s. No major tributary joins the Tigris River south Baghdad and for this reason the flow of the river decreases at Kut and Amara to less than 100m3/s (see Table 3).
Figure 3: Catchment area of River Tigris [19].
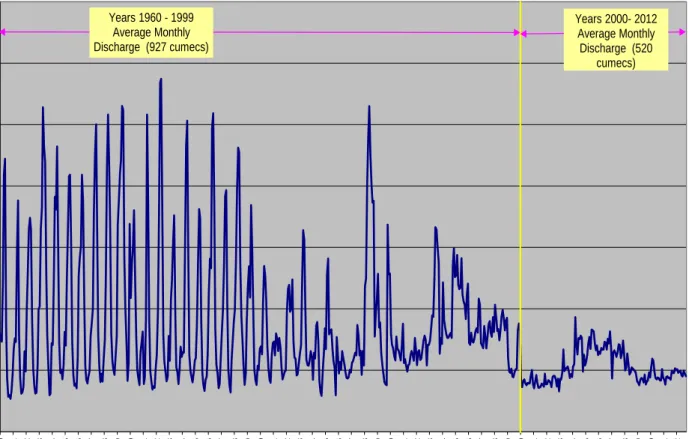
The flow of the River Tigris is changed with time. This is due to several reasons, among these are the climate change and hydraulic structures constructed on the river (see Tables 3, 4 and 5). The average annual flow of the Tigris River is about 21.3 billion cubic meters (BCM) when it enters the Iraqi border and the tributaries of the river contribute 24.78 (BCM). Another 7BCM comes from the small valleys (wadis) from the Iranian part of the catchment area. It has been noticed that this Figure greatly increases and decreases with time depending on climate conditions (see Figure 5). The mean annual flow for the period 1931-1973 was 21.3BCM and dropped to 19.1BCM for the period 1974-2005 [19]. The maximum and minimum recorded annual flow were 43.1BCM and 6.5BCM, respectively [19]. When the data for the Tigris River flow records at Baghdad is analyzed, it shows that the maximum flow takes place during April and May and the period extending from October to February is referred to as variable flood period where discharges in the river fluctuate depending on intensity and duration of rainfall at its basin. Then, steady flood period follows and extends from March to April. Furthermore, the construction of dams upstream Baghdad city highly controlled the flow of the river. This is very well reflected on its hydrograph (Figure 6), which is becoming flatter with time [6, 21, 22 and 23]. The records indicate that the flow was 1207m3/s
dams were constructed. Then, the flow reached 715m3/s after 1980 and dropped
further to 522m3/s (2000-2013) representing more than 50% reduction of the mean monthly discharge due to the construction of dams in Turkey and Iraq, plus the fact that the Iranian government diverted all the valleys that were supplying water to the Tigris from Iran inside the Iranian territory.
Figure 5: Average monthly recorded discharges of Tigris River at Sarai Baghdad station for the period 1960-2012. (Data source until 2007 from [24]).
0 500 1000 1500 2000 2500 3000 3500 jan -6 0 jan -6 1 jan -6 2 jan -6 3 jan -6 4 jan -6 5 jan -6 6 jan -6 7 jan -6 8 jan -6 9 jan -7 0 jan -7 1 jan -7 2 jan -7 3 jan -7 4 jan -7 5 jan -7 6 jan -7 7 jan -7 8 jan -7 9 jan -8 0 jan -8 1 jan -8 2 jan -8 3 jan -8 4 jan -8 5 jan -8 6 jan -8 7 jan -8 8 jan -8 9 jan -9 0 jan -9 1 jan -9 2 jan -9 3 jan -9 4 jan -9 5 jan -9 6 jan -9 7 jan -9 8 jan -9 9 jan -0 0 jan -0 1 jan -0 2 jan -0 3 jan -0 4 jan -0 5 jan -0 6 jan -0 7 jan -0 8 jan -0 9 jan -1 0 jan -1 1 jan -1 2 A v er age M o n th ly Disc h ar g e ( cum ec s) Months Years 1960 - 1999 Average Monthly Discharge (927 cumecs) Years 2000- 2012 Average Monthly Discharge (520 cumecs)
Figure 6: Hydrographs of Tigris River at Sarai Baghdad for the period 1930-2013 (data source: [24]). 0 500 1000 1500 2000 2500 3000 3500 O ct. No v. De c. Ja n . Feb. Mar . A p r. M ay Jun e Jul y A u g. Se p t. Di sc ha rg e (m³ /s) Month 1930s 1940s 1950s 1960s 1970s 1980s 1990s 2000s
Table 3: Monthly and annual mean discharges at selected stations along Tigris River [25].
Table 4: Sources and Uses of the Tigris River (MCM per year). (Source: [6], Hydro-politics of the Tigris and Euphrates Basins).
Pre-GAP Project Post GAP 2000 AD
Natural Flow
Flow From Turkey 18,500 18,500 18,500
Removed in Turkey 0 6,700
Entering Iraq 18,500 11,800
Inflows between entry point and Mosul
2,000 2,000 2,000 Greater Zab 12,100 13,100 13,100 Lesser Zab 7,200 7,200 7,200 Other 2,200 2,200 2,200 Sub-Total 43,000 36,300 43,000 Reservoir evaporation 0 (4,000)
Irrigation (to Fatha) (4,200) (4,200)
Return Flow 1,100 1,100 Adhaim 800 800 800 Irrigation(to Baghdad) (14,000) (14,000) Return Flow 3,600 3,600 Domestic Use (1,200) (1,900) Diyala River 5,400 5,400 5,400 Irrigation (5,100) (5,100) Return Flow 1,300 1,600 Sub-Total 30,700 19,600 49,200 Reservoir evaporation 0 900 Irrigation to Kut (8,600) (8,600) Return Flow 2,200 2,200
(to outfall drain)
Table 5: Dams in Turkey and Syria. [6, 26]. River Basin Name of the Dam Year of completion
Tigris Turkey Batman Dicle Kralkizi Goksu Cizre Garzan Kayser Ilisu Silvan 1998 1997 1997 1991 Suggested Suggested Suggested Under construction Suggested Tigris
Iraq Mosul Dukan Derbendikhan Hemrin Adhaim 1985 1961 1962 1981 2000 Euphrates Turkey Ataturk Birecik Camgazi Hancagrz Karakaya Karkamis Keban Buykcay Catallepe Gomikan Kahta Kayacik Kemlin Koeali Sirmtas 1992 2000 1998 1988 1987 1999 1974 Suggested Suggested Suggested Suggested Suggested Suggested Suggested Suggested Euphrates Syria Forat Baath Teshreen 1978 1989 2000
2.2 River Euphrates
This river is one of the largest rivers in the Middle East and southwest Asia, it is 2718km long (Figure 7). The catchment area of River Euphrates reaches 444,000km2 shared by Turkey (28%), Syria (17 %) Iraq (41%) and Saudi Arabia 14%) (Figure 7). The river rises within the southeastern part of Turkey from two main tributaries. The first is known as Karah Su (Furat Su) and Murad Su. The former, is 470km long and rises at Dumlo mountains north Ardhrum city and flows towards the west and changes its direction toward the south to join the second tributary. Murad Su tributary rises from the western parts of Ararat mountains located north of lake Van, which is about 4363m (a.s.l.) (Figure 8) and it flows towards the west across the Armenian plateau. It joins Karah Su at Kharbut city which is located north Kuban city. After Kuban city, the name of the river is referred to as the “Euphrates River” [20]. The river flows towards the south and few small tributaries join the main river in that area. It crosses Taurus mountain range and heads towards the Turkish-Syrian border and enters Syria at city of Jarablis. At this city, the elevation of the river bed is 325m (a.s.l.) (Figure 8).
About 30km south of the border, the Shajur tributary joins the Euphrates River. Further south, two tributaries, the Balikh and Khabur, join the main river. The river reaches Raqqah city and it changes its direction to flow toward the southeast. The river leaves Syria at Albukamal city (165m.a.s.l.) and enters the Iraqi border at Hisayba city [20 , 27]. In Syria the length of the river reaches 675km.
In Iraq, the Euphrates River flows towards the south east till it reaches Hit city. After that the course of the river becomes closer to the course of the Tigris River near Baghdad city. Downstream Baghdad, the distance between the two rivers increases. No tributary contributes to the Euphrates River inside Iraq. At Haditha city, a dam was constructed in 1987 and it is the only dam on the Euphrates River within Iraq, while there are several barrages constructed to regulate the flow of the river (Table 4). Downstream Hadith city at Hit City (Figure 7), long term flow records show that the mean daily discharge reaches 909 m3/s. The river continues to flow southwards and some of its water during flood season is diverted to Habaniya reservoir, which is located 40km south of Ramadi city. Further south; about 135km south Faluja town the Hindiya barrage was constructed, which can divert a maximum discharge of 471.5m3/s to small parallel distributaries. Then, the river flows towards Kifil town, and at this town, the river is divided into two main channels; Kufa and Shamiya, and they join again at Mushkhab town (Figure 7). Further downstream, the main channel of the river splits again about 25km south of Shanafiya town and rejoins near Samawa city. Then the river enters Hamar marsh, where it forms two main channels within Hamar marsh. One of the channels (northern) joins the Tigris River at Qurna
Forming what is known as the Shat Al-Arab River, while the other channel joins the Shat Al-Arab River at Qarmat Ali town.
Table 6. Main barrages on Euphrates River.
Figure 7: Catchment area of River Euphrates [19].
Barrage Date of Construction Maximum Discharge (m3/s)
AlRamadi 1956 3000 AlFaluja 1985 3600 AlHindiyah 1989 2950 Al Kufa 1988 1400 Al Abbasiyah 1986 1100 AshShamiyah 1986 1100 Al Mishkhab 1959 750 Abu Ashrra 1936 150 Abu Teeben 1986 1100 Yaa’o 1940 400
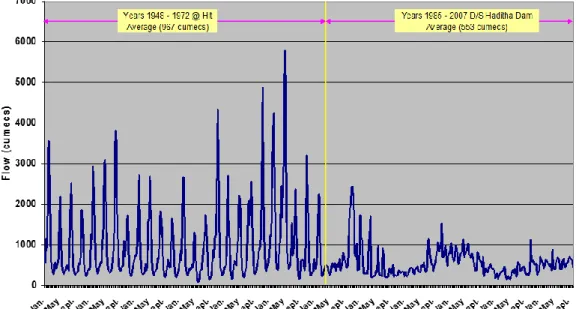
The discharge of the River Euphrates decreased by about more than 40% after the construction of dams in Turkey and Syria on the river (Table 5). The mean daily discharge at Hit town used to be 967m3/s, prior to 1972 and it dropped to 553m3/s after 1985 (Figure 9 and Table 7). Variation of the flow of the Euphrates River at several stations is tabulated in table 8.
Figure 8: The longitudinal section along Euphrates River, after Mahmoud. F. A., 2010.
Table 7: Sources and Uses of the Euphrates River (million cubic meters (MCM) per year, [6]).
Natural Flow
Observed at Hit, Iraq Removed in Turkey (pre-GAP)
Removed in Syria (pre-Tabqa) Natural flow at Hit
29,800 820 2,100 32,720 Pre-Kaban Dam (before 1974) Flow in Turkey Removed in Turkey Entering Syria Added in Syria Removed in Syria Entering Iraq Added in Iraq Iraqi Irrigation Iraqi return flow (est.)
To Shatt al-Arab 30,670 (820) 29,850 2,050 (2,100) 29,800 0 (17,000) 4,000 16,800
Full Use Scenario
(circa 2040)
Flow in Turkey Removed in Turkey
Entering Syria Removed in Syria
Return flow and Tributaries(Turkey, Syria)
Entering Iraq Removed Iraq Return flow in Iraq Deficit to Shatt Al-Arab
30,670 (21,600) 9,070 (11,995) 9,484 6,559 (17,000) 4,000 (6,441)
Table 8: Monthly and annual mean discharges at selected station along Euphrates River [25].
2.3 Shatt Al-Arab River
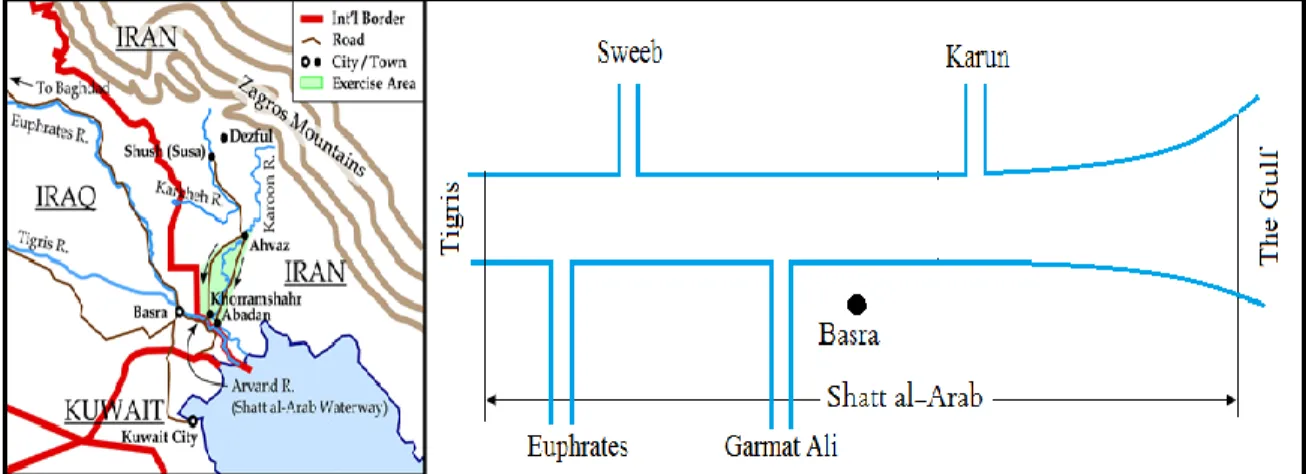
The confluence of the Tigris and Euphrates Rivers near the town Qurna forms the beginning of Shatt Al-Arab and it flow southeast wards to reach the gulf (Figure 10). This river is about 195km long and its width is about 250m and when it passes Basra city (63km south Qurna) the with increases to 700m and the elevation of the river drops 0.7m [28]. Two tributaries (Karkheh and Karun) rising from Iran join the river (Figure 10). Additional source of water to the river comes from minor small tributaries like Garmat Ali, Ezz, and Sweeb which connect the river with the surrounding marshes (Figures 10 and 11). The depth of water varies between 6 and 13m during dry periods [28]. The river forms the border between Iraq and Iran for
about 95km (Figure 10).
Figure 10: Map and Schematic layout of Shatt Al- Arab River.
Shatt Al-Arab River forms the main source of water for domestic, industrial and agricultural activities within Basra Governorate. Wastewater is directly discharged to the river [28]. In addition, all the water of the tributaries coming from Iran is diverted inside Iran [19]. This will increase the need for water to fulfill the growing demand and consequently will increase friction and tension within the countries concerned [6, 29, 30].
3. Surface Water Quality
3.1 Tigris River
The development within the River Tigris basin at Turkey is relatively slow as compared to that within the Euphrates basin. This is due to the physiographic nature of the catchment area. In the 1970’s, Turkey started to planning what is known as the GAP project. Dams were constructed on the Tigris (Table 3) for power generation and irrigation. The projected irrigated area is to reach 600,000 ha and water consumption reaches 5.6BCM [19] (Table 2, Figure 12).
In Syria, the River Tigris forms a short stretch of the Turkish-Syrian border and utilization of its water is very limited. According to the agreement between the Iraqi and Syrian Governments, the latter established Hasakah project in 2010 to generate electricity and Irrigate 150,000 ha [19]. Accordingly, Syria can withdraw 1.25MCM from the Tigris River. The water quality of the river on the Iraqi border is assumed good [31].
Iraq, started to use the water of the Tigris since the 1930’s where the Kut barrage was constructed. Iraq used to irrigate about 3,825,000 ha of land from the Tigris water in the 1970’s and now it is irrigating about 4 million ha of land ([13]).
Figure 12: Irrigated area as part of GAP in the Tigris Basin in Turkey (ha) [19].
The Salinity of the Tigris River water is increasing with time. This is due to intensive agricultural activities, evaporation and climate change. In addition, untreated sewage water and industrial water is directly dumped in the river causing more contamination [32]. In Turkey, the salinity of the river does not exceed 330 µS/cm for the period 1971–1994 and increased to 440µS/cm for the period 1995-2002 [19]. New settlements and industrial activities within the upper part of the catchment are discharging their wastewater to the river causing more increase in salinity. These practices had polluted the sediments within the river [33].
In Iraq, the salinity increases gradually downstream [34]. [19] compiled data about the total dissolved salts along the Tigris River up to 2011. At Mosul (about 180 km from Syrian-Iraqi border) the salinity is within 300 ppm and it increases to about 460ppm at Baghdad (600 km from Syrian- Iraqi border). Then it further increases to 560ppm at Kut city and 650ppm at Amarah city. In 2011, CEB did some work on the water quality of the River Tigris in Iraq. Their data showed that TDS at Al Qaiyarah town (downstream Mosul) was 319ppm. At Baghdad the average salinity was about 600ppm and at Amarah 1318ppm.
Similar trend was noticed from the data collected for the years 2015 and 2016 by the Iraqi Ministry of Environment (Table 9 and Figure 13). TDS was 684pmm and 627ppm at Baghdad for the years 2015 and 2016, respectively. It increased to 1255ppm and 1249ppm at Amarah city for the years 2015 and 2016, respectively. The pH values were within the range of 7.3 to 8.0 for the years 2015 and 2016, while BOD and DO2 were 2.3 to 3.1 and 8.1 to 9.4, respectively. There was also a general increase of the concentrations of the cations and anions downstream (see Figures 14 and 15). This phenomenon was noticed by various researchers [19, 20]. The National Center for water Resources Management at the Iraqi Ministry of Water Resources [35] did a comprehensive study on the Tigris River for the period 2005-2010. The data they presented have a similar trend to the data collected in 2015 and 2016.
Figure 13: Some water quality characteristics of River Tigris 2015(A) and 2016(B) (source of the data: [36]).
Table 9: Water quality characteristics of Tigris River (2015 and 2016) (mg/l) (sources of data: [36]).
Parameter 2015 2016
Baghdad Wasit Amarah Basrah Baghdad Wasit Amarah Basrah
PO4 0.21 0.61 0.19 0.40 0.27 0.25 0.19 0.39 NO3 3.7 5.3 6.1 3.8 4.5 4.64 5.84 3.62 SO4 283.8 225.0 341.7 275 247.6 209.2 343.4 258.3 Cl 94.4 122.5 332.9 476 89.1 125.6 337.9 381.3 Mg 36.3 31.8 38.9 80.2 32.4 26.9 36.0 65.3 K 3.4 5.034 4.3933 6.531 2.944 4.199 4.730 5.7 Na 61.7 97.3 130.9 441.8 59.2 99.8 131.4 328.3 Ca 94.0 82.7 144.9 159.5 85.5 79.5 148.9 142.1 PH 7.6 7.31 7.61 8.07 7.77 7.56 7.46 7.9 DO2 9.17 8.39 - 9.43 8.4 8.42 - 8.1 BOD 3.11 2.38 - - 2.7 2.5 - - TDS 684.3 752.6 1255.7 1760.3 627.7 712.3 1249.2 1472.8
Figure 14: Cations and anions concentrations (mg/l) of the River Tigris for the year 2015 (sources of data: [36]).
Figure 15: Cations and anions concentrations (mg/l) of the River Tigris for the years 2016 (sources of data: [36]).
Values of pH of water within the Tigris River is within the acceptable limits set by [37] and the Iraqi Central Organization for Standardization and Quality Control [38]. It seems that the cations and anions concentration is affected by agricultural and industrial activities. In the northern part of Iraq (Mosul area), the operation of Mosul Dam, agricultural and industrial wastes thrown in the river in addition to sewerage water are influencing the quality of the water [40]. Further downstream within the vicinity of Baghdad area, the water quality is relatively worse than it is at the northern part. This is due to the same reasons affecting the quality of the water in the northern part and more intensive agricultural activities upstream Baghdad area; as well as the decrease in the water discharge of the river [26,41]. Another reason might be the effect of Tharthar canal, which causes high increase in SO4 concentration, which is most probably due to the dissolution of gypsum and anhydrite [35]. For these reasons, the quality in this area is considered poor and not suitable for drinking purposes [42] and can cause saline and alkali damages if used for irrigation [43].
Downstream Baghdad, agricultural activities becomes more intensive and large quantities of water is withdrawn from the Tigris River for irrigation practices. These activities are causing the water quality to be more deteriorated relative to the upstream parts of the river (Table 9 and Figures 13, 14, 15). In addition, other factors are contributing to the deterioration of the water quality such as: high density human population, high rates of water evaporation, saline groundwater that the river receives from the floodplains that extend to the south-west and irrigation return flows from the Tigris tributaries. All these factors make the quality of the water unsuitable for irrigation [26, 44, 45]. For this reason, the Iraqi Governments tried to solve this problem by digging what is known as the third river to collect saline water resulting from irrigation projects.
One of the most important projects is referred to as “the third river”. This river flows south of Baghdad to the Gulf via Khor Al-Zubair with a total length of 565km. The work of this river was completed in 1992. It collects drainage water from 1.5 million ha of land between the Euphrates and Tigris Rivers. The river was also to resolve the chronic salinity problem affecting farmland between the Tigris and Euphrates Rivers by collecting saline drain water and preventing it from flowing into the two rivers. Around 17 million tons of salt reportedly flowed into the Gulf through the Third River [26]. Other measures were taken to improve the water quality where the ministries concerned tried to rehabilitate the agricultural infrastructure. This was to be achieved by implementation of several integrated irrigation projects using both surface and groundwater resources. It included the reclamation of 920,000 ha by 2015 and the irrigation of 134,000 ha of new land in Kirkuk Governorate and in the eastern and southern Jezira [45]. The overall irrigation rehabilitation projects covered 800,000 ha [45].
3.2 River Euphrates
The Euphrates River basin has been inhabited by humans since the dawn of civilization. Due to the need of water for various purposes, water management rules and regulations were developed more than 7000 years ago in this basin [46, 47]. The population within this basin is estimated to be about 23 million (44% lives in Iraq, 25% in Syria and 31% in Turkey) [26]. Most of the water in this river originates in Turkey (89%). During the 1970’s, Turkey started to utilize the water of the river extensively through what is known as the southeastern Anatolia Project (GAP) (Figure 16) [27, 48, 49]. This project highly influenced the flow regime of the river where the maximum storage capacity of the dams and reservoirs exceeds 144 BCM, which is almost 5 times the volume of the natural annual flow of the river (30 BCM). The objectives of this project are to generate 27,367GWh of hydroelectric energy annually and to double irrigable farmland in Turkey to 1.8 million ha [27, 48, 49]. For this reason, the project has raised concern by both Syria and Iraq where estimated water requirements from River Euphrates are (15.7, 11.0 and 13.0) km3
for Turkey, Syria and Iraq, respectively [6, 27]. By the time of completion of the project, Turkey will control 80% of the Euphrates River’s water. The project was cause of friction between Turkey and the other two riparian countries (Syria and Iraq) due to the high effects of the project on the flow of the river, and its environmental implications. The already implemented part of the project had led to increase salinity of the irrigated soils and changes to the ecosystem and river flow regime [26].
Exploitation of the River Euphrates started in the 1960’s in Syria. Three main dams were constructed on the Euphrates River with a total storage capacity of 16.1km3 for irrigation and electricity generation. The total land irrigated by the Euphrates River’s water reaches 206,987 ha and another 270,000 ha from Khabour and Jagh Rivers, which implies that 2,700MCM of water is required for this purpose from these rivers [26].
Engineering projects on the River Euphrates started in Iraq during the beginning of the 20th century much earlier than Turkey and Syria (Figure 17). Irrigated land by the River Euphrates in Iraq was 10 times more than it is in Turkey and 5 times more than it is in Syria [26, 50]. The total irrigated land in Iraq from this river reaches 1.8 million ha [26, 51] and it reach 4 million ha [52].
Irrigation practices within the Euphrates basin had caused water pollution due to the return flow of considerable quantities of drainage water [53]. In addition, the course of the river in Syria is mainly gypsiferous soils [54]. It should be mentioned; however, that the river runs for about 1500km in semi-arid to arid areas and there is no tributary to contributes to its water. This fact, causes high evaporation rates, which in its turn contributes to increase the salinity of the river. For this reason, the salinity of the Euphrates river gradually increases downstream.
Figure 16: The Euphrates water system (main course, tributaries and sub-basins) (Sources: [12]).
In Turkey, the Total Dissolved Solids (TDS) does not exceed 300ppm [26, 55], while it increases to 600ppm at the Iraqi – Syrian border [26, 56] and in Iraq it reaches to 2100ppm at Nasiriyah city [26, 57]. Some researchers; however, claim that the water quality is deteriorating in Turkey also. They claim this is due to rapid population growth, increase of industry, increase of fertilizers usage and herbicide use in agriculture, and no consideration for environmental conscious [58].
The increase of salinity in the water of the Euphrates River within Syria is attributed to the pollution caused by the irrigation projects in both Turkey and Syria and agricultural activities in the floodplains of the Euphrates River as well as in the Balikh and Khabour sub-basins where saline water from these projects drains in the Euphrates River [5, 13, 52].
The situation becomes even worse in Iraq [12, 59 , 60, 61, 62] reported that the TDS concentrations along the Euphrates River for the period 1999-2006. The records show that TDS concentrations were (688, 847, 480) mg/l at Hussaiba, (860, 957, and 761)mg/l at Al-Fallujah Barrage, (852, 997, and 746)mg/l at Al-Hindiyah
Barrage, (2830, 3408, and 1936)mg/l at Samawah city, (3333, 4524, and 1969)mg/l at Nassiriyah city, respectively. Similar trend was noticed by CEB (2011) and from the data obtained of the Iraqi Ministry of Environment for the years 2015 and 2016 (Tables 10 and 11 and Figures 18,19,20).
Downstream Hindiyah Barrage, the quality becomes unsuitable for drinking and irrigation [6,63,64,65]. This is evident as the concentration of all cations and anions increases dramatically in this area (Figures 18,19,20). This situation overstressed the agricultural sector in this area in Iraq, which due to the feedback from Tharthar Depression that contains highly saline water and returned irrigation water as well as high evaporation rates [6].
Figure 18: Some water quality characteristics of River Euphrates 2015(A) and 2016(B) (sources of the data: [36]).
Figure 19: Cations and anions concentrations (mg/l) of the River Euphrates for the year 2015 (sources of data: [36]).
Figure 20: Cations and anions concentrations (mg/l) of the River Euphrates for the year 2016 (sources of data: [36]).
Table 10: Water quality of The River Euphrates for the year 2015 (sources, files of the [36]).
Parameter 2015
Babil Karbala Najaf Kadisiay Muthana Thekar Basrah
PO4 0.27 0.13 0.14 0.27 0.33 0.10 0.41 NO3 5.79 2.69 4.96 8.10 4.65 1.50 3.75 SO4 357.5 381.9 362.4 457.4 716.5 1019.0 312.5 Cl 149.3 148.1 187.3 188.3 804.3 1268.6 929.3 Mg 50.4 39.5 35.7 53.9 148.3 203.7 116.1 K 5.3 4.4 5.9 8.3 19.4 32.4 16.1 Na 101.1 99.4 96.4 139.4 562.0 1099.8 810.3 Ca 109.1 128.0 144.3 130.6 236.0 240.1 171.1 Ph 7.5 7.2 7.42 7.76 7.9 7.83 8.0 DO2 7.0 8.8 7.3 7.4 8.0 6.5 8.4 BOD 0.0 0.0 0.0 1.4 2.7 TDS 902.2 951.0 956.0 1090.1 2900.7 4053.6 2926.4 Table 11: Water quality of the River Euphrates for the year 2015 (sources, files of
the [36]).
Parameter 2016
Babil Karbala Najaf Kadisiay Muthana Thekar Basrah
PO4 0.26 0.63 0.09 0.03 0.34 0.06 0.63 NO3 4.47 2.11 4.01 5.06 5.11 1.48 3.88 SO4 361.0 322.6 374.3 366.0 448.1 630.6 360.0 Cl 120.4 120.4 120.4 120.4 120.4 120.4 120.4 Mg 34.0 36.1 24.1 48.8 87.5 117.8 91.8 K 4.6 3.4 4.7 0.0 11.4 25.1 9.5 Na 71.7 85.2 61.6 0.0 304.5 577.0 538.6 Ca 97.7 103.8 125.2 128.3 175.0 184.3 170.6 Ph 7.31 7.41 7.32 7.73 7.53 8.07 7.8 DO2 6.80 7.05 7.66 8.09 7.83 6.17 7.65 BOD - - - 1.91 - - - TDS 697.1 787.36 850.9 874.6 1873.7 2354.6 2178.8
3.3 River Shatt Al Arab
Salinity within Shatt Al-Arab River increases from the confluence of the Tigris and Euphrates Rivers downstream toward the gulf [25, 28, 66, 67]. At the starting 30km reach of the river, the salinity is highly controlled by the water coming from the Tigris and Euphrates Rivers. It is noteworthy to mention that the flow of the two rivers is decreasing with time (Figure 21, [28]). Additional source is the water contributed by Sweeb river which is fed through the Hawizeh marshes (see Figure 10). The flow is highly influenced by saline water discharges from irrigation return flows and marshes (Figure 22) . [68] considered the irrigation return flow as the biggest polluter of surface water in Iraq [68]. The salinity within this part of the river is of the order of 1-1.2ppt (Figure 23). The salinity of the river slightly decreases after the confluence with Karun River (Figure 23). The salinity in Karun River is increasing with time due to increased water withdrawals and return flows [69]. Near the mouth of Shatt Al-Arab River, the salinity highly increases (about 1.7 to 21.8 ppt) due to salt water intrusion from the gulf (Figure 23). Intrusion of sea water is governed by the tidal forces and volume of water flow within Shatt Al-Arab River and it can reach 100km upstream the mouth of the river [28].
Figure 21: Variation of the discharge of the Tigris and Euphrates Rivers (after [28]).
Figure 22: Monthly salinity of marsh water during 2014 [28].
Within the next 70km, the salinity starts to increase to 1.2ppt which is due to the saline water flowing from the Hammar Marshes into the river via Garmat Ali River where the Hammar water salinity was recorded to be 5.6ppt during 2014 [28] (Figure 23). Further increase in salinity is noticed within the vicinity of Basra and downstream (Figure 23) due to wastewater discharges from Basra city and industries along the river [28, 70, 71].
Shatt Al-Arab River is affected by sea water intrusion. [28] estimated that sea water intrusion varies from 38 to 65km and it sometimes reaches 92km. The distance of the sea water intrusion highly depends on the inflow of water to Shatt Al-Arab from the Tigris and Euphrates Rivers. High water flow from these rivers decreases the distance of sea water intrusion.
According to the salinity data available and using [72] classification, it seems that the water of Shatt Al-Arab is not usable throughout the year apart from the first stretch of the river that extends about 30km (Table 12) [28]. According to the salinity data available and using [72] classification, it seems that the water of Shatt Al-Arab is not usable throughout the year apart from the first stretch of the river that extends about 30km (Table 12).
Figure 23: Salinity levels (ppt; log-scale) and intra-annual variability along the SAR at 10 installed monitoring stations during 2014 (distance not to
scale) (after [28]).
Table 12: Suitability of the SAR salinity levels for irrigation purposes according to [72] (Modified from [28]).
The concentrations of major cations and anions reported by various researchers clearly indicates high salinity levels and high pollution loads.
It is evident that the salinity problem of Shatt Al-Arab is related to several factors. These are:
1. The salinity of the major Rivers (Tigris, Euphrates and Karkheh) that are supply Shatt Al-Arab River with water is increasing with time.
2. Concentrated salts within the water of the marshes due to high evaporation rates and limited water supply from the Tigris and Euphrates Rivers that supplies Shatt Al-Arab.
3. Discharging untreated wastewater directly to the river.
4. Contaminated surface and subsurface drainage from irrigation, industrial and domestic activities.
5. Sea water intrusion from the gulf.
4. Groundwater Quality and Their Use in Iraq
Chemical properties of groundwater aquifer system in Iraq are controlled by a sequence alternating of sedimentary rock. The geological formations of Iraq allows such a quality profile with its sedimentary cover of 4 -13 km thick that overlies the Pre Cambrian-basement [73]. A sequence of alternating pervious and impervious sedimentary rock beds of coarse clastic and fractured carbonates with fine clastic and hard rock carbonate, has developed a successive multi aquifer system particularly noted at the stable shelf in the western part of the country.
To a depth of one kilometer, the aquifer systems in Iraq are sedimentary clastic beds and fractured carbonates rocks ranging in age between Quaternary and Primary, though Tertiary aquifers are dominant throughout the country. The explored areal extension of each aquifer and geological formations is introduced by [74]. In the following, aquifers are briefly described in order to introduce their water qualities and their suitability. In order to orient their locations, the main divisions of the Tectonic Map of Iraq published by GEOSURVY as in [73] as shown in the Figure 25.
Mapping of these formations is important to identify the lateral boundaries and vertical overlap between these aquifer systems 74 as shown in the Figure 2. Sediments of the same age deposited at the Mesopotamia geosyncline axis have shown to be of finer texture and less fracturing than those at the flanks. Hard rock carbonate has developed a successive multi aquifer system particularly noted at the stable shelf in the western part of the country.
In order to identify groundwater quality significant drilled wells considered which penetrate a single formation to represent groundwater quality as total dissolved solids in the explored 16 aquifers [75] and ASHRI II (SGI and al.,2016), unconfined aquifers are differentiated by their lower salinity and water type.
Higher concentrations of dissolved salts are normally expected in groundwater relative to surface water. Lower salinity values and carbonate water type associate with the unconfined aquifers that receive recharge as in the case of the exposed
aquifers. On the other hand, a partial displacement of sea water in the marine deposit carbonates has as well occurred due to previous recharge periods the finer marine deposits in the Mesopotamia geosynclines maintained their high groundwater salinity and marine water type.
Water suitability for human drinking can be found in most of the aquifers especially aquifers in the high and low folded zones. However, most of the groundwater derived from the northern parts of the stable shelf and Al Jazira zones aquifers are suitable for agriculture, the original depositional environment of the sedimentary porous media of an aquifer and its present renewability are essential but not obligatory conditions in determining its groundwater quality.
Overall, continental clastic and highly renewable marine carbonates have a better chance to contain fresh water than lagoon deposits and poorly recharged marine sediments. These conditions illustrate an initial evaluation of the expected groundwater quality in a given aquifer. Water suitability for any type of use requires a further evaluation depending on standards. Water suitable for human drinking is required to contain less than 500mg/l total dissolved solids among other limitations. For agricultural uses, a higher dissolved solids content is allowed but a serious alkalinity limitation rises when the sodium adsorption ratio (SAR) exceeds the value of 10. Water suitability for agriculture is classified depending on its electric conductivity (EC) and (SAR) values among other limitations with regard to sodium percentage content and boron concentration [76]. The upper limit value for EC was suggested to be 3dS/m or about 2000mg/l and SAR < 15. In general, maximum value of 4dS/m for EC (TDS = nearly 3000 mg/l) accepted under special conditions to irrigate light soils and salt resistive plants [77]. Still to be noted that groundwater salinity is variable even within one aquifer system. The suitability of the produced groundwater for any purpose will often depend on the well location and its tapped horizons.
Figure 24: Hydro geological zones in Iraq according to [78]
According to the geological features, land management, agricultural irrigation demand and drainage practices within the Euphrates and Tigris watershed, the salinity of Iraq’s rivers increase as the water travels downstream [79, 80].
Total dissolved solids increase by nearly a factor of four along the Euphrates between Husayba in the middle toward Nasiriyah in the south and by nearly a factor of six along the Tigris between Mosul Dam from north toward Qurna in south, based on average monthly water quality data available from the Ministry of Environment for the period 2004 to 2011.
According to the (Table 13) groundwater quality varies across the country. The most accessible highest quality aquifers are found in high folded zone north-east of Iraq, high rainfall amount and low range of total dissolved solids occurred in the groundwater in comparison with other parts in Iraq. Groundwater salinity increases in the southwest and westward Iraq [79, 80].
Figure 25: Explored Extension of formations modified from GEOSURVY and [74].
Table 13: Major aquifers deposits in Iraq with Total dissolved solids TDS and Salinity in Hydro geological zones.
Major aquifers Deposits Hydro geological zones
Aquifer TDS mg/l
Groundwater Salinity mg/l
Recent Deposits Aquifers Undifferentiated
Quaternary Deposits
low folded zone Mesopotamian zone Al Jazira zone Less than 500 1800- 2600 2500-4000 Low salinity -
high salinity eastern and
southward [73] 1000
Pleistocene (Alluvial
Deposits)
River terraces and
alluvial fans 1160-2800 Moderate salinity Neogene Aquifers (Miocene – Pliocene) Dibdiba formation Bi Hassan formation Mukdadia
Injana &Fatha aquifer system (middle to late Miocene)
Euphrates (Early Miocene)
terrigenous clastic
consist of upper and lower aquifer
conglomeratic facies
deposit
clastics of gravely
sandstone
red mudstone deposited in fluvial environment
Fine grained clastics deposited in coastal and
fluvio lacustrine
environment.
At base, it consists of thin beds of calcareous sandstone, mudstone and gypsum beds coarsens upward with thicker
alternating beds of
sandstone, siltstone, and mudstone
Mid and south of Iraq
High folded zone
Low folded zone
North and North West of Iraq 1000 upper layer exceeds 15000 in lower layer 300-8800at south 673 – 3964 2800 Low salinity
Salinity increases toward the southwest
[79, 80]
calcium sulfate water type [78,81]
calcium sulfate water type (Jassim & Goff, 2006). high salinity l [80].
sulfate water type. [73,74]
Heterogeneous formation consists of
limestone often
recrystallised and
siliceous with a texture ranging from oolitic to chalky. It also contains
marl, argillaceous
sandstone, breccia’s, and conglomerate beds West of Iraq 1000-4000 Shallow to deep wells 1692-3900 Paleogene: Dammam (mid-late Eocene) Pelaspi (Late Eocene) Umm Er Radhumma (Late Paleocene) Consist of two carbonate members of recrystallized fossiliferous limestone or dolomitic limestone Lower part deposited in a shallow marine shelf while the upper part
represents lagoonal
environment.
Consist of two horizons of bituminous limestone: the lower is hard and porous, while the upper
is chalky crystalline
limestone with shelly calcareous dolomite
stable shelf particularly in the southern desert zone
high folded zone
southern desert Mesopotamian zone 3000-5000 1898 – 4069 500-1000 780-6400
Water sulfate type increase salinity [80]
Low salinity
Water type is calcium – Magnesium bicarbonate [81]
High salinity dominant calcium sulfate water type
[82].
Cretaceous Aquifers:
Tayarat (Mastrichtian)
Hartha (Mastrichtian)
Bekhma (Late Campanian – Early Mastrichtian)
coarse grained
calcareous sandstone
lower unit consist of
dolomitic limestone
while the upper unit is comprised of
coarse-grained limestone
overlain by mudstone and dolomitic
karst aquifer system is a heterogeneous carbonate
consisting of porous marl and dolomite beds basal clastic unit of
calcareous sandstone
interbedded with
fossiliferous limestone and overlain by dolomite was identified
western desert
Mesopotamia zones
high folded zone
western desert
291-4000
1560 -
4770
water type is chloride and sulfate [78]
sulfate water type [78, 83]
Water type is predominantly calcium bicarbonate with the
sulfate being second
predominant. Magnesium
increases to become dominant at dolomite presence
([81]
Water type is sodium chloride or sodium sulfate
Rutba (Cenomanian) alternations of fine to
coarse quartz grain,
occasionally clayey,
sandstone and sandy dolomitic limestone. 104-1000 1270-5610 Jurassic Aquifers Muhaiwir formation
basal quartz sandstone with layers of sandy,
hard, coralline,
recrystallized limestone; while the upper unit is of a basal conglomerate sandstone passing into alternating marl, marly
and fossiliferous
limestone deposited in an inner shelf marine environment stable shelf 2000-3000 And less than 300 during believed to receive its recharge
chloride water type [78]
Triassic Aquifers Mulussa formation
Fine deep untapped
sediments dolomitic limestone marly limestone
Mesopotamia zone high folded zone of the unstable shelf. 2000-3000 And less than 300 during believed to receive its recharge
bicarbonate water type [78]
Carbo - Permian Aquifers Bir El Rah and Gaara formations
finer texture clastics: claystone, shale and thin sandstone beds. limestone
Western desert zone
500 - 1000 upper horizon 1120 – 2208 lower horizon [73] [78]
The chemical composition of groundwater in the shallow subsurface zone depends on the quality of the water recharge and the depth of the water table.
Sodium and chloride contents generally increase with depth, and in deep-seated zones, sodium, calcium and chloride brines are prevalent. These vertical chemical changes in groundwater composition are accompanied by a general depth-related increase in salinity [85].
The table illustrate aquifer total dissolved solids TDS with hydro geologic aquifers zones and its deposits.
In the north and southern of Iraq low folded zone, the minimum value of TDS and salinity recorded from Recent Deposits aquifers because shallow well connected to surface water boundaries or separated by topographic heights, while these values increased in the Mesopotamian zone and Al Jazira zone between the two rivers [73]. Neogene groundwater aquifers are in general brackish to saline with great lateral and vertical variations, two salinity layers are distinguished for the aquifer, the upper horizon having lower salinity level than the lower horizon, the cause of the high salinity in the deeper horizons of the aquifer is possible connection with sea water in southern, or a possible communication with the deeper carbonates [79, 86], while water type predominantly calcium sulfate especially in low and high folded zone [78, 87].
In Paleogene aquifer water sulfate type increase salinity in stable shelf Mesopotamian zone while low salinity in north and north west of Iraq founded in high folded zone and southern desert [80, 82].
Cretaceous water type is predominantly calcium bicarbonate and chlorite with the sulfate being second predominant. Magnesium increases to become dominant at dolomite presence (Kandal Company, 2002 as in Stevanovic and Markovic, 2004).
Figure 26: Explored extension of Umm Er Radumma aquifer and the spatial distribution of total dissolved solids in its groundwater [82].
References
[1] World Health Organization -UN, 2010. World Health Organization and United Nations Children's Fund Joint Monitoring Programme (JMP) for Water Supply and Sanitation. Progress on Sanitation and Drinking Water: 2010 Update.
World Health Organization, Geneva, 2010
http://www.wssinfo.org/fileadmin/user_upload/resources/1278061137-JMP_report_2010_en.pdf.
[2] World Health Organization and United Nations Children's Fund Joint Monitoring Programme (JMP) for Water Supply and Sanitation, 2008. Progress on Drinking-Water and Sanitation: Special Focus on Sanitation.
UNICEF, New York, and WHO, Geneva, 2008
http://www.who.int/water_sanitation_health/monitoring/jmp2008/en/
[3] World Health Organization, 2017. Guidelines for Drinking-Water Quality., 4th
Edition, 539p.
http://apps.who.int/iris/bitstream/10665/254637/1/9789241549950-eng.pdf?ua=1
[4] US Environmental Protection Agency, 2017. What are Water Quality Standards? Available at https://www.epa.gov/standards-water-body-health/what-are-water-quality-standards
[5] UNEP, 2011. UN water policy brief, http://www.unwater.org/publications/un-water-policy-brief-water-quality/
[6] Al-Ansari, N.A., 2016. Hydropolitics of the Tigris and Euphrates Basins, Engineering, V.8, 3, 140-172
[7] George, A. , 2000. The Epic of Gilgamesh, The Babylonian Epic Poem and Other Texts in Akkadian and Sumerian, Published by the Penguin Group, England. http://www.cidmod.org/sidurisadvice/Gilgamesh.pdf Last accessed June 16, 2015.
[8] Gleick, P. ,1994. Water, war and peace in the Middle East, Environment Magazine, 39, 6–42.
[9] Food and Agriculture Organization (FAO), 2017. Water resources. Available at : http://www.fao.org/nr/water/aquastat/water_res/index.stm
[10] Jemmali, H. and Sullivan, C., 2012. ‘Multidimensional analysis of water poverty in the MENA region’, Social Indicators Research, 115, 1, 253–77, http://link.springer.com/journal/11205.
[11] Gassert, F.; Reig, P.; Luo, T. and Maddocks, A. ,2013. ‘Aqueduct country and river basin rankings: a weighted aggregation of spatially distinct hydrological indicators’, working paper (Washington, DC: World Resources Institute), November 2013, http://wri.org/publication/aqueductcountry-river-basin-rankings
[12] Shamout N. and Lahn, G., 2015, The Euphrates in Crisis: Channels of Cooperation for a Threatened River, Chatham House, The Royal Institute of
https://www.chathamhouse.org/sites/files/chathamhouse/field/field_documen t/20150413Euphrates_0.pdf
[13] Economic and Social Commission for Western Asia (ESCWA), 2003. An Evaluation of the Economic, Social and Drought-Related Impact, Report
number E/ESCWA/SDPD/2003/13. Available
http://www.un.org/waterforlifedecade/pdf/2003_unescwa_sectoral_water_all ocaton_policies_eng.pdf
[14] Kornfeld, I. ,2014. ‘The Middle East: Climate Change, Water Insecurity and Hydrodiplomacy’, in Percival, R. V.; Lin, J.; and Piermattei, V. (2014), Global Environmental Law at a Crossroads (Massachusetts: Edward Elgar), pp. 83– 100.
[15] UN Iraq ,2013. Water in Iraq Fact Sheet, International Relief website, accessed 20 May 2014, http://reliefweb.int/sites/reliefweb.int/files/resources/Water-Factsheet.pdf
[16] International Organization for Migration (IOM) ,2012. IOM Iraq Special Report: Water Scarcity, http://environmentalmigration.iom.int/iomiraq-special-report-water-scarcity .
[17] Roudi-Fahimi,F.; Creel L., and De Souza,M., 2002. Finding the Balance: Population and Water Scarcity in the Middle East and North Africa,
Population Reference Bureau
http://www.prb.org/Publications/Reports/2002/FindingtheBalancePopulation andWaterScarcityintheMiddleEastandNorthAfrica.aspx
[18] Consulting Engineering Bureau (CEB), 2011a. Tigris and Euphrates sampling, Final Report, College of Engineering, University of Baghdad, Iraq.
[19] Economic and Social Commission for Western Asia (ESCWA), 2013. Inventory of Shared Water Resources in Western Asia, Salim Dabbous Printing Co., Beirut, Lebanon, 626p.
[20] Mahmoud, F., A., 2010. Surface Water Resources of Euphrates and Tigris Rivers Basins in Iraq, M. Sc. Dissertation, College of National Defense, University of National Defense, Baghdad, Iraq.
[21] Al-Ansari, N.A., Abdellatif, M.,Ali, S. and Knutsson, S.,2014a. Long Term Effect of Climate Change on Rainfall in Northwest Iraq, Central European Journal of Engineering, V.4, No.3, 250-263.
[22] Al-Ansari, N.A., Abdellatif, M.,Ezeelden, M.,Ali, S. and Knutsson, S.,2014b. Climate Change and Future Long-Term Trends of Rainfall at North-eastern Part of Iraq J. Civil Engineering and Architecture,V.8, 66,790-805.
[23] Al-Ansari, N.A., Abdulatif, M., Zakaria, S., Mustafa, Y. and Knutsson, S., 2015. Future Prospects for Macro Rainwater Harvesting (RWH) technique in north east Iraq,International Symposium on Energy Challenges and Mechanics, 8-10 July, Aberdeen, UK
[24] Al-Shahrabaly, Q.M., 2008. River discharges for Tigris and Euphrates gauging stations (in Arabic). Baghdad: Ministry of Water Resources.
[25] Consulting Engineering Bureau, 2011b, Shatt AlArab, Final Study, College of Engineering, University of Baghdad.
[26] ESCWA and BGR 2013. Inventory of Shared Water Resources in Western Asia., part2, Chapters 16 and 26. ESCWA, Beirut.
[27] Al-Ansari, N.A., 2013. Management of Water Resources in Iraq: Perspectives and Prognoses, J. Engineering, 5, 8, 667-684.
[28] Abdullah, A. D., 2016, Modelling Approaches to understand Salinity Variation in Highly Dynamic Tidal River, The case of the Shatt Al-Arab River, PhD thesis, Delft University of Technology and of the Academic Board of the UNESCO-IHE, Delft, the Netherlands.
[29] Akada, A., Freeman S., and Placht M., 2007. The Tigris-Euphrates river Basin: Mediating a Path towards Regional Water Stability. Al Nakhlah, Spring,63-74. [30] Jones, C., Sultan M., Yan E., Milewski A., Hussein M., Dousari A.,
Al-Kaisy S., and Becker R., 2008. Hydrologic Impacts of Engineering Projects on the Tigris-Euphrates System and Its Marshes. Journal of Hydrology, 353,59-75.
[31] FAO (Food and Agriculture Organization of the United Nations), 2009a. Euphrates-Tigris Basin, Regional Report, Water Report 34. http://www.fao.org/nr/water/aquastat/basins/euphrates-tigris/index.stm [32] Al-Hamdani, F.Z., 2013. Water pollution in Iraq between disastrous border and
no real solutions. A study, Journal of Genetic and Environmental Resources Conservation, 2013,1,2,111-118.
[33] Varol, M., Gotkot, B., Bekleyen, A. and Sen, B., 2011. Water Quality Assessment and Apportionment of Pollution Sources of Tigris River (Turkey) Using Multivariate Statistical Techniques, Journal of Hazardous Materials, 195,355-364.
[34] Al-Shujairi, S.O., 2013. Develop and Apply Water Quality Index to Evaluate Water Quality of Tigris and Euphrates Rivers in Iraq, International Journal of Modern Engineering Research, 3,4,2119-2126
[35] National Center for Water Resources Management (NCWRM), 2011. Water Quality Study of Main Rivers in Iraq, Annual Report, Ministry of Water Resources, Baghdad, Iraq.
[36] Iraqi Ministry of Environment, 2013, Environmental Status Expectation in Iraq,
First Report (in Arabic).
https://www.academia.edu/24014521/%D8%AA%D9%82%D8%B1%D9%8 A%D8%B1_%D8%AA%D9%88%D9%82%D8%B9%D8%A7%D8%AA_ %D8%AD%D8%A7%D9%84%D8%A9_%D8%A7%D9%84%D8%A8%D9 %8A%D8%A6%D8%A9_%D9%81%D9%8A_%D8%A7%D9%84%D8%B
9%D8%B1%D8%A7%D9%82
[37] World Health Organization, 2011. Guidelines for Drinking-Water Quality., 4th
Edition, 564p.
http://apps.who.int/iris/bitstream/10665/44584/1/9789241548151_eng.pdf
[38] Iraqi Central Organization for Standardization and Quality Control (ICOSQC), 2001. Standard Specification No. 417, First Modification, Drinking Water, Iraqi Ministry of Planning, Baghdad, Iraq.
[39] Al Tamier, M. A. and Al Sinjari, M. N., 2009. Interpretation of Water Quality Parameters for Tigris River by Using Principal Components Analysis, Tikrit Journal of Pure Science, 14,2,68-74.
[40] Al-Rawi, S., M., 2005. Contribution of Man–Made Activities to the Pollution of the Tigris within Mosul Area/IRAQ, International Journal of Environmental Research and Public Health, 2,2, 245–250.
[41] Al Maliky, A. S., 2005. Evaluation of air, Water and Soil Pollutants in Baghdad City using plants through Baghdad city, Proceedings of ISER 13th International Conference, Singapore, 25th November 2015, ISBN: 978-93-85832-55-0
[42] Al-Obaidi, A., H., 2009. Evaluation of Tigris River Quality in Baghdad for the period between (November 2005- October2006), Journal of Engineering and Technology, University of Technology, 27, 9, 1736- 1745.
[43] Alabdraba, W.;Mohammed Z.; Hazaa, M. and Resheq A., 2015. Evaluation of the Tigris River water quality for domestic and Irrigation uses near drinking water treatment
[44] Mutlak, S. M., Salih, B. M. and Tawfiq, S. J., 1980. Quality of Tigris River Passing through Baghdad for Irrigation. Water, Air, and Soil Pollution, 13, 9-16.
[45] FAO (Food and Agriculture Organization of the United Nations), 2008. From Emergency to Development. In Medium Term Strategy from FAO Assistance
to Iraq. Available at:
http://www.fao.org/fileadmin/templates/tc/tce/pdf/Iraq_Strategy_14_April20 08__final_.pdf
[46] Al-Ansari, N. A., Salmah, E., 1995.Water and Civilization, AL-Zahra, 2, 10. [47] [47] AL-Ansari, N.A., 2005. Applied surface Hydrology, Al al-Bayt
University publication, (in Arabic).
[48] Olcay Unver,I.H., 1997. “Southeastern Anatolia Project (GAP) , International Journal of Water Resources Development”, 13, 4 , 1997, 453 – 484.
[49] GAP, 2006. “South-eastern Anatolia Project: latest situation”. http://www.gap.gov.tr/English/Genel/sdurum.pdf
[50] Kienle, E., 1990. Ba’th v. Ba’th: The Conflict Between Syria and Iraq, 1968-1989. In Society and Culture in the Modern Middle East. Published by I.B. Tauris. London/New York. Kliot, N. 1994. The Geopolitics of Inequality: The Tigris- Euphrates Drainage Basin. In Water Resources and Conflict in the Middle East. Published by Routledge. London/New York.
[51] Kliot, N., 1994. The Geopolitics of Inequality: The Tigris-Euphrates Drainage Basin. In Water Resources and Conflict in the Middle East. Published by Routledge. London/New York.
[52] ACSAD and UNEP, 2001. Surface water resources in the Euphrates and Tigris river basins. Damascus: Arab Center for the Study of Arid Zones and Dry Lands and the United Nations Environment Programme.
[53] FAO (Food and Agriculture Organization of the United Nations),2009b. Irrigation in the Middle East Region in Figures, Aquastat Survey 2008. In FAO Reports 34. Rome.
[54] Florea, N. and Al-Joumaa, K., 1998. Genesis and Classification of Gypsiferous Soils of the Middle Euphrates Floodplain, Syria, Geoderma, 87, 67-85. [55] Alp, M. T., Kocer, M., Sen, B. and Ozbay, O., 2010. Water Quality of Surface
Waters in Lower Euphrates Basin (Southeastern Anatolia, Turkey). Journal of Animal and Veterinary Advances, 9,18, 2412-2421.
[56] Kattan, Z. 2008. Estimation of Evaporation and Irrigation Return Flow in Arid Zones Using Stable Isotope Ratios and Chloride Mass-Balance Analysis: Case of the Euphrates River, Syria. Journal of Arid Environments, 72, 730- 747. [57] Odemis, B.; Sangun, M.K. and Everndilek, F., 2010. Quantifying long-term
changes in water quality and quantity of Euphrates and Tigris rivers, Turkey, J. Environment Monitoring Assessment, 170, 475-490.
[58] Akin, M.A., 2007., Importance Of Water, Water Potentıal In Turkey,Water Basıns And Water Pollution, Ankara University Journal of Language and History-Geography, 47, 2, 105-118.
[59] Hussein, B.; Fayyadh, A.; Hammed, J. and Hamdani, M., 2011. Hydrochemical model and probable pollution in the water of Euphrates River (Qaem–Falluja)Arab J. Geosciences, 6,3, 783-799.
[60] Salah, E.; Turki, A. and Al-Othman, E., 2012. Assessment of Water Quality of Euphrates River Using Cluster Analysis, J. of Environmental Protection, 3, 1629-1633.
[61] Al-Bahrani, H.S., 2014. Water quality deterioration of the Euphrates River before entering Iraqi lands, WIT Transactions on Ecology and The
Environment, 182, 12p
https://www.witpress.com/Secure/elibrary/papers/WP14/WP14001FU1.pdf [62] Fayyadh, A.; Hussein, B.; Al-Hamdani, A.; Salim;s.; Mulkhlef, H. and Abed,
M., 2016. Hydrologic system of Euphrates River (spatial analysis) between Al-Qaem and Falluja, Iraqi Bul. Of Geology and Mining, 12,2, 1-18.
[63] Rahi, K. and halihan, T., 2010, Changes in the salinity of the Euphrates River system in Iraq, J. Regional Environmental Change, 10, 1, 27–35.
[64] Al Tai, S., A., 2001. Mathematical Modeling for the Quality and Quantity of Euphrates River inside Iraq, M.Sc. dissertation, College of Engineering, Baghdad University.
[65] Al Saleh, H., 2014. Assessment of water quality index for Euphrates River within Babylon province, Iraq during the period 2007-2013, International Journal of Civil Engineering and Technology, 5,5, 41-50.
[66] Center of Studies and Engineering Designs, 2012, Shatt Al-Arab Irrigation project, Technical Report, Volume IX, Studies on Salinity Problems, Iraqi Ministry of Water Resources, Baghdad, Iraq.
[67] Al Mudaffar-Fawzi, M.N. and Mahdi A. B., 2014, Iraq's Inland Water Quality and Their Impact on the North-Western Arabian Gulf. Marsh Bulletin, 9,1, 1-22.
![Figure 6: Hydrographs of Tigris River at Sarai Baghdad for the period 1930- 1930-2013 (data source: [24])](https://thumb-eu.123doks.com/thumbv2/5dokorg/5505250.143383/10.813.100.701.148.529/figure-hydrographs-tigris-river-sarai-baghdad-period-source.webp)
![Table 5: Dams in Turkey and Syria. [6, 26].](https://thumb-eu.123doks.com/thumbv2/5dokorg/5505250.143383/13.813.191.621.152.788/table-dams-turkey-syria.webp)
![Figure 7: Catchment area of River Euphrates [19].](https://thumb-eu.123doks.com/thumbv2/5dokorg/5505250.143383/15.813.112.706.312.858/figure-catchment-area-river-euphrates.webp)

![Table 7: Sources and Uses of the Euphrates River (million cubic meters (MCM) per year, [6])](https://thumb-eu.123doks.com/thumbv2/5dokorg/5505250.143383/18.813.146.668.168.799/table-sources-uses-euphrates-river-million-cubic-meters.webp)
![Table 8: Monthly and annual mean discharges at selected station along Euphrates River [25]](https://thumb-eu.123doks.com/thumbv2/5dokorg/5505250.143383/19.813.72.698.158.957/table-monthly-annual-discharges-selected-station-euphrates-river.webp)
![Figure 12: Irrigated area as part of GAP in the Tigris Basin in Turkey (ha) [19].](https://thumb-eu.123doks.com/thumbv2/5dokorg/5505250.143383/21.813.117.698.641.906/figure-irrigated-area-gap-tigris-basin-turkey-ha.webp)
