http://www.diva-portal.org
Postprint
This is the accepted version of a paper published in Lighting Research and Technology. This paper has been peer-reviewed but does not include the final publisher proof-corrections or journal pagination.
Citation for the original published paper (version of record):
Chraibi, S., Creemers, P., Rosenkötter, C., van Loenen, E J., Aries, M. et al. (2019) Dimming strategies for open office lighting: User experience and acceptance Lighting Research and Technology, 51(4): 513-529
https://doi.org/10.1177/1477153518772154
Access to the published version may require subscription. N.B. When citing this work, cite the original published paper.
Permanent link to this version:
On dimming strategies for open office lighting: User experience and
acceptance
S Chraibi MSca,b, P Creemers MScb, C Rosenkötter MScb, EJ van Loenen PhDb,c,
MBC Aries PhDd and ALP Rosemann PhDb
a Philips Lighting BV, Eindhoven, the Netherlands
b Eindhoven University of Technology, Eindhoven, the Netherlands c Royal Philips NV, Eindhoven, the Netherlands
d Jönköping University, Jönköping, Sweden
Short title: Dimming strategies for open office lighting
Received 18 January 2018; Revised 26 March 2018; Accepted
Sensor-triggered control strategies can limit the energy consumption of lighting by considering the presence of users in the office and dimming lighting down when it is not needed. In multi-user offices, the application of occupancy-based dimming at room level limits the energy saving potential. However, zone or desk-based dimming may affect the comfort of co-workers due to its dynamics. This paper reports the assessment by 17 participants (30 to 50 years of age) of occupancy-based dimming in a mock-up office, using different dimming speeds. Participants consisted of co-workers experiencing changes triggered by others, and actors triggering these light changes. While the participants performed an office-based task, the luminaire above the actors’ desk was dimmed from approximately 550 lx to 350 lx (average horizontal illuminance), and vice versa. The participants evaluated the dimming conditions regarding their noticeability and acceptability. The study showed that the noticeability of light changes due to dimming, increasing when fading times become shorter. Dimming with a fading time of at least two seconds was experienced as acceptable by more than 70% of the participants. The results of this experiment provide insights to system behaviour that does not
compromise user experience while addressing the energy efficient use of electric lighting.
Address for correspondence: Sanae Chraibi, Philips Lighting B.V., High Tech Campus 7, 5600AE Eindhoven, the Netherlands
1. Introduction
Lighting uses a significant amount of electricity in office buildings. By considering environmental factors, like the presence of users in the office, sensor-triggered control strategies can limit the energy needed for lighting. Consequently, artificial lighting can be dimmed down when it is not needed. This is called occupancy-based dimming and can be applied at different spatial levels, e.g., room, zone, or desk level. Conventionally this is applied at room level, where the lights are dimmed down when the entire room is
unoccupied and dimmed up when a person is detected in the space. In private offices this works well, but in today’s widely applied multi-user open-plan offices, this limits the energy saving potential. However, when applying dimming in open-plan offices with a zone or desk level granularity, the lighting in the user's visual field becomes dynamic, which introduces the risk of creating uncomfortable situations for users. Building standards provide recommendations for comfortable lighting conditions in office spaces1
and highlight the importance of users’ wellbeing2, but do not give clear guidelines regarding acceptable characteristics of dynamic lighting.
State-of-the-art smart lighting systems more frequently have integrated occupancy and daylight harvesting sensors, enabling control strategies to be applied at an individual luminaire level. Each luminaire, being able to detect and respond independently to people’s presence at their workplaces, reinforces the application of occupancy-based dimming at desk level for energy saving benefits, but it also makes dealing with discomfort more challenging. Considering the perceptible steps as described in the standard EN12464-1, 20111, switching of lighting to a background level will be noticed in most cases, risking dissatisfaction of users present in the space. However, dimming using smooth transitions may be more acceptable. In the literature, different studies can be found that address the detection and acceptance of light level reductions. Mostly to explore potentials for load-shedding or demand-response lighting strategies to limit the energy used by lighting.
In 2002, Krzyszczuk and Boyce reported a study in which they explored how fast the luminance in an enclosed office space could be reduced before the change was noticed3. They used 1095 lx and 475 lx as initial desk illuminances, and dimmed down with change rates from 4 to 337 lx/s. In their study, they found that for each given initial illuminance, there is a relative threshold value for detection of change. For the initial illuminance of 475 lx this was after 22% dimming, and for the initial illuminance of 1095 lx this was after 17% dimming. Although Krzyszczuk and Boyce reported no effect of speed of change on the detection threshold3, Akashi and Neches do suggest that the dimming speed may make it possible to further expand the acceptance of illuminance reduction4.
In 2005, Akashi and Neches evaluated the detection and acceptance of dimming to explore the potential for energy saving by load-shedding4. In their studies, subjects
initial illuminance levels of 300 lx and 500 lx to target levels between 20 and 1000 lx. They reported that the probability of detection of illuminance reduction increased as the target illuminance decreased. For dimming down, this meant a higher probability of detection when increasing the dimming speed (from 5 lx/s to 50 lx/s). This effect of increasing dimming speed was also reported for dimming up5. Akashi and Neches found that once the horizontal illuminance is reduced by more than 20% from the initial level, over 50% of the occupants are likely to detect the reduction4. These results are in line with previous studies that show that 50% of the population could not detect a 15-20% illuminance reduction when engaged in a visual task3,5,6 and are in line with the results from Newsham and Mancini7. When a task is performed on a PC screen the sensitivity to illuminance reductions is even lower. While conducting a PC-based task, reductions in illuminance of 40% were still accepted by 80% of the subjects. Akashi and Neches also found that the acceptable dimming range is wider when informing the subjects about the benefits of dimming for load-shedding, compared to the subjects that were not informed5. These results demonstrated that tolerance regarding acceptance is greater than the
boundaries of detectability. Understanding these differences is important when applying illuminance reductions. Akashi and Neches also reviewed the effect of the dimming curve on the detectability or acceptability of illuminance reduction, but found this to have found no effect5.
Most of the mentioned studies were conducted in spaces with little or no daylight. Newsham et al. performed a follow-up study that did include daylight8. In the
experiment, they dimmed lighting down from the baseline of 400 lx with 0, 20, 40, 60 and 80%, all in 10 seconds. They showed that in situations with no daylight, the artificial lighting can be dimmed down by 20% without occupants noticing the change and
dimmed down by 40% to still be perceived as acceptable. In situations with low to high prevailing daylight, artificial lighting can be dimmed down even further, being
respectively 40 and 60% without occupants noticing the change, and by 80% for both, low and high prevailing daylight, while still being perceived as acceptable.
In the above mentioned studies lighting was dimmed above the subject’s desk in a private office set-up3-5,8. Even though the study of Shikakura et al was performed in a multi-user office space, only one subject at a time participated in the experiment, while the light output of the luminaire above the subject’s desk was altered6. The study we present here explores the acceptance of occupancy-triggered dimming of a single
luminaire above a colleague’s desk, in the users’ visual field. It will include the influence of dimming speed, dimming direction and feedback regarding the reason for dimming, this being the change in occupancy.
In a previous study performed by the authors, different dimming strategies were evaluated in a simulated office environment with a group of 55 university students, consisting of actors and participants9. The actors (posing as a regular participant) triggered occupancy-based light changes by entering or leaving the office at instructed
moments. The participants represented a group of co-workers inhabiting the office space, experiencing the changes triggered by a colleague (the actor). Co-workers’ noticeability and acceptance of illuminance reduction were evaluated using different dimming speeds. Asked to perform a pre-defined office task, the participants (18 – 30 years of age, 22 females and 19 males) were not informed about the possible occurrence of light changes. The participants were asked to indicate any change they observed while performing the task and rate the acceptability of that change. The luminaire above the actor’s desk was dimmed down from 543 lx to 310 lx in either 0, 5, or 10 seconds immediately after the actor left his desk, or after a delay of 5 minutes, and the luminaire was dimmed up directly after the actor occupied his desk from 310 to 543 lx in either 0, 2, or 5 seconds. Additionally, to test the effect of the actor leaving or entering the space, test-conditions were added in which light changes were not accompanied with an occupancy change and occupancy changes occurred without lighting changes. During a 2-hour session,
participants were exposed to a total of 17 different conditions of which 6 were repeated and tested twice. At the end of the study participants were informed that only light changes could occur, after which they were exposed again to the different conditions and asked to re-evaluate the six dimming speeds.
The results showed that when applying occupancy-based dimming with a short fading time (0-seconds condition), fewer than 55% of the users considered the
experienced conditions acceptable. The level of acceptance reduced even further (<40%) when dimming was applied with a delay after a user had left the office. Implementing dimming down with a fading time close to 2 seconds and dimming up with a fading time close to 5 seconds resulted in acceptance by more than 75% of the users, which is close to satisfaction levels found by Akashi and Boyce for static light in a typical US office10. Additionally, the study showed that acceptance of dimming was higher when applied without a time delay after the user left his desk. This corresponds to the results found by Akashi and Neches4 who found that feedback regarding the occurred change could
enhance the acceptance of the users. However, in today’s systems delays are
implemented to limit the risk of false negative detections. False negative detections could create unsatisfactory situations when lighting is dimmed while a person is still present. Finally, acceptance ratings of dimming differed when participants were informed about the potential occurrence of light changes. However, this was only significant when dimming down in 5 seconds as participants were more aware of and vigilant about
lighting changes. Regardless, acceptance ratings did remain within the positive part of the scale.
Based on the results of this first study with a student population, a follow-up study has been conducted in which a sub-set of the previous conditions, complemented with additional conditions were re-evaluated with a group of participants with an age more representative of typical office workers. The office set-up and procedures of the
experiment were kept identical to the first study. The follow-up study is reported in the paper presented here.
2.Method
An experiment in a mock-up office has been conducted to evaluate co-workers’
acceptance of illuminance reduction using different dimming speeds. While exposed to the conditions, participants were asked to perform an office-based task. At various times an actor was instructed to enter and leave the office to simulate a change in occupancy. The study was designed as a repeated measures within-subjects experiment.
2.1Test bed
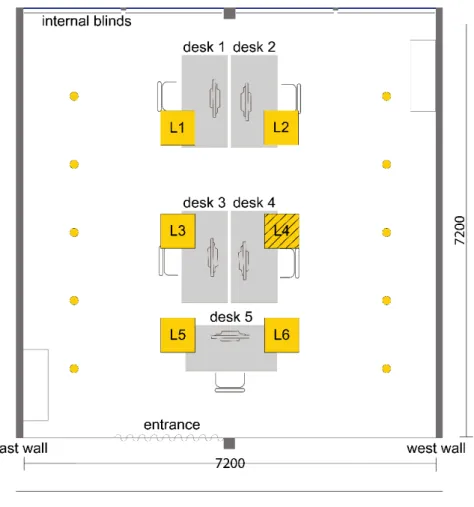
The study was conducted in a full-scale mock-up office of 7.2 m x 7.2 m x 2.8 m in a laboratory. The mock-up office was designed to mimic a situation in an open office space. The participants’ view included a part of the ceiling, an enclosing wall, multiple other work places, and a cabinet. Each workplace was equipped with a mouse, a
keyboard and a 24” LCD monitor, set to an identical screen luminance with an average of 100 cd/m2. Internal screens blocked daylight entrance, to exclude the impact of exterior light variations on the experiment, and to evaluate the more critical situation without daylight8. Desks 1-3, as illustrated in Figure 1, were used in the experiments by participants, and desk 4 by an actor who was briefed prior to the experiment. Desk 5 remained unoccupied during the experiment. All subjects had several luminaires in their field of view when looking straight ahead. Additionally, the remaining luminaires were visible when moving their head up or sideways
.
The electric lighting system of the mock-up office consisted of six dimmable recessed ceiling LED Luminaires (Philips, PowerBalance, 600 x 600 mm, 4000 K, Ra > 80, UGR < 16, 34S, 3400 lm) and ten LED spots (accent lighting, Philips, StyliD 4000 K, Ra > 80, SLED17, 2000 lm). The LED luminaires were installed with DALI drivers, using a logarithmic dimming curve. To evaluate the participants’ acceptance of
occupancy triggered dimming, luminaire L4 (Figure 1) was dimmed up and down using different dimming rates. To limit the influence of the walls on the perception of the space, the LED spots were used to keep the wall luminance as constant as possible11. During the experiment, the temperature in the office was kept constant at 21°C.
Figure 1. Floorplan of the mock-up office. To simulate occupancy-triggered dimming,
luminaire L4 was dimmed up and down using different dimming rates.
2.2 Participants
Based on the results of the previously conducted study9, statistical power calculations were done suggesting a required sample size of at least 17 participants. This follow-up study was performed with 27 subjects in the age range from 30 to 50 years (9 female and 18 male). All subjects were familiar with office work and have a bachelor’s degree or higher. Two subjects were excluded from the analyses due to drop-out and prior knowledge of the study objective. Inclusion criteria included, fluency in English and having normal or corrected-to-normal vision. The included subjects could be divided in two groups, the “co-workers” (n=17), also referred to as the participants, experiencing changes triggered by others, and the “actors” (n=8), entering and leaving the office space at unobtrusively indicated moments.
Data was collected in eight experimental sessions, all undertaken on weekday mornings of March 2015. Each subject participated in one experimental session. Each session had one actor, joined by up to three participants. The actor took his/her place behind desk 4 (Figure 1). Prior to the session, the researcher informed the actor about the
study objective. The actor was instructed to enter and leave the office space at specific moments, unobtrusively indicated by the researcher, without communicating with the other users in the office. All data generated by the actors are excluded from the analysis. In each session, the participants took their places behind desks 1, 2, or 3 (Figure 1) and were uninformed regarding the different role of the actor, and the objective of the
experiment. In total desk 1 was occupied by a participant six times, desk 2 five times, and desk 3 six times. The information provided to the participants was limited to their
involvement in a study assessing user satisfaction in an open office. After the experiment, the participants were fully informed about the study objective. Table 1 shows the
characteristics of the 17 participants.
2.3 Study design
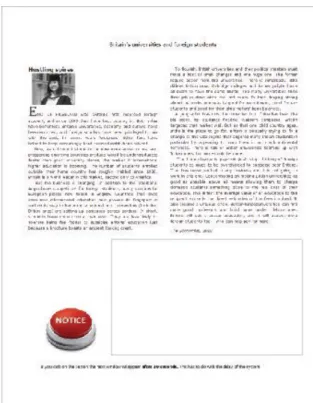
On the day of their participation, the subjects assembled at the reception of the facility, from where they were guided to the laboratory office. In the office, subjects were asked to take their places behind their allocated desks where they received the plenary introduction explaining the procedure of the experiment. Everyone was asked to turn off mobile phones, and not talk to each other during the experiment. In the introduction the objective “an experiment about satisfaction in an open office” was emphasized. Subjects were informed that the experiment will include surveys and a cognitive task, consisting of reading, thinking and writing. For the cognitive task participants were asked to read and summarize English text which were presented to them on a PC screen (positive polarity, font size 12), to represent a typical office task performed in offices nowadays. Subjects did not receive instructions about viewing directions. The subjects were asked to click on a red button, continuously visible at the bottom part of their screen (Figure 2), when they noticed a change in their environment. In the verbal instructions lighting, ventilation, and heating were mentioned as examples. A click on the button triggered an evaluation screen to pop-up in which they could indicate and evaluate the noticed change on a 7-point Likert scale ranging from ‘very unacceptable’ (1), via ‘neutral’ (4) to ‘very acceptable’ (7). As part of the introduction, the on-screen button was pushed by all subjects to get familiar with the options list for noticed changes and with the different screens. The participants were asked to look at the list, which included temperature, ventilation, sound, light, odour, occupancy, and ‘other’, which they could further specify. The participants were not informed that the changes occurring would be limited to lighting and occupancy changes only. After providing feedback via the red button, users were instructed to continue with the reading and summarizing task, until the experiment leader informed them to stop (approximately 1.5 hours later).
After the introduction, the subjects were asked to start by filling in a demographic survey, which included a repetition of the given instructions (Figure 3) and ask any remaining questions. All surveys were presented in English and questions could be answered by the experiment leader in English or Dutch. Subjects were informed that there were no right or wrong answers to either the survey or the task. After the subjects started with the cognitive task, the experiment leader took a position outside the test office outside of the view of the participants.
Figure 2. On-screen reading and summarizing task, with the ‘notice’ button to indicate a
change when observed
Figure 3. On-screen instructions participants had to read before continuing to the survey
During the reading task, the participants experienced different experimental conditions. Without informing the participants, every 5 or 10 minutes (when the setting incorporated a 5-minute delay), a next condition was started. On specific moments during the experiment, the actor behind desk 4 was discretely asked by the experiment leader to enter or leave the room, using an on-screen chat tool. To simulate occupancy triggered dimming of the lighting above desk 4, luminaire L4, was dimmed up or down
accordingly, simulating dimming up when occupancy is detected and dimming down when a desk becomes unoccupied.
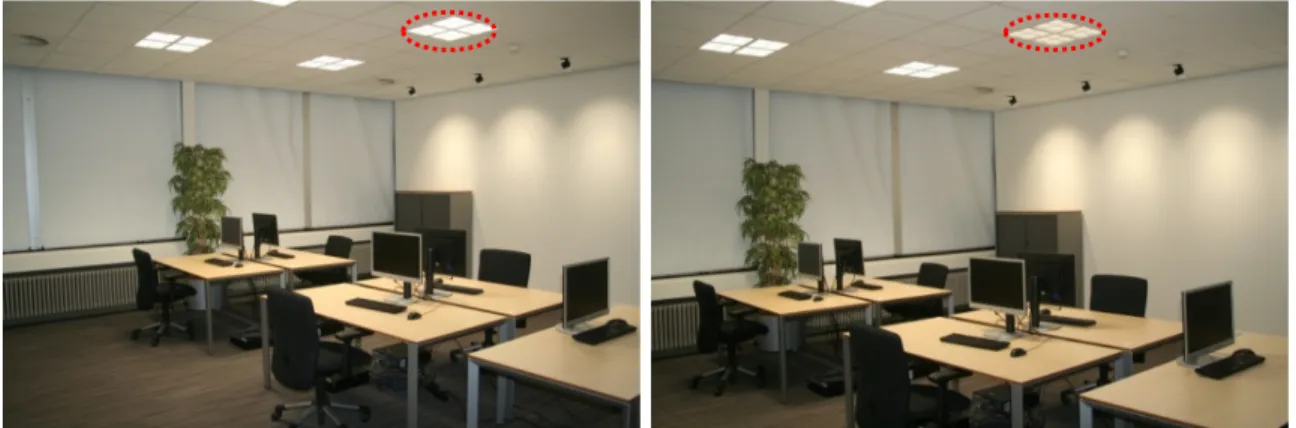
The lighting installation was designed to dim up, from a background illuminance level of 300 lx to a recommended office task illuminance of 500 lx, and vice versa1. During the study, only luminaire L4 was varied between these respectively ‘vacant’ and ‘occupied’ settings. Luminaire L4 was commissioned to deliver a light output as close to these principles as possible. Due to the distance between the luminaires and the properties of the light distribution some lighting spill-over did occur, influencing the illuminance level on the other desks as well. Luminaires L1, L2 and L3 remained in the ‘occupied’ setting of 30% luminaire light output, and luminaires L5 and L6 in the ‘vacant’ setting of 1% luminaire light output during the entire test. Table 2 presents the average horizontal illuminances measured on the different desks in the vacant and occupied settings, as well as the illuminance reduction at each desk relative to the desk’s initial illuminance. Figure 4 shows impressions of the room with luminaire L4 in the ‘occupied’ and ‘vacant’ state.
Figure 4. Impression of the room with luminaire L4 in the ‘occupied’ (left) and a
‘vacant’ state (right)
With various fading times, the conditions included dimming up immediately after the actor had entered the room and dimming down with a 5-minute delay after the actor had left the office. This delay simulates the delay often used in practice to avoid false detection of an unoccupied desk. To evaluate the influence of the occupancy change, additional conditions are tested where dimming occurred without an occupancy change, and conditions where the occupancy change did not include a light change.
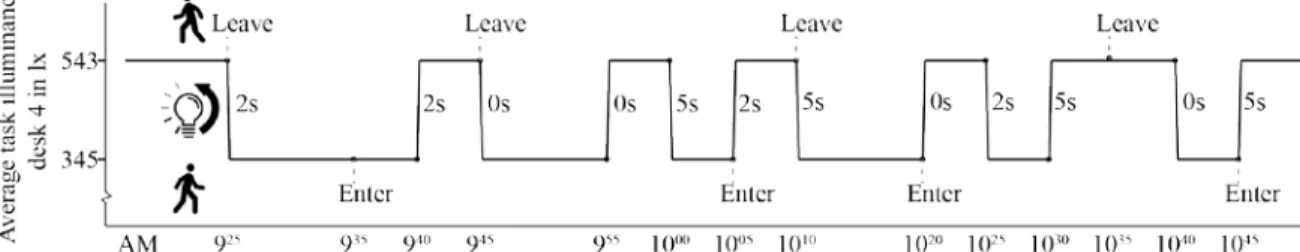
Based on previous studies3-5,8,9, the authors decided to evaluate the fading times of 0, 2, and 5 s while dimming luminaire L4 from an average desk illuminance for desk 4 of 345 lx to 543 lx, and vice versa.
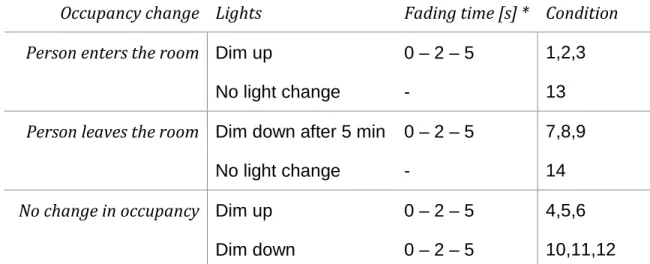
Table 3 provides an overview of the evaluated experimental conditions. Each participant experienced each of the 14 different conditions once. The conditions 4, 5, 6 and 10, 11, 12 consisted of a change in lighting alone. The conditions 13 and 14 consisted of an occupancy change alone. And the conditions 1, 2, 3 and 7, 8, 9 consisted of a
combination of a light and occupancy change. In each of the eight test sessions a different order of the conditions was used. Within the sequences, dimming up was always
followed by dimming down and vice versa, and the same holds for the entering and leaving of the actor. Figure 5 presents a schematic timeline of experimental session 1.
Figure 5. Schematic timeline of the conditions in experimental session 1, including the
moments the actor entered or left the office, and the direction and speed of the light changes. In each of the eight test sessions a different order of the conditions is used.
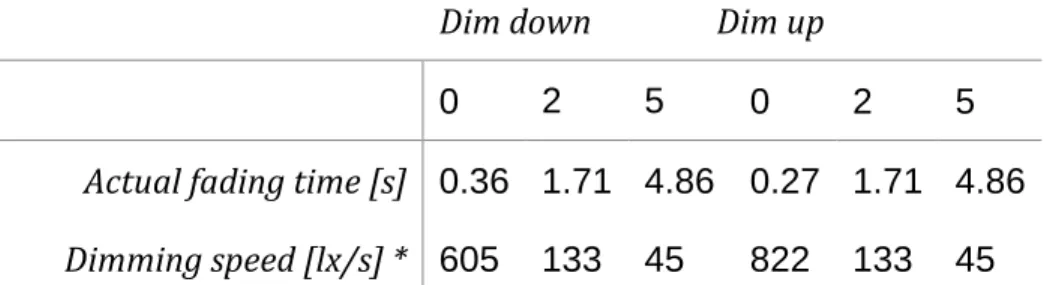
Even though the system was commissioned to dim instantaneously (i.e. within 0 s), the actual measured dimming took more time. Table 4 shows the actual fading time and dimming speed of the conditions, measured at a 0.09 s interval, which was the fastest possible sampling rate of the measurement equipment. Even though the exact fading times deviate, the rounded numbers, 0 – 2 – 5, will be used throughout this paper when referring to the different dimming behaviors.
2.4 Metrics
When participants noticed a light change, they were prompted to evaluate it on a 7-point Likert scale ranging from ‘very unacceptable’ [1], via ‘neutral’ [4] to ‘very acceptable’ [7]. For the analysis, this 7-point scale is extended to an 8-points acceptance scale. When a light change was not noticed by a participant, it is labelled with the highest rating for acceptance; ‘not noticed’ [8]. The noticeability is analyzed on a two-point scale, using the assigned values “noticed” [1] and “not noticed” [0].
Data is analyzed for an effect of the independent variables, by means of Mann-Whitney test and a Kruskal-Wallis test. Within-subjects Friedman tests and Wilcoxon Signed Ranks tests are used to explore effects of the dimming direction, speed and occupancy change.
3.Results
Over all experimental sessions, 232 changes were reported by the participants, of which 88 were light changes and 65 were occupancy changes (of which 51 were indicated as an occupancy change and 14 as other but specified as person entering or leaving the office). Other indications existed of temperature changes (21 indications), noise level changes (42 indications), ventilation changes (13 indications), or other changes (3 indications). This
paper focusses on the indications of light changes only. Only 43 percent of the executed light changes were indicated as noticed by the participants.
3.1 Independent variables
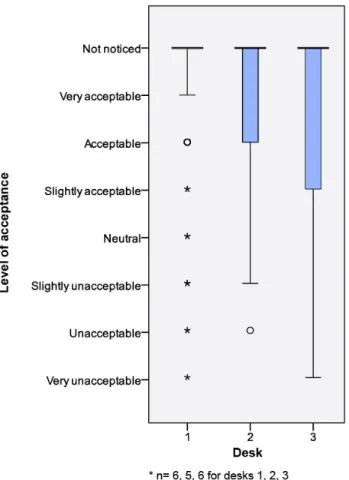
No statistically significant effect was found on the ratings of noticeability and acceptance for gender, age category, or day of the week on which the test was conducted (Table 5). The desk at which the participant sat during the experiment did show an effect on the noticeability and acceptance ratings. Light changes were most frequently noticed by users at desk 3, and least frequently by users at desk 1 (Table 6). The acceptance ratings follow that same pattern with desk 3 scoring lowest on mean acceptance ratings, and desk 1 the highest. Figure 6 shows the distributions of acceptance levels for the different desks in boxplots. It should be noted that even though equal desk occupation was pursued, desks 1 and 3 were occupied six times, and desk 2 five times. Due to the small sample size, no subdivision based on workplace will be made in further analyses.
Figure 6. Acceptance distributions plotted per desk in boxplots. Desks 1, 2, 3 show a
3.2 Ratings of acceptance
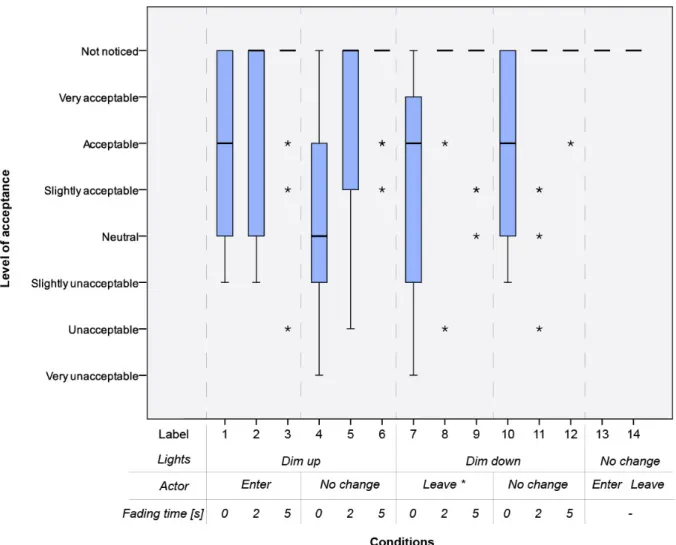
Distributions of the participants’ ratings of acceptance of the light change are presented in the boxplots of Figure 7. As can be seen, immediate dimming, with a fading time of 0 s, is noticed by most participants. The conditions with 5 s fading time are scarcely noticed. Table 7 presents the mean and standard deviation values of acceptance for each condition.
* Lights are dimmed down 5 min after the actor has left the office
Figure 7. Results of the evaluated conditions plotted in a boxplot. Conditions are sorted
on ascending label numbers. Characteristics of each condition are shown in the table at the bottom of the boxplot. Within the subgroups, indicated with the dotted line, the median values show increasing acceptance with increasing fading times.
3.3 Impact on acceptance
In the following paragraphs, the impact of dimming speed, dimming direction, and occupancy change on the acceptance ratings of the light changes is analyzed. 3.3.1 Dimming speed
The boxplots of Figure 7 suggest an increase in acceptance level with an increasing fading time for dimming, observable by the median values within each
subgroup. Using only the fading time as a variable, four groups are formed to analyze the effect of dimming speed on acceptance. A first group experiencing the situation in which a person enters the office and lighting is dimmed up immediately, using three fading times. A second group experiencing lighting being dimmed up using three fading times without a change in occupancy. A third group experiencing the situation in which a person leaves the office and after a five minutes delay lighting is dimmed down using three fading times. And a fourth group experiencing lighting being dimmed down using three fading times without a change in occupancy.
The analysis shows an effect of dimming speed on the acceptance levels for all conditions, as presented in Table 8. Post hoc tests, with a Bonferroni correction
(significance of p<0.0167) are performed to analyze between which fading times these effects occur. Results of the combinations that have a significant effect are reported in Table 9.
The tests show that all groups have a statistically significant difference in acceptance of fading in 0 s versus 5 s. The ratings of the 2 s conditions are always in between the ratings of 0 s and 5 s, as can be seen in the boxplots of Figure 7. None of the groups shows a significant difference between 2 s and 5 s fading. For dimming up
without an occupancy change and dimming down after an occupancy change a significant difference between fading in 0 s and 2 s was found.
3.3.2 Dimming direction
Using only the dimming direction as a variable, groups are formed to analyze the effect of the direction of dimming on the acceptance level. To exclude the impact of a person entering or leaving the office (5 min prior to the light change due to the delay), only the conditions without an occupancy change are considered. The test showed no statistically significant effect of dimming direction on the acceptance level. Results are presented in Table 10.
3.3.3 Occupancy change
Using only the occupancy change as a variable, the data is analyzed for an effect of occupancy change on the acceptance level of the light change. Pairs are formed of conditions with similar dimming directions and fading times, with and without being linked to an occupancy change. The test showed no significant effect of occupancy change on dimming acceptance in all but one condition. Results are presented in Table 11.
3.4 Acceptable dimming
To create an overview of acceptable conditions, ratings of ‘acceptable’ or higher are isolated and plotted for each condition. Figure 8 shows the percentage of participants that evaluated a condition within this higher part of the scale. Ratings of ‘slightly
acceptable’ and lower are considered unacceptable. The overview clearly shows that the acceptable conditions are to a substantial extent made up of light changes that are not noticed by the participants.
Figure 8. Fraction of participants that rated lighting conditions as acceptable, very
acceptable, or not noticed. Conditions are sorted on ascending label numbers. Characteristics of each condition are shown below the boxplot.
Akashi and Boyce report that with static lighting, 70% of the office workers in a typical US office is satisfied with the lighting10. When using this same threshold of satisfied users similar levels can be reached for acceptance of dynamic lighting using a dimming time of at least 2 s.
4. Discussion
4.1 Study design
As calculated in advance, 17 participants appeared sufficient to show statistically significant differences between the tested conditions. Due to the small sample size, no subdivision based on workplace is made in the analyses of the data. However, the desk behind which the participants evaluated the conditions did influence the acceptance of light change ratings. Due to the office layout and lighting characteristics this effect is not surprising. Desk 3 is most influenced by the absolute desk illuminance reduction when dimming, due to lighting spill-over from luminaire L4 (Table 2). Additionally, the users at desk 3, (facing desk 4) had luminaire L4 in their direct field of view (Figure 1). Desks 1 and 2 are situated next to desks 3 and 4, with a space in between, and as a result
experience less lighting spill-over and have the luminaire L4 and desk 4, both subjects of change, less prominently in their visual field.
The task performed during the study was designed to avoid a constant focus on the screen (combining reading, thinking and writing). Participants were not restricted in their viewing directions and did not receive instructions to specifically look around during the task. Participants’ actual viewing behaviour depended on the individual and was not captured. Instructing users to observe luminaires during the study is expected to negatively impact the acceptance of light changes.
4.2 Test conditions
Dimming up in 0 s resulted in a higher score on acceptance when linked to an occupancy change compared to not being linked to an occupancy change. Dimming down in 0 s did not show this effect. This might be due to the relatively long delay between the moment the actor left the workplace and the light change (5 min), causing participants to not experience the two events as correlated.
In conditions 13 and 14, the actors were asked to enter or leave the room without an accompanying light change. None of the participants reported noticing a light change during these conditions. This supports the assumption that participants did not report a noticed light change in the experiment based on an expectation of its occurrence but instead based on their actual observation.
The standard EN12464-11 recommends a desk illuminance of 500 lx for office tasks (writing, typing, reading) and an illuminance of 300 lx for the immediate
surrounding area. In this study dimming was limited to this range to achieve a situation that represents an actual office condition. This limited range could have impacted the outcome, as Krzyszczuk and Boyce report that each initial illuminance level has its own relative threshold value for detection of change3. For an initial illuminance of 475 lx detection of change was after 22% dimming, and for 1095 lx this was after 17% dimming. Akashi and Neches reported that the probability of detection of illuminance
reduction increases as the target illuminance decreases4. In the latter study the increased
illuminance delta was accompanied with an increasing speed which could have
influenced the detection probability, due to the increase in perceptible steps with a larger dimming range1. As such, the use of a more extreme range of dimming is therefore expected to influence the noticeability and acceptance of dimming.
Based on previous research, wall luminance and uniformity are expected to influence behaviour of users and perception of the space11. In this study that influence is limited by using accent lighting spots to keep the wall illumination as constant as possible.
Excluding the accent lighting is expected to increase the effect of dimming of luminaire L4 on the perceived scene brightness. Noticeability and acceptance ratings would than include the effects of changes in perceived scene brightness instead of limiting them to dimming conditions above a colleagues’ desk.
4.3 Unnoticed occupancy changes
In total only 65 of the 136 occupancy changes were flagged by the participants. To not emphasize its occurrence, capturing occupancy changes was not mentioned during the verbal instructions. Occupancy, was however shown in the on-screen list during the introduction instructions. Participants were informed that different people could have different tasks during the test, to avoid participants from leaving the office, when observing the actor to do so. In informal conversations after the test, some participants indicated that they assumed entering and leaving the office was part of the task of that person and they did not always report this.
As with the occupancy changes, no time and order effects were found for the reported light changes suggesting that participants did not become more focused nor indifferent on reporting noticed changes later in the experimental session. Even though the participants’ attention was directed away from solely lighting, participants might still be more focused on lighting, due to the location of the study (Philips office laboratory).
14 of the occupancy indications were registered as “other” but specified by the participants as an occupancy change. Even though mastering the English language was part of the inclusion criteria, it could be that some subjects were not familiar with the term “occupancy”, influencing the indications provided. None of the participants however indicated during or after the test that they were unfamiliar with the term.
No significant effect was found for indications of occupancy changes between the desks. Therefore, it is not expected that the workplace limits people from observing an occupancy change. A significant effect of desk is only found for the indication of light changes, with the highest number of the light changes being indicated from the desk opposite to the actor and lowest number of indications from the desk diagonally positioned from the actor. This is in line with the expected influence of dimming of luminaire 4 on the average illuminance of the desks. The unreported light changes are expected to be unnoticed by the participants, and not to be consequences of the study design.
4.4 Mock-up office vs. real office
In an actual office situation changes due to occupancy might be less frequent than every 5 or 10 minutes (depending on the type of work). It is expected that in this study a more critical situation is evaluated where users were exposed to more frequent changes. In this study it was decided to block daylight by internal screens. By eliminating daylight influences, identical conditions could be tested in the different experimental sessions. As also measured by Newsham and colleagues8, inclusion of daylight is expected to result in higher acceptance of all conditions. This could be caused by the already dynamic
character of daylight, or due to larger perceptible steps of lighting at higher illuminance levels1. Even though real offices do have daylight inclusion, situations with limited daylight, due to weather conditions, season, geographical location, or office design, need to be considered when specifying the dimming characteristics of the system.
5. Conclusions
This study evaluated the acceptance of occupancy-triggered dimming of a single luminaire above a colleague’s desk, in the users’ visual field, for office workers in the age range of 30 - 55 years. The luminaire was dimmed from an average of 345 lx to 543 lx horizontal desk illuminance, and vice versa. The influence of dimming speed, dimming direction and feedback regarding the reason of dimming were assessed.
The results show an effect of the dimming speed on the acceptance of an illuminance change by the co-worker. The co-worker’s acceptance increases with an increasing fading time for dimming. For the illuminances studied, significant differences for acceptance are found between dimming up at 822 lx/s versus 45 lx/s, and between dimming down at 605 lx/s versus 45 lx/s. In the examined illuminance range, the study showed no significant effect of dimming direction on the acceptance levels of the co-workers. Most conditions did not show an effect of co-workers visually observing a person triggering the change by entering or leaving the office space, on the acceptance levels. However, dimming up at 822 lx/s, from 345 to 543 lx, did show an effect, being rated significantly higher in acceptance when co-workers could link the event to a person entering the office compared to no change in occupancy.
When dimming with a fading time close to zero (up to 0.27 s), less than 60% of the population rates the conditions as acceptable. However, by applying occupancy-based dimming on desk level while using a fading time of at least 1.71 s, an acceptance of at least 70% can be achieved, which is comparable to the level reported by Akashi and Boyce for users’ satisfaction in a typical office in the US with static lighting10. Dimming with a fading time of 4.86 s or higher will not be noticed by at least 80% of the
population of typical office age, as examined here. These conclusions all apply to dimming between a minimum illuminance of 345 lx and a maximum illuminance of 543 lx.
The student population of our first experiment9 did show a slightly more critical
noticeability threshold, with 75% of the student population noticing the change when lighting was dimmed with a fading time of 4.86 s. The acceptance levels of the age group more representative of typical office workers presented here, support the acceptance results of the earlier experiment with the student population.
Funding
Acknowledgements
This research was performed within the framework of the strategic joint research program on Intelligent Lighting between TU/e and Philips Lighting B.V. The authors thank T. Lashina, M. Aarts and A. de Vries for the valuable discussions and their input in the early design phase of the protocol.
References
1. Netherlands Standardization Institute. NEN-EN 12464-1. Light and Lighting - Lighting of Work
Places - Part 1: Indoor Work Places. Delft: NEN, 2011.
2. International WELL Building Institute. The WELL Building Standard. New York: IWBI, 2016.
3. Krzyszczuk KM, Boyce PR. Detection of slow light level reduction. Journal of the Illuminating
Engineering Society 2002; 31(2): 3–10.
4. Akashi Y, Neches J. Potential recommendations for illuminance reductions by load-shedding.
Lighting Research and Technology 2005; 37(2): 133–53.
5. Akashi Y, Neches J. Detectability and acceptability of illuminance reduction for load shedding.
Journal of the Illuminating Engineering Society 2004; 33(1): 3–13.
6. Shikakura T, Morikawa H, Nakamura Y. Perception of lighting fluctuation in office lighting
environment. Journal of Light and Visual Environment 2003; 27: 75–82.
7. Newsham GR, Mancini S. The potential for demand-responsive lighting in non-daylit offices.
Leukos 2006; 3(2): 105–120.
8. Newsham GR, Mancini S, Marchand RG. Detection and acceptance of demand-responsive
lighting in offices with and without daylight. Leukos 2008; 4(3): 139–156.
9. Creemers PTJ, van Loenen EJ, Aarts MPJ, Chraibi S, Lashina TA. Acceptable fading time of a
granular controlled lighting system for co-workers in an open office. Proceedings of Experiencing Light 2014. 10-11 November, 2014, Eindhoven, the Netherlands: pp. 70–73.
10. Akashi Y, Boyce PR. A field study of illuminance reduction. Energy and Buildings 2006; 38(6): 588–599.
11. Chraibi S, Crommentuijn L, van Loenen EJ, Rosemann ALP. Influence of wall luminance and
uniformity on preferred task illuminance. Building and Environment. 2017; 117: 24–35.
Figure captions
Figure 9. Floorplan of the mock-up office. To simulate occupancy-triggered dimming,
luminaire L4 was dimmed up and down using different dimming rates.
Figure 10. On-screen reading and summarizing task, with the ‘notice’ button to indicate
a change when observed
Figure 11. On-screen instructions participants had to read before continuing to the survey Figure 12. Impression of the room with luminaire L4 in the ‘occupied’ (left) and a
‘vacant’ state (right)
Figure 13. Schematic timeline of the conditions in experimental session 1, including the
moments the actor entered or left the office, and the direction and speed of the light changes. In each of the eight test sessions a different order of the conditions is used.
Figure 14. Acceptance distributions plotted per desk in boxplots. Desks 1, 2, 3 show a
descending acceptance. All desks have median values at the highest acceptance rating.
Figure 15. Results of the evaluated conditions plotted in a boxplot. Conditions are sorted
on ascending label numbers. Characteristics of each condition are shown in the table at the bottom of the boxplot. Within the subgroups, indicated with the dotted line, the median values show increasing acceptance with increasing fading times.
Figure 16. Fraction of participants that rated lighting conditions as acceptable, very
acceptable, or not noticed. Conditions are sorted on ascending label numbers. Characteristics of each condition are shown below the boxplot.
Table 1. Characteristics of the participants
Gender Age category Visual aids
Female: 3 30-35 years: 10 Glasses: 7
Male: 14 35-40 years: 5 Contact lenses: 4
45-50 years: 2 Glasses only when reading: 2
Table 2. Overview of the measured average horizontal desk illuminance in the occupied
and vacant state
Eavg,desk1 [lx] Eavg,desk2 [lx] Eavg,desk3 [lx] Eavg,desk4 [lx]
All desks occupied 571 539 549 543
Desk 4 vacant 521 489 455 345
% of reduction from
Table 3. Characteristics and labels of the evaluated conditions. The evaluated conditions
include variations in occupancy change, and direction and speed of the light change.
Occupancy change Lights Fading time [s] * Condition
Person enters the room Dim up 0 – 2 – 5 1,2,3
No light change - 13
Person leaves the room Dim down after 5 min 0 – 2 – 5 7,8,9
No light change - 14
No change in occupancy Dim up 0 – 2 – 5 4,5,6
Dim down 0 – 2 – 5 10,11,12
Table 4. Fading times evaluated in the study
Dim down Dim up
0 2 5 0 2 5
Actual fading time [s] 0.36 1.71 4.86 0.27 1.71 4.86
Dimming speed [lx/s] * 605 133 45 822 133 45
Table 5. Results of the statistical tests showing the effect of the independent variables,
participants’ gender, age, participation day of the week, and desk, on the noticeability and acceptance of the test conditions.
Gender a Age b Day b Desk b
Noticeability Value -1.180 a 2.205 b 4.327 b 9.270 b
Significance (2-tailed) 0.238 0.332 0.228 0.010
Acceptance Value -1.265 a 4.085 b 2.882 b 8.983 b
Signficance (2-tailed) 0.206 0.130 0.410 0.011
a) Mann-Whitney U, Z value (p<0.05)
Table 6. Frequencies of noticed light changes per desk
Desk Noticed Not noticed Total
1 21 63 84
2 21 49 70
Table 7. Mean and standard deviation (SD) of the acceptance level values for each
condition. The acceptance scale ranges from 1 to 8, with higher values for higher acceptance ratings. Conditions 1 2 3 4 5 6 7 Mean 5.76 6.41 7.35 4.35 6.65 7.59 5.12 SD 1.985 2.123 1.618 1.902 1.967 0.939 2.315 Conditions 8 9 10 11 12 13 14 Mean 7.53 7.41 5.65 7.06 7.88 8.00 8.00 SD 1.505 1.326 2.120 1.853 0.458 0.000 0.000
Table 8. Results of the statistical analysis of the impact of dimming speed on acceptance
ratings
0 vs 2 vs 5 s Labels Chi-Square a df Asymp. Sig. a
Person enters, dim up 1 – 2 – 3 6.343 2 0.042
No occ. change, dim up 4 – 5 – 6 24.041 2 0.000
Person leaves, 5-min delay,
dim down 7 – 8 – 9 23.581 2 0.000
No occ. change, dim down 10 – 11 – 12 14.684 2 0.001
Table 9. Results of the post hoc tests showing the conditions where dimming speed
showed an impact on the acceptance ratings
Conditions 3 – 1 5 - 4 4 - 6 8 - 7 7 – 9 10 – 12
Z a -2.567 b -3.189 b -3.432 c -3.201 b -3.205 c -2.953 c
Asymp. Sig.
(2-tailed) a 0.010 0.001 0.001 0.001 0.001 0.003
a) Wilcoxon signed-rank tests, with a Bonferroni correction (p<0.0167) b) based on negative ranks
Table 10. Results of the statistical analysis of the impact of dimming direction on
acceptance ratings
Dim up vs dim down Labels Z a Asymp. Sig.
(2-tailed) a
No occ. change, dim in 0 s, up vs down 4 – 10 -1.902 b 0.057
No occ. change, dim in 2 s, up vs down 5 – 11 -0.933 b 0.351
No occ. change, dim in 5 s, up vs down 6 – 12 -1.342 b 0.180
a) Wilcoxon Signed Ranks Test b) Based on negative ranks
Table 11. Results of the statistical analysis of the impact of occupancy change on
acceptance ratings
With vs without occupancy change Labels Z a Asymp. Sig.
(2-tailed) a Dim up in 0 s 1 – 4 -2.742 b 0.006 Dim up in 2 s 2 – 5 -0.410 c 0.682 Dim up in 5 s 3 – 6 -0.447 c 0.655 Dim down in 0 s 7 – 10 -0.634 c 0.526 Dim down in 2 s 8 – 11 -1.084 b 0.279 Dim down in 5 s 9 – 12 -1.604 c 0.109
a) Wilcoxon Signed Ranks Test b) Based on positive ranks c) Based on negative ranks