School of Innovation, Design and Engineering
The application of system dynamics and
discrete event simulation in supply chain
management of Swedish manufacturing
industries
Mansour Ahmadi
Mansoor.ahmadi@gmail.comMaster thesis work
Product and process development
Innovative Production
This thesis work has been carried out at the School of Innovation, Design and Engineering in Mälardalen University within the subject area of Innovative Production. The work is part of two years Master of Science program. The author takes full responsibility for opinions, conclusions and findings presented.
Report Code: **** Examiner: Sabah Audo Supervisor: Sabah Audo Scope: 30 credits, D-level Date: 2012.11.09
Abstract
Increasing competition from traditional and emerging channels has placed new emphasis on rapid innovation and continuous differentiation in every aspect of supply chain, from earliest production stage to the final distribution steps. To bridge the gap between brilliant ideas and successful business initiatives, leading companies implement engineering simulation particularly in logistics and supply chain management (LSCM). Discrete event simulation (DES) and system dynamics (SD) are two modeling approaches widely used in this field. However there are not much done researches about the applications of these simulation approaches in supply chain context of Swedish Manufacturing Industries (SMI). This study explores the application of DES and SD in LSCM of SMI by looking at the nature and level of issues modeled. Journal papers and master theses that use these modeling approaches to study supply chains, published between 1990 and 2012 are reviewed. A total of 39 articles are analyzed to identify the frequency with which the two simulation approaches are used as modeling tools in LSCM of SMI. Our findings suggest that DES has been used more frequently to model supply chains in SMI. The results also show that not all the LSCM issues have been addressed evenly and generally tactical/operational issues have been modeled more frequently. The results of this study inform the existing literature about the use of DES and SD in LSCM of SMI.
Keywords: Discrete event simulation, System dynamics, Logistics and supply chain
Acknowledgements
I would like to gratefully acknowledge the support of the Mälardalen University which gave me the opportunity of using scientific databases. I’m thankful for my supervisor and Examiner Mr. Sabah Audo and his endless support, guidance, ideas, and persistence during this study. I appreciate my professors in school of Innovation and Design, Dr. Erik Dahlquist and Dr. Mats Jackson who gave me a working knowledge of the simulation modeling. I am pleased to give my great gratitude to Professor Rolf Lövgren for his great guidance in the field of research and scientific method.
This thesis would not have been possible without moral support from my beloved mother and I am grateful for her encouragement in every aspect of my life.
Contents
1. Introduction ... 6 1.1 Aim of study ... 6 1.2 Problem Statement ... 7 1.3 Research delimitation ... 7 2. Theoretical Background ... 82.1 Swedish Manufacturing Industries (SMI) ... 8
2.2 Innovation and competitiveness in SMI ... 9
2.3 Simulation: a tool for Innovation ... 10
2.4 Simulation Modeling ... 10
2.5 Discrete event logistics system ... 12
2.6 System theory point of view on discrete event logistics systems ... 13
2.7 Modeling for Discrete event logistics system ... 15
2.8 System dynamics modeling ... 17
2.8.1 Causal Loop Diagramming ... 20
2.8.2 Continuous Simulation ... 22
2.8.3 OR Techniques ... 22
2.9 Discrete Event Simulation ... 22
2.10 SD and DES: Comparison and use ... 25
3. Research approach ... 27
3.1 Identification of journal articles and simulation approach adopted ... 27
3.2 Creation of a schema for classifying papers by LSCM issue ... 27
3.3 Distinguishing between strategic and operational/tactical LSCM issues... 28
3.4 Classifying papers by the LSCM issues addressed ... 30
4. Result ... 33
4.1 The frequency of use of DES and SD in LSCM context of SMI ... 33
4.2 Most frequently modeled LSCM issue... 34
4.3 The focus of modeling efforts on strategic and operational/tactical levels ... 36
4.4 Some companies involved ... 40
5. Analysis and Discussion ... 42
References ... 48 Appendix 1. Articles abstracts ... 54 Appendix 2. The LSCM issues explained... 64
1. Introduction
World Economic Forum 2010 competitiveness index ranks Sweden 2nd most competitive, behind Switzerland [61]. Increasing competition from traditional and emerging channels has placed new emphasis on rapid innovation and continuous differentiation in every aspect of supply chain, from earliest production stage to the final distribution steps. To bridge the gap between brilliant ideas and successful business initiatives, leading companies in Swedish manufacturing industries (SMI) implement engineering simulation, particularly in logistics and supply chain management (LSCM). Discrete event simulation (DES) and system dynamics (SD) are two modeling approaches widely used in this field. However, an organized and conclusive review of simulation modeling efforts does not yet exist. This thesis tries to explore the application of DES and SD in LSCM context of SMI with a view to identifying the nature and level of their use. The nature of use is defined in terms of the type of LSCM issues modeled using DES and SD. The level of use refers to where on a continuum between strategic and operational/tactical the LSCM issue being addressed lies. These information is used later to answer research questions about the more frequently used approach, more frequently addressed issue and the focus of modeling studies in operational-strategic spectrum.
Research’s contribution is three parts. First, it sheds light on simulation modeling efforts of LSCM issues in SMI. Second, it brings useful insights about classification of LSCM issues from simulation modeling point of view. Thirdly it informs the existing literature, industries involved and newcomers to this field about the use of DES and SD in LSCM of SMI.
Around 39 Journal articles and master theses that published between 1990 and 2012 and report the application of simulation models in LSCM of SMI were identified through searching the scientific databases. Founded articles were reviewed to identify the addressed LSCM issues which later classified into a 17-category schema devised by A.A.Tako and S.Robinson [1]. This classification was later used to compare the different LSCM issues based on the frequency of use. The focus of applications was examined later based on where on the continuum between strategic and operational/tactical the majority of addressed issues laid.
The rest of this thesis is structured as follows. In the next section, the theoretical background about the significance of simulation, discrete event logistics systems and modeling approaches are presented. This is then followed by a description of the review approach taken, including the identification of journal articles and the simulation approach adopted, the creation of a schema for classifying the LSCM issues modeled, and the identification of whether these issues lie within the strategic, tactical or operational level. The results of the literature search are presented in Section 4. Chapter 5 shows the analysis of the result and a short discussion. Finally, Section 6 concludes the paper, including suggestions for further work.
1.1 Aim of study
According to Teknikföretagen, Swedish manufacturing industries (SMI) included 3600 companies with nearly 300,000 employees account for nearly half of Swedish goods exported.
Simulation can dramatically reduce a product’s time to market, mitigate the risk of change management and even help to protect brand images. Not investing in engineering simulation could put organizations at a competitive disadvantage. Two widely used simulation methods in logistics and supply chain management (LSCM) of SMI are discrete event simulation (DES) and system dynamics (SD).
The aim of this study is to describe the use of DES and SD as simulation modeling approaches in LSCM of SMI, looking specifically into the nature and level of issues modeled. This study tries to help new comers to this field and corresponding companies and industries to get better picture of simulation modeling efforts in SMI.
1.2 Problem Statement
The study is based on a review of journal articles that describe the application of DES and SD to LSCM issues in SMI and tries to answer the following three research questions:
Which method has been applied more?
What are the most frequently addressed LSCM issues?
How is the distribution of applications over tactical-strategically continuum?
The answer to these questions bring useful insights about different simulation approaches used in the field of logistics and supply chain modeling of Swedish Manufacturing Industries.
1.3 Research delimitation
The search included journal articles, conference papers and Master Dissertations published during the 22 years period, between 1990 and 2012. The search was limited to journal papers, master dissertations and conference papers and no books were included. Given that the aim of this study is to explore the DES and SD modeling work in LSCM, other simulation approaches such as agent-based modeling and Monte Carlo simulation have been waived. In addition, Swedish manufacturing industries here imply all Sweden-registered companies. This is simply found by asking whether company involved is located in Sweden!
2. Theoretical Background
In this chapter, Swedish Manufacturing Industries (SMI) is presented shortly and the importance of simulation for their Innovation and competitiveness is explained briefly. Definition and purpose of simulation modeling comes next and its functioning in discrete logistics systems is elaborated thereafter. This is then follows by simulation modeling main methods for Discrete Logistics Systems included system dynamics and discrete event simulation and their subtypes. A short comparison between two approaches in terms of framework and use comes at last.
2.1 Swedish Manufacturing Industries (SMI)
Sweden's world-class domestic industries created in the 17th century from its vast natural resources of forests, rich iron ore and waterpower. Over the course of the 20th century, Swedish industry has developed from traditional sectors with lower added value, such as wood and iron ore processing, to modern industries with a higher degree of skill and technology input, such as automobiles and precision and specialized engineering. The change of priorities became even more apparent in the 1990s, with the emergence of new research-intensive industries, such as information technology and pharmaceuticals, which replaced the more traditional engineering industries as the driving force of growth and business activity [58].
During this transition, some sectors, like textiles and iron, contracted considerably while others, such as shipbuilding, have all but disappeared, but Swedish restructuring has been smooth in terms of economic and social stability. By 2000, major industries included information technology (telephone, radio, and computer equipment), communications, pharmaceuticals, precision equipment (bearings and armaments), high-quality steel, automobiles, electrical motors and other electrical equipment, printed and published goods (including software and popular music), home and office furnishings, and processed foods. Most of the manufacturing plants are private and small, though Sweden also accounts for 29 of the 500 largest companies in Europe, perhaps the highest number per capita in the world). Several of the world's most sophisticated and diversified engineering companies bear Swedish names, although many of them are now foreign-owned or in multinational cooperation. They include, among others, Volvo, Saab, Scania, Electrolux, SKF, and ABB. The most dynamic sector by the late 1990s was telecommunications and information technology, with Ericsson being the most outstanding company in that field [58].
The automotive sector, one of the most important industries, has lived through major changes in the 1990s due to global restructuring and consolidation. General Motors acquired a 50 percent equity stake in Saab in 1989, and GM acquired the remaining stake in 1999. In 1999, Volvo sold its car division to the Ford Motor Company. Volvo shifted gears to concentrate on commercial transport equipment, and in 1999 acquired 75 percent of Scania, the second major Swedish truck maker. Volvo thus became one of the world's largest manufacturers of heavy vehicles. Sweden also is a major manufacturer of pharmaceuticals; its Pharmacia Company merged in 1995 with
the U.S. group Upjohn, while Astra merged in 1998 with British Zeneca, to form AstraZeneca [58].
During the 1990s, the information technology industry has been by far the fastest-growing sector in Sweden. In 1999, the country had more than 250 information technology companies (including foreign-owned ones) with annual revenue of more than US$10 million, and a huge number of smaller ones. By far the largest of them was Ericsson, with net sales of US$26 billion in 1999. Telia was its second largest company, in net sales and employees. Many important international information technology companies, including Intel, Microsoft, Hewlett-Packard and Nortel, have chosen Sweden as the base for their European operations or for advanced research and development [58].
The 20 largest Sweden-registered companies by turnover in 2007 were Volvo, Ericsson, Vattenfall, Skanska, Sony Ericsson Mobile Communications AB, Svenska Cellulosa Aktiebolaget, Electrolux, Volvo Personvagnar, TeliaSonera, Sandvik, Scania, ICA, Hennes & Mauritz, Nordea, Preem, Atlas Copco, Securitas, Nordstjernan and SKF [59].
2.2 Innovation and competitiveness in SMI
According to Teknikföretagen, SMI included 3600 member companies with nearly 300,000 employees account for nearly half of Swedish goods exported. Swedish companies also have a large local production in growing markets such as China, India and Brazil, which supplements the exports from Sweden [60].
For Sweden’s part, sales and production on growing markets have made industrial activity in Sweden more knowledge-intensive. This is shown by the fact that Swedish engineering companies have clearly more white-collar than blue-collar employees. At the same time, company activities are increasingly integrated across national boundaries and global corporate cultures are being cultivated [60].
World Economic Forum 2010 competitiveness index ranks Sweden 2nd most competitive, behind Switzerland [61]. In addition Sweden is considered to be one of the most advanced countries in terms of innovation. According to the book, The Flight of the Creative Class, by the U.S. urban studies, Professor Richard Florida of University of Toronto, Sweden is ranked as having the best creativity in Europe for business and is predicted to become a talent magnet for the world’s most purposeful workers. The book compiled an index to measure the kind of creativity it claims is most useful to business — talent, technology and tolerance [62]. Definitely high creativity and innovation has been one of the main reasons which help SMI to maintain this level of competitiveness. Simulation in its turn is one of the tools which contribute a lot to facilitation of innovation process in SMI.
2.3 Simulation: a tool for Innovation
With SMI companies betting their futures on product and process development, the cost of being wrong and the value of being right have never been greater. External market conditions are squeezing the margin for error to the point where they cannot afford (and maybe not even survive) even one instance of being wrong. At the end of the day, executives at every level need to have confidence that the product and process they envisioned is the ones that makes it to market.
In addition, today's declining price points and margins have forced manufacturers to drive costs out of every aspect of their supply chain, from earliest production stage to the final distribution steps. At the same time, increasing competition from traditional and emerging channels has placed new emphasis on rapid innovation and continuous differentiation.
To bridge the gap between brilliant ideas and successful business initiatives, leading SMI companies implement engineering simulation. Simulation is a method which contributes to innovation process by facilitation of virtual experimentation. Joe Tidd and Scott Isaksen in their book “Meeting the Innovation Challenge” name the Visualization as a tool for innovation management and define it as “a method that consists of creating a mental image of a desired outcome, and repeatedly playing that image in the mind [63]”.
Simulation can dramatically reduce a product’s time to market, mitigate the risk of change management and even help to protect brand images. Not investing in engineering simulation could put organizations at a competitive disadvantage.
2.4 Simulation Modeling
Simulation modeling, which mimics the real-world experiment, can be seen as virtual experimentation, allowing one to answer questions about the behavior of a system. As such, the particular technique used does not matter. Whereas the goal of modeling is to meaningfully depict a system presenting information in an understandable, re-usable way, the aim of the simulation is to be fast and accurate. A simulation model is a tool for achieving a goal (design, analysis, control, optimization . . .) [52]. Therefore a fundamental prerequisite is some assurance that conclusions drawn from modeling and simulation (tools) can be accepted and applied with confidence. The establishment of this confidence is associated with two distinct activities; namely, verification and validation [51].
The simulation activity is part of the larger model-based systems analysis approach. A simple
process model for these activities is depicted in Figure 1. The approach starts by identifying an Experimental Frame. The frame determines the experimental conditions under which the modeler wants to investigate the system. It reflects the modeler's goals and questions, possible inputs to the system, output processing and depiction of the conditions under which the system (be it real or modeled) match. Through structure characterization, the appropriate model structure is selected based on a priori knowledge and measured data. A suitable model can be built and subsequently, during model calibration, parameter estimation makes optimal parameter values for reproducing a set of measurement data. From the model, a simulator is built. With every use of the simulator, this question must be asked whether the model has predictive validity: is it capable not only of reproducing data which was used to choose the model and to estimate parameters but also of predicting new behavior? The user determines whether validation is included in the process. In Figure 1, the feedback arrows indicate the correction process of modeling errors at each stage [51]. A desirable feature of the validation process is the ability to provide hints to the location of modeling errors [53]. Simulation modeling is often used in supply chain context especially as virtual experimentation. Since the focus of study is about Swedish manufacturing industries, next section investigates their supply chain context from systemic point of view.
2.5 Discrete event logistics system
Modeling LSCM issues of manufacturing industries is classified as DELS issues. Networks of resources, through which goods and people flow, are called Discrete Event Logistics System (DELS). The term logistics refers to the fact that there are physical flows. Each node of the network corresponds to some resource or set of resources by which the materials are either converted in some way, i.e., refined, shaped, assembled, disassembled, etc., moved, i.e., transported within one facility or between facilities, or simply held for some period of time as work-in-process (WIP) or stored in a warehouse. Material handling and transportation are key components of DELS. DELS can be found in such domains as transportation, distribution, and manufacturing. DELS are discrete because they move material in discrete quantities, and because their behavior can be characterized effectively in terms of events happening at discrete points of time, i.e., the start or end of some conversion, transport, or storage process. While logistics systems are typically discrete, the term ‘‘discrete’’ refers to the fact that DELS are not related to production logistics in process industries, i.e., for example, in manufacturing processes inside a refinery. A DELS may range from simple to complex. They may take the form of a single warehouse, a portion of a factory, a complete factory, or a global supply network [2].
There are several examples of DELS in related literatures. The wafer fab which produces integrated circuits (also called chips) is one of them. A semiconductor chip is a highly miniaturized, integrated electronic circuit consisting of thousands of components. Semiconductor manufacturing starts with thin discs, called wafers, made of silicon or gallium arsenide. A large number of usually identical chips can be produced on each wafer by fabricating the electronic circuits layer by layer in a wafer fabrication facility [2]. Wafer fab consists of hundreds of
machines ([44]) and a sophisticated automated material handling system (AMHS) ([45]). Lots are the moving entities within wafer fab. The routes of the lots contain several thousands of processing steps. Consequently, the cycle time of the lots is between four and six weeks. Wafer fabrication is widely considered to be amongst the most difficult of all manufacturing environments ([46]).
2.6 System theory point of view on discrete event logistics systems
In order to get a unified framework for DELS, system theory point of view is used. According to Grochla [48], an enterprise can be decomposed into the following subsystems:
- Base system - Operative system
- Control and monitoring system
Susbsystem
Description
Base system
Responsible for transferring
commodities into products in course of
rendering goods and services.
Represents the resources and also the
working objects
Operative system
Immediate planning, control, and
monitoring of the base system
Control and Monitoring System Calculation of control instructions to
connect the operative system with the
planning system. Because of the longer
horizons in the planning system,
aggregation and disaggregation
functionality is provided by the control
and monitoring system
Planning system
Calculation of plans that are used to
fulfil the goals of the enterprise taking
information from the environment and
the remaining subsystems into account
Table 1
- Planning system
The functionality provided by the different subsystems is sketched in Table 1. The obtained decomposition of a single enterprise is shown in Figure 2. It is possible to associate each of the subsystems to a specific process in manufacturing related context. The base process for example corresponds to the operations and transformation process of raw material into final goods. The planning system supports strategic planning and parts of the management control, while the
control and monitoring system supports management control and also parts of the operational control. The operative system finally supports the operational control that is closely related with base system and base process related decisions. However it is not possible to separate these subsystems on the course of one operation or activity. Manufacturing systems could have two or more of them in one unit or subsystem.
Note that DELS is a network of nodes that each is an enterprise and can be decomposed into subsystems. In this situation the different subsystems that correspond to different nodes of the network are typically distributed.
2.7 Modeling for Discrete event logistics system
Taking a simulation point of view, the term modeling refers mainly to modeling the base system and operative system and to a lesser degree, to modeling the planning system and the control and monitoring system [2]. But it is not always possible to model all these subsystems at the same level of detail. For example job release times or rates are usually assumed as given when their impact on cycle time is investigated by simulation modeling. Of course, job releases are a result of a decision made by the planning system. Thus, in this case, the planning system is not modeled in detail, but is represented by a relatively crude approximation [2]. It is the same summarization when dispatching rules are chosen from predefined options in simulation blocks. These rules like FIFO could be much more complex that needs to be modeled separately.
Since DELS is a network of nodes, it could be modeled by different degree of abstraction and integration. The simulation model could depict a subsystem of a node, a vertical integration of
subsystems of a node or a horizontal integration of more than one node. However more integration means more complexity. Having planning and operational subsystems in a model is a horizontal integration and depiction of distribution, warehouse and production in a model is an example of vertical integration. A model can also have detailed planning and operational subsystems of warehouse and production nodes together which makes it high complex.
There are approaches in the literature that address the modeling of supply chain networks. Two widely used approaches are System Dynamics (SD) and Discrete Event Simulation (DES) that are described in next section.
2.8 System dynamics modeling
System Dynamics is a computer-aided approach, initially called “Industrial Dynamics” (Forrester 1961) developed from the work of Jay W. Forrester at the Massachusetts Institute of Technology. Forrester (1961) defines Industrial Dynamics as”…the study of the information feedback characteristics of industrial activity to show how organizational structure, amplification (in policies), and time delays (in decision and actions) interact to influence the success of the enterprise. It treats the interactions between the flows of information, money, orders, materials, personnel, and capital equipment in a company, an industry, or a national economy”[47].
The application of System Dynamics Modeling to Supply Chain management has initiated by Industrial Dynamics Model of Forrester (1961). ‘Forrester Model’ is a production-distribution system described in terms of 6 interacting flow systems, namely the flows of information, materials, orders, money, manpower, and capital equipment [47].
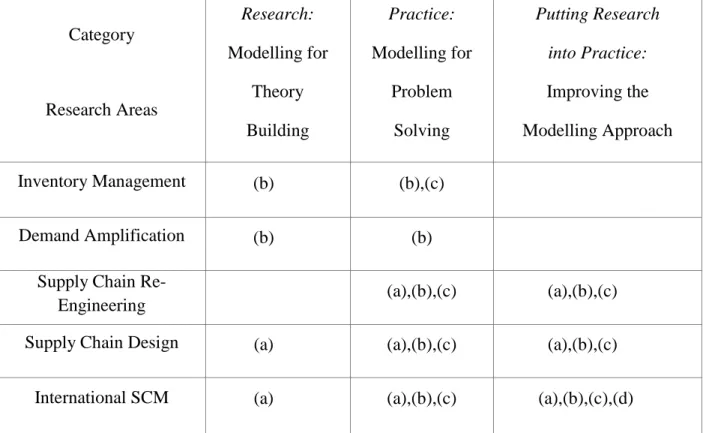
Figure 4 shows the Forrester Classic Supply chain model that was used in his simulation experiments. “There is a downstream flow of material from the factory via the factory warehouse, the distributor and the retailer to the customer. Orders (information flow) flow upstream, and there is a delay associated with each echelon in the chain, representing, for instance, the production lead time or delays for administrative tasks such as order processing [47]”. This Model was developed and improved over the years and applied to issues evolving around supply chain management. In the other word, SD is a well-established method with already defined models for supply chain issues like Inventory Management and Demand amplification (Table 2).
Table 2. A Taxonomy of Research and Development on System Dynamics Modeling in Supply
Chain Management [47] Category Research Areas Research: Modelling for Theory Building Practice: Modelling for Problem Solving Putting Research into Practice: Improving the Modelling Approach Inventory Management (b) (b),(c) Demand Amplification (b) (b)
Supply Chain
Re-Engineering (a),(b),(c) (a),(b),(c)
Supply Chain Design (a) (a),(b),(c) (a),(b),(c)
International SCM (a) (a),(b),(c) (a),(b),(c),(d)
Key to Table 2: Techniques and Methods applied (a) Causal Loop Diagramming
(b) Continuous simulation (c) OR techniques
(d) Discrete simulation
According to B. J. Angerhofer and M. C. Angelides in their research review [47], System Dynamics Modeling has mainly three techniques that are used for problem solving in Supply Chain Management area: (a) Causal Loop Diagramming, (b) Continuous simulation and (c) OR techniques.
2.8.1 Causal Loop Diagramming
Causal loop diagramming (CLD) is a fundamental tool used in system dynamics. It is the causal loop diagram’s unique ability to identify and visually display sophisticated processes and root causes. Every system behaves in a particular manner due to the influences on it. Some of these influences can be modified, some cannot, and some can diminished. Causal loop diagrams bring out the systematic feedback in processes by showing how variable X affects variable Y and, in turn, how variable Y affects variable Z through a chain of causes and effects. By looking at all the interactions of the variables, the behavior of the entire system is recognized. With a CLD, a practitioner no longer needs to focus only on one interaction between two variables, but can focus on the whole system, along with its many variables and its many causes and effects [57].
CLDs consist of arrows connecting variables that show how one variable affects and impacts another variable. Additionally, each arrow in a CLD is labeled with a minus or plus sign. The minus sign denotes that the first variable causes a change in the opposite direction in the second variable. A plus sign is used to signify that a change in one variable causes the second variable to change in the same direction (Figure 5) [57].
In causal loop diagrams, the arrows come together to make loops, and each loop is labeled with an R or B. R means reinforcing (i.e., the causal relationships within the loop create exponential growth or collapse). For instance, the more a person drives their car, the more gas they use and as they consume more gas, they spend more money to buy the gas and so on, in a vicious,
upward spiral. B means balancing (i.e., the causal influences in the loop keep things in equilibrium, or in balance. For example, as a person spends more money on gas, they begin to find more and probably cheaper alternative methods of transportation (walk, take the bus, etc.) and as they do this, they spend less money on gas [57]. Figure 5 shows a CLD describing the impact of different factors on an organization that suffers from lack of productivity.
2.8.2 Continuous Simulation
Continuous modeling is the mathematical practice of applying a model to continuous data (data which has a potentially infinite number, and divisibility, of attributes). These models have often mathematical equations which fit the problem assumptions. In simulation of continuous models, time advances in equal steps and model equations and values are recalculated at each time step. Many LSCM parameters with continuous data like inventory, demand, cost, etc. could be modeled using continuous simulation modeling.
Depending on the problem, different software and toolboxes have been developed. Simple problem could be modeled even with Microsoft excel. Middle class issues could be modeled with simulation toolbox of Matlab. However there is plenty of simulation software that can solve complex continuous models. These packages usually have predefined blocks for arithmetic operations and statistical distributions.
2.8.3 OR Techniques
Operations Research (OR) is a discipline that deals with the application of advanced analytical methods to help make better decisions. Employing quantitative techniques such as Linear Programming, Game Theory, Integer Programming, Nonlinear Programming, etc. , OR arrives at optimal or near-optimal solutions to complex decision-making problems. In supply chain management context, OR is often concerned with determining the maximum (of profit, performance, or yield) or minimum (of loss, risk, or cost) of some enterprises. Barely some of LSCM strategic issues like supplier selection are modeled by the use of other techniques like Game Theory.
Like continuous simulation there is a plenty of software packages with predefined functions that are used to model OR problems. Some of them like Excel and Matlab are applicable in continuous simulation also. Nevertheless Lingo, Lindo and SAS are among the OR special packages.
For a class of simulation modeling called discrete-event, system models are depicted at an abstraction level where the time base is continuous, but during a delimited time-span, only a finite number of relevant events take place. These events can cause the state of the system to change. In between events, the state of the system is fixed. This is unlike continuous models in which the state of the system may alter continuously over time [49].
The simple example system shown in Figure 6 will be used to illustrate above-mentioned concepts. At the physical level, the system consists of a cashier serving arriving customers, one at a time. Customers stay in a queue if the cashier is not available (serving another customer). Here, the state of the system composed of the states of the queue and the cashier. The queuing discipline is First in First out (FIFO) and individual customers are assumed not to have any distinguishing features (such as age, or number of items bought). Thus, it is meaningful to model the state of the queue by means of the queue length, a natural number. The cashier can be in either the Idle or the busy state. The dynamics of the system is determined by:
- the arrival pattern of customers characterized by their Inter Arrival Time (IAT) distribution,
- the time required by the cashier to serve a customer characterized by the Service Time (ST) distribution,
- the logical sequence of customers proceeding through the system under different conditions (queue empty/not empty, cashier Busy/Idle).
Discrete-event modeling is clearly at a high level of abstraction. This abstraction is often appropriate for realistic representation of a system's behavior. In addition, as in between events, the state of the system does not change, a discrete-event simulator need not explicitly represent the state of the system at non-event times. This allows for highly efficient simulation comparing to continuous simulation, where principally; state information must be shown at each point in continuous time-span [49].
Figure 7. Different discrete formalism [50]
Based on different time flow mechanism and system state changing algorithms, several discrete formalisms have been developed. Figure 7 gives an overview of the relationships between different” discrete formalisms. On the left hand side, formalisms are shown whose time flow mechanism is a fixed time advance. On the right hand side, formalisms with a discrete event time flow (clock advances to event times only) are shown [50]”. Exploring the all formalisms and their modeling algorithm is beyond the scope of this research. Interested readers are referred to Hans Vangheluwe (2001) [50].
2.10 SD and DES: Comparison and use
Discrete event simulation (DES) and system dynamics (SD) are two modeling approaches widely used as decision support tools in logistics and supply chain management (LSCM). Simulation models, in both DES and SD, are usually built to understand how systems behave over time and to compare their performance under different circumstances [54]. Some technical differences exist between the two modeling approaches related to their underlying principles. For example, DES models systems as a network of queues and activities where state changes occur at discrete points of time, whereas SD models represent a system as a set of stocks and flows where the state changes occur continuously over time [55]. In DES entities (objects, people) are represented individually. Specific attributes are assigned to each entity, which determine what happens to them during the simulation. On the other hand, in SD individual entities are not specifically modeled, but instead they are represented as a continuous quantity in a stock. DES models are generally stochastic in nature, where randomness is represented by the use of statistical distributions. SD models are generally deterministic and variables usually represent average values. In DES state changes occur at irregular discrete time steps, while in SD state changes are continuous, approximated by small discrete steps of equal length. [1]
DES and SD have both been used to model a wide range of LSCM issues. “Evidently, DES and SD are capable of modeling the complexity and uncertainty inherent in LSCM environment. They are powerful techniques that can be integrated in LSCM to undertake “what if” analysis with a wide range of scenarios [1]”. According to A. A. Tako et al. [1] DES is used more frequently than SD for supply chain modeling and the use of DES in LSCM context is growing at a faster rate.
There is a general belief that SD modeling is more suitable for modeling at a strategic level and DES at an operational/tactical level. However, based on the literature review done by A. A. Tako et al. on the journal papers identified in the period (1996–2006); “in terms of application of DES and SD to support decisions at a strategic or operational/tactical level, there is little evidence of any difference within LSCM context. It may be that SD, when it is used, is marginally used proportionately more often for strategic issues. Overall, DES and SD are used more frequently to model operational/tactical issues in LSCM context [1]”.
What appears is a limited separation in the use of DES and SD for LSCM. Findings from a recent empirical study on users' perceptions of DES and SD shows that “two approaches were
not perceived as significantly different; implying that from the user's point of view the type of simulation approach makes little, if any, difference as long as it is suitable for addressing the problem situation at hand [56]”.
3. Research approach
The aim of this study is to explore the use of DES and SD in LSCM of Swedish Manufacturing Industries (SMI), looking specifically into the nature and level of issues modeled. In order to achieve this, an analysis was done based on the frequency with which issues in LSCM are modeled using DES and SD. The study is based on a review of journal articles that describe the application of DES and SD to LSCM issues in SMI and addresses the following three research questions:
Whether DES or SD has been applied more?
What are the most frequently modeled LSCM issues?
How is the distribution of applications over tactical-strategically continuum?
The literature review undertaken follows four stages: identification of journal articles and simulation approach adopted, creation of a schema for classifying papers by LSCM issue, distinguishing between strategic and operational/tactical LSCM issues, and classifying papers by LSCM issues addressed. In performing this analysis, no judgment has been made about whether the most appropriate modeling approach was selected and simply observed which approach is used for which issue. Each of the stages followed to undertake this research is now described.
3.1 Identification of journal articles and simulation approach adopted
Journal and Conference papers that report simulation models for LSCM in SMI were selected based on a keyword search using the DIVA and Web of Science citation database. Relevant Master theses which used simulation models in LSCM context of SMI were selected based on a keyword search using the Uppsok database. The keywords used were ‘supply chain’, ‘simulation’, ‘discrete-event simulation’ and ‘system dynamics’. These were combined to include the first keyword (‘supply chain’) and one of the other keywords mentioned, connected by ‘and’. The search included journal articles, conference papers and Master Dissertations published during the 22 years period, between 1990 and 2012. After removing duplicates, the initial list produced resulted in 39 entries in both English and Swedish Languages. The search was limited to journal papers, Master dissertations and conference papers and no books were included. Given that the aim of this study is to explore the DES and SD modeling work in LSCM, other simulation approaches such as agent-based modeling and Monte Carlo simulation are not included.
A screening process was carried out to make sure that only papers actually using DES or SD modeling in LSCM were included. In some cases this was identified by reading the abstract, while in other cases this was only revealed in the main text of the paper. A full list of the 39 articles plus a short description of each is provided in Appendix 1.
The next stage was to devise a schema for classifying the papers into the LSCM issues that each paper addressed. Supply chain management is a vast subject, covering a wide variety of topics. Finding a comprehensive classification of the topics covered in the supply chain context is not easy.
In order to cover the breadth of LSCM issues, this study is based on a customized classification of LSCM issues developed by A.A.Tako and S.Robinson in their literature review of simulation modeling of supply chains [1]. Table 3 shows this 17-category classification. A more full explanation of each of these LSCM issues is provided in Appendix 2.
3.3 Distinguishing between strategic and operational/tactical LSCM issues
Having identified a set of LSCM issues representing decisions made within the supply chain, these were further classified into strategic, tactical and operational issues. Decisions in supply chains can be categorized into the three groups depending on the frequency with which a decision is made and the time frame during which it makes influence [1]. Referring to DELS system theory point of view, each decision corresponds to a subsystem. Strategic decisions normally deal with company-wide problems involving a time span of between 2 and 5 years.
LSCM Issue
Supply chain structure (SCS)
Process Redesign (PR)
Supplier Selection (SS)
Facilities/capacity planning (FCP)
Replenishment control policies (RCP)
Bullwhip effect (BE)
Information sharing (ISH)
Supply chain integration (SCI)
Supply chain optimization (SCP)
Cost reduction (CR)
System performance (SP)
Inventory planning/management (IPM)
Planning and forecasting demand (PFD)
Production planning and scheduling (PPS)
Distribution and transportation planning (DTP)
Dispatching rules (DR)
Reverse logistics (RL)
These consist of issues mainly deal with planning system such as supply chain configuration and resource allocation. Tactical decisions involve mid-term activities, that is, over a time period of one month to a year, and involve issues related to control/monitoring system and also parts of the operative system. Operational decisions normally involve short-term decisions related to day-to-day activities. These decisions reflect the problems related to operative system and base process. At the operational level the main problems pursued are lot sizes, replenishment orders, and service levels.
Attempting to classify a LSCM issue as being strategic, tactical or operational is not straight forward because it is not always possible to be exact about the nature of the decision. Given that DELS consists of four subsystems, in many cases a simulation modeling might be a vertical integration of these subsystems address overlapping decision levels. For the purposes of this review, the listed issues in Fig. 2 were ranked between the two extremes of strategic and operational/tactical. The devised ranking is shown on the left side of Figure 8. The ranking is largely based on A.A.Tako and S.Robinson 's ordering of the issues. Operational and tactical
ate gic Op er ation al/ T ac tic a l
Figure 8. LSCM Strategic/tactical Continuum [1]
LSCM Issue
Supply chain structure (SCS)
Process Redesign (PR)
Supplier Selection (SS)
Facilities/capacity planning (FCP)
Replenishment control policies (RCP)
Bullwhip effect (BE)
Information sharing (ISH)
Supply chain integration (SCI)
Supply chain optimization (SCP)
Cost reduction (CR)
System performance (SP)
Inventory planning/management (IPM)
Planning and forecasting demand (PFD)
Production planning and scheduling (PPS)
Distribution and transportation planning (DTP)
Dispatching rules (DR)
issues are not specifically separated, since it is difficult to distinguish between the two at the coarse level of an issue descriptor.
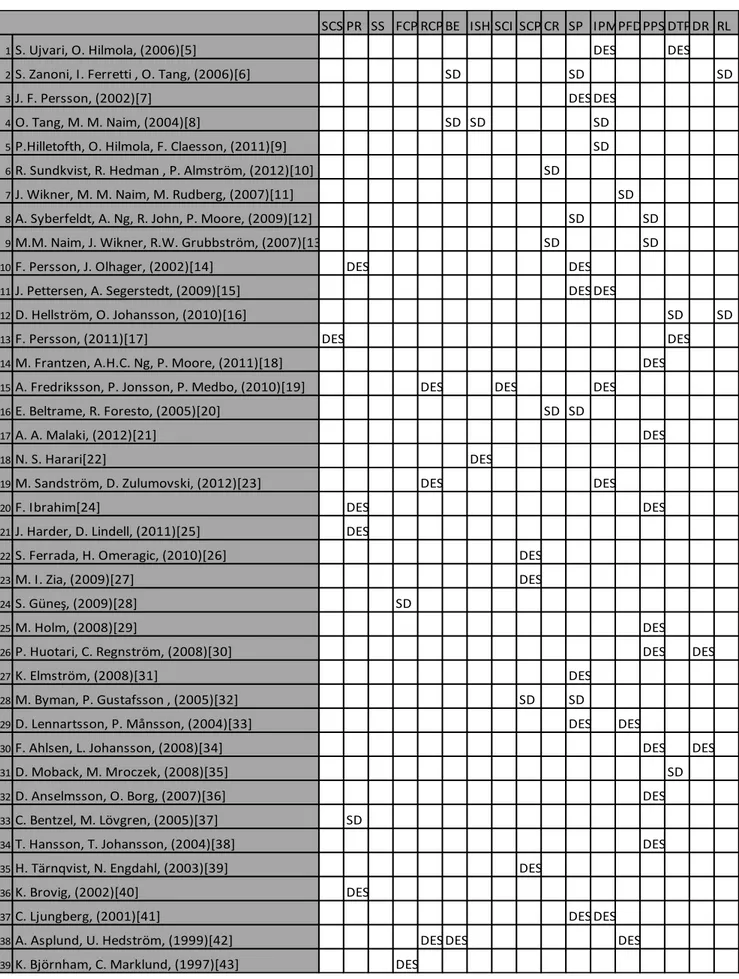
SCS PR SS FCP RCP BE ISH SCI SCP CR SP IPMPFDPPS DTPDR RL
1S. Ujvari, O. Hilmola, (2006)[5] DES DES
2S. Zanoni, I. Ferretti , O. Tang, (2006)[6] SD SD SD
3J. F. Persson, (2002)[7] DES DES
4O. Tang, M. M. Naim, (2004)[8] SD SD SD
5P.Hilletofth, O. Hilmola, F. Claesson, (2011)[9] SD
6R. Sundkvist, R. Hedman , P. Almström, (2012)[10] SD
7J. Wikner, M. M. Naim, M. Rudberg, (2007)[11] SD
8A. Syberfeldt, A. Ng, R. John, P. Moore, (2009)[12] SD SD
9M.M. Naim, J. Wikner, R.W. Grubbström, (2007)[13] SD SD
10F. Persson, J. Olhager, (2002)[14] DES DES
11J. Pettersen, A. Segerstedt, (2009)[15] DES DES
12D. Hellström, O. Johansson, (2010)[16] SD SD
13F. Persson, (2011)[17] DES DES
14M. Frantzen, A.H.C. Ng, P. Moore, (2011)[18] DES
15A. Fredriksson, P. Jonsson, P. Medbo, (2010)[19] DES DES DES
16E. Beltrame, R. Foresto, (2005)[20] SD SD
17A. A. Malaki, (2012)[21] DES
18N. S. Harari[22] DES
19M. Sandström, D. Zulumovski, (2012)[23] DES DES
20F. Ibrahim[24] DES DES
21J. Harder, D. Lindell, (2011)[25] DES
22S. Ferrada, H. Omeragic, (2010)[26] DES
23M. I. Zia, (2009)[27] DES
24S. Güneş, (2009)[28] SD
25M. Holm, (2008)[29] DES
26P. Huotari, C. Regnström, (2008)[30] DES DES
27K. Elmström, (2008)[31] DES
28M. Byman, P. Gustafsson , (2005)[32] SD SD
29D. Lennartsson, P. Månsson, (2004)[33] DES DES
30F. Ahlsen, L. Johansson, (2008)[34] DES DES
31D. Moback, M. Mroczek, (2008)[35] SD
32D. Anselmsson, O. Borg, (2007)[36] DES
33C. Bentzel, M. Lövgren, (2005)[37] SD
34T. Hansson, T. Johansson, (2004)[38] DES
35H. Tärnqvist, N. Engdahl, (2003)[39] DES
36K. Brovig, (2002)[40] DES
37C. Ljungberg, (2001)[41] DES DES
38A. Asplund, U. Hedström, (1999)[42] DES DES DES
39K. Björnham, C. Marklund, (1997)[43] DES
Eventually, the 39 articles that were selected were further screened, either by reading the abstract or the full text if it was required, with a view to identifying the LSCM issues modeled. In most cases the models described in the papers addressed more than one LSCM issue, resulting in the classification showing papers being associated with more than one issue. The full classification is provided in Table 4. The results from analyzing this classification are now presented.
4. Result
The classification of papers was analyzed in order to address the questions of whether DES or SD is used more to model different LSCM issues in SMI, and to determine whether modeled LSCM issues are focused more in operational/tactical or strategic issues. With respect to this, results are presented from three perspectives: the frequency of use of DES and SD in LSCM context of SMI, the frequency with which LSCM issues are addressed by the two simulation approaches, and the focus of LSCM issues on the strategic and operational/tactical levels. Results also shows a statistics of companies involved in these simulation applications.
4.1 The frequency of use of DES and SD in LSCM context of SMI
Out of the 39 papers, 26 (67%) used the DES approach and 13 (33%) the SD approach. DES modeling activity is more than double that of SD, suggesting that DES is the most frequently applied simulation approach in LSCM context of SMI.
Figure 9 shows a histogram based on used frequency of DES and SD in LSCM context of SMI. As it is shown, most of the issues have been addressed by both SD and DES approaches. Totally DES has been more commonly approach but there are a few issues that have been addressed only by SD.
However theoretically, there is no difference between SD and DES in terms of use in supply chain context and studies show that both of approaches have the potential and capacity for modeling of all LSCM issues [1].
4.2 Most frequently modeled LSCM issue
Through 39 identified papers, totally 63 LSCM issues have been addressed by two main modeling approaches, SD and DES. Figure 10 shows the histogram of addressed LSCM issues while modeled frequency is from interval of 0 and 10. As it is shown, not all issues got same attention. Figure 11 shows the list of LSCM issues sorted by modeled frequency.
Based on the numbers displayed in Figure 11, the most frequently addressed issues in LSCM can be identified. The issues most often modeled are system performance, production planning and scheduling and inventory planning/management. On the other hand, the issues like Supply Chain
Structure and Supply Chain Integration have been addressed only once. In addition, based on the result of this study review and within framework of this research, no addressed supplier selection issue has been found.
4.3 The focus of modeling efforts on strategic and operational/tactical levels
LSCM Issue
Frequency
System performance (SP)
10
Production planning and scheduling (PPS)
10
Inventory planning/management (IPM)
8
Process Redesign (PR)
5
Distribution and transportation planning (DTP)
4
Supply chain optimization (SCP)
4
Bullwhip effect (BE)
3
Cost reduction (CR)
3
Planning and forecasting demand (PFD)
3
Replenishment control policies (RCP)
3
Facilities/capacity planning (FCP)
2
Information sharing (ISH)
2
Dispatching rules (DR)
2
Reverse logistics (RL)
2
Supply chain structure (SCS)
1
Supply chain integration (SCI)
1
Supplier Selection (SS)
0
In order to identify the focus of modeling efforts in SMI and whether the bulk of applications are on operational/tactical side or strategic part; the cumulative percentage of modeled frequency for each issue was calculated along the ranked list of LSCM issues presented in Figure 12. The
Opera
ti
o
n
a
l/T
a
ct
ica
l
Stra
teg
ic
Figure 12. The Cumulative percentage of modeled LSCM issues
LSCM Issues
Comulative
Percentage
Reverse logistics (RL)
3%
Dispatching rules (DR)
6%
Distribution and transportation planning (DTP)
13%
Production planning and scheduling (PPS)
29%
Planning and forecasting demand (PFD)
33%
Inventory planning/management (IPM)
46%
System performance (SP)
62%
Cost reduction (CR)
67%
Supply chain optimization (SCP)
73%
Supply chain integration (SCI)
75%
Information sharing (ISH)
78%
Bullwhip effect (BE)
83%
Replenishment control policies (RCP)
87%
Facilities/capacity planning (FCP)
90%
Supplier Selection (SS)
90%
Process Redesign (PR)
98%
modeled frequency and cumulative histograms of LSCM issues are shown in Figure 13.
Figure 12 shows that the cumulative percentage of operational/tactical issues is 73% claimed that almost three/fourth of modeling efforts address the operational/tactical issues in SMI. Consequently those issues which are in the strategic side of LSCM continuum are modeled 27% of times which is relatively low. Notice that this result doesn’t have any dependency to undertaken approaches and only total number of address frequency for each issue has been considered.
Looking at frequency histogram, it has positive skewness suggesting that bulk of modeling efforts lies on the left side (operational/tactical) of the histogram and the tail is on the right (strategic) side.
4.4 Some companies involved
Figure 14. Frequency histogram of addressed LSCM issues
Strategic Operational/Tactical
A short list of some companies involved in these simulation modeling is shown in Table 5. This list can not exactly contain all the companies involved because some case studies have written for anonym companies and some applications are based on standard models.
Involved Companies
Alfa Laval
Arjo Hospital Equipment AB
Arla Foods Group
Ericsson Components AB
Fehrer Sweden AB
Getrag AB
Outokumpu
Saab Automobile AB
SCA Cellplast
SCA Packaging
Scania
Servera R&S AB
Tetra Pak Carton
Trelleborg Wheel Systems
Volvo Aero
Volvo Car Company
Volvo Powertrain
Volvo Truck
5. Analysis and Discussion
DES and SD have both been applied to a wide variety of LSCM issues in SMI. Based on the journal papers and master theses identified in the review period (1990-2012) DES is used more frequently than SD for supply chain modeling in SMI.
All LSCM issues within SMI have been addressed at least one time with the exception of Supplier Selection. LSCM issues such as System Performance and Production Planning have been modeled more frequently than others.
Issues related to system performance have been involved in 10 simulation studies. The performance of a supply chain involves a number of criteria, such as transportation cost, resources utilization, inventory level, order cycle time, delivery performance, etc. For example, F. Persson et al. (2002)[14] evaluated the alternative supply chain designs with respect to quality, lead-times and costs as the key performance parameters. J. Pettersen et al. (2009)[15] investigated the average amount of work in process(WIP) to compare different Kanban policies. A. Syberfeldt, et al. (2009)[12] used an optimization approach and increased the production cell utilization while decrease the number of overdue components. It seems that system performance has been addressed more frequently due to its application as an evaluation feature for different scenarios.
Production planning and scheduling (PPS) is among the most frequently addressed issues. Production planning and scheduling is a wide topic which deals with the management of manufacturing processes and the policies that determine the configuration of the production sequence and resource allocation, material handling, scheduling of machines and work centers. M.M. Naim, et al. (2007)[13] focused on parameter selection in the ordering policy of a production planning and control system under two different conditions; make to order and make to stock. M. Frantzen, et al. (2011)[18] presented an industrial application of simulation-based optimization(SBO) in the scheduling and real-time rescheduling of a complex machining line in an automotive manufacturer in Sweden. Generally Simulation models in this category are concerned with the effect of different production planning routines on supply chain performance. Inventory planning/management (IPM) addressed by 8 articles. IPM Deals with the movement of goods throughout the supply chain. IPM modeling helps decision making process in inventory management based on inventory levels, holding and backlog costs and replenishment control policies. A. Fredriksson et al. (2010)[19] assessed different outsourcing strategies and their effect on inventory level. J. F. Persson (2002)[7] calculated the inventory level to show the impact of a varying level of detail on simulation modeling. Studies on inventory planning and management usually focus on optimization of service levels or process time by varying the location or quantity of inventory.
Process Redesign (PR) is mostly discussed in simulation studies of theses. Supply chain redesign or re-engineering involves changes in its structure (facilities, production processes,
transportation) and processes. An emerging stream of work in this category explores the streamlining of physical transformation processes to simplify the decision-making and control to eradicate waste, such as: Total Quality Management, Just-in-Time, Kaizen etc. [1]. F. Persson et al. (2002)[14] evaluated alternative supply chain designs with respect to quality, lead-times and costs as the key performance parameters while the design alternatives differed in terms of the level of integration and synchronization between supply chain stages. Supply chain redesign is associated with strategic management as it requires an overall understanding of business processes.
In terms of supply chain optimization (SCP) that is mainly concerned with the identification and optimization of key performance indicators, such as profits, costs, product flows, etc., there are four articles; S. Ferrada et al. (2010)[26] tries in his dissertation to show minimization of the lead time and optimization of the buffer inventory via DES. M. I. Zia, (2009)[27] explores the use of multi-objective simulation optimization(MOSO) tool in maximization of throughput (TP) and minimization of cycle time (CT) and work in process (WIP). In his thesis, M. Byman et al. (2005)[32] deals with the load optimization in transport of mixed goods by containers and trailers. H. Tärnqvist et al. (2003)[39] works with a difficult one and tries to optimize the sequencing within production line.
Within distribution and transportation planning (DTP) issue that deals with the physical movement of inventory (products, materials), there are four articles. Some decisions made are: the design of the transportation network, choice of transportation models, the management of vehicle fleet (routing and scheduling), etc. For example S. Ujvari (2006) [5] tried to highlight the complex nature of automated guided vehicle (AGV) via modeling of Distribution and transportation planning. D. Hellström et al. (2010)[16] examined the impact of different control strategies on the management of returnable transport items (RTIs) in closed-loop supply chains. Replenishment control policies (RCP) is another important issue which have been addressed by a few articles. Related studies discussed about the control of stock levels in the echelons of the supply chain and the ordering policy. Their aim is mostly to have the right product quantity at the right location and at the right time. Generally RCP has been a part of those simulation studies which deal with Inventory management. For example, Jonsson et al. (2010)[19] and M. Sandström et al. (2012)[23] used replenishment control policies as a tool to minimize the inventory level. Totally, the choice of inventory replenishment policies aims to achieve low inventory while maintaining high delivery performance.
Regarding Bullwhip effect (BE) and phenomenon of upstream order magnification in the supply chain, three articles were found. Those articles explore the fluctuations in supply chain which results into a poor alignment between demand and production patterns across echelons. Since BE first theorization (e.g.Forrester 1961), the bullwhip effect has received much attention as it creates a business environment that can significantly add unnecessary costs [6]. Here S. Zanoni
et al. (2006) [6] and O. Tang et al. (2004) [8] studied the bullwhip effect by using SD techniques and A. Asplund et al. (1999)[42] with the help of DES.
Cost reduction (CR) is often the incentive of various policies undertaken such as Bullwhip effect elimination, inventory management, Demand Forecasting, etc. The following are the articles in which the cost reduction was the main evaluation tool in taking correspondent policy! R. Sundkvist, R. Hedman , P. Almström, (2012)[10], M.M. Naim, J. Wikner, R.W. Grubbström, (2007)[13], E. Beltrame, R. Foresto, (2005)[20].
Planning and forecasting demand (PFD) has been involved in three articles including J. Wikner, M. M. Naim, M. Rudberg, (2007)[11], D. Lennartsson, P. Månsson, (2004)[33] and A. Asplund, U. Hedström, (1999)[42]. These models generate forecasts of the expected future demand and investigate the impact of major demand changes on supply chain echelons.
Facilities/capacity planning (FCP) are related to typical decisions about determination of the facility role and processes to be performed, facility location and capacity allocation, etc. As S. Güneş, (2009)[28] and K. Björnham, C. Marklund, (1997)[43] showed in their modeling studies, FCP decisions are usually linked with the objectives and long term mission of the firms or partners in the chain and hence considered a strategic issue.
Information sharing (ISH) strategies are introduced as a sub-set of supply chain integration mechanisms, which aim to reduce the bullwhip effect and to improve the supply chain performance. Some of the obstacles encountered in operationalizing these strategies are the reluctance of firms to share information on sales, demand, production and delivery, inventory levels, etc. This issue was a part of modeling studies in O. Tang, M. M. Naim, (2004)[8] and N. S. Harari[22].
Dispatching rules (DR) deal with decisions made regarding the satisfaction of specific customer orders, considering on one-hand delivery dates and on the other hand deployment of the manufactures' shop floor [1]. DR has been involved in simulation modeling of P. Huotari, C. Regnström, (2008)[30] and F. Ahlsen, L. Johansson, (2008)[34].
Reverse logistics (RL) is concerned with the recovery of products as spare parts or recycled products at the end of their life cycle. Product recovery is driven by economical and environmental motives, which at the same time affects companies' manufacturing and gathering activities [1]. S. Zanoni et al.(2006)[6] and D. Hellström et al. (2010)[16] tried in their modeling studies to visualize the whole or a part of RL process.
Supply chain structure (SCS) represents the configuration of the chain, the sequential links between different activities or processes. Typical decisions made are related to the flow of materials between stages, involvement or not of intermediaries, pull versus push configurations, etc [1]. F. Persson, (2011)[17] dealt with designing the supply chain structure.
Supply chain integration (SCI) enables the cooperation of two or more systems in chase of complementary goals. This category consisted of a number of coordination mechanisms such as: vendor managed inventory, quantity discounts, quantity flexibility, allocation rules, quick response, strategic partnerships, etc. [1]. The work of A. Fredriksson et al. (2010)[19] falls in this category.
The findings about the focus of applications shows that modeling efforts within LSCM context of SMI mostly concerned about the operational/tactical issues and LSCM strategic issues have relatively got less attention. In the other word, the bulk of applications lie on the operational/tactical side of LSCM continuum. However, it is difficult to distinguish between the operational/tactical and strategic issues at the coarse level of one issue descriptor and hence the validity of concluded result is relatively.
About companies involved in simulation studies, the list at least shows that irrespective of size and branch, a wide range of companies in SMI use simulation modeling to solve issues arised in LSCM. This fact becomes more obvious when only four of these companies are among the 20 largest Sweden-registered companies.
6. Summary and Conclusions
The findings of this study, first of all sheds light on simulation modeling efforts of LSCM issues in SMI, secondly, brings useful insights about classification of LSCM issues from simulation point of view and thirdly informs the existing literature, industries involved and newcomers to this field about the use of DES and SD in LSCM of SMI.
Simulation modeling, which mimics the real-world experiment, can be seen as virtual experimentation. SD and DES are two widely used simulation approaches that help Swedish manufacturing industries to cope with innovation challenges in entire supply chain by bridging the gap between excellent ideas and successful implementation. This research explores the use of DES and SD as modeling tools in supply chain context of SMI. It is done with respect to the nature and level of problems considered. Journal articles and master theses published between 1990 and 2012 that describe the application of DES and SD in LSCM issues of SMI were reviewed. The analysis undertaken answered the three questions initially posed.
The first question asked whether DES and SD are used to model different LSCM issues in SMI. The findings show that both simulation approaches have been used to model the majority of LSCM issues identified, albeit to differing extents. It was established that the DES approach has been used more frequently compared to SD.
The second question asked whether modeling efforts in SMI addressed different LSCM issues evenly. The results show that issues such as system performance, production planning and scheduling and inventory planning/management have been modeled more frequently, and issues like Supply Chain Structure, Supply Chain Integration and Supplier Selection have been addressed less.
The last question asked whether the modeling studies addressed mostly tactical/operational issues or strategic issues. The histogram of modeling frequency categorized by LSCM issues (Figure 14) shows that modeling efforts are distributed over the entire LSCM continuum whereas the bulk of addressed issues lie on the operational/tactical side. It was recognized that around 73% of LSCM modeling studies in SMI fall into tactical/operational category while relatively 23% of them concerned about Strategic issues.
Furthermore, the result shows that irrespective of size and branch, a wide range of companies in SMI use simulation modeling to solve issues arised in LSCM.
The findings of this study are defined by the sample of journals and theses chosen, but also the approach and the setting in which the study has been undertaken. For example, the literature review is based on theses and journal papers published in the internet. It would be difficult to gather hard copy Journal articles because they are not always easily available. Furthermore, the study has not considered the success of the models in addressing LSCM issues, i.e. did the
![Figure 2. Decomposition of an enterprise into subsystems [2]](https://thumb-eu.123doks.com/thumbv2/5dokorg/4436618.107386/15.918.109.809.273.1009/figure-decomposition-enterprise-subsystems.webp)
![Figure 3. Subsystems/Submodels of a DELS model [2]](https://thumb-eu.123doks.com/thumbv2/5dokorg/4436618.107386/17.918.115.807.98.962/figure-subsystems-submodels-of-a-dels-model.webp)
![Figure 4. Forrester Classic Supply Chain Model [47]](https://thumb-eu.123doks.com/thumbv2/5dokorg/4436618.107386/19.918.167.771.209.1047/figure-forrester-classic-supply-chain-model.webp)
![Figure 5. An example of Causal loop diagramming (CLD) [57]](https://thumb-eu.123doks.com/thumbv2/5dokorg/4436618.107386/22.918.164.771.129.801/figure-example-causal-loop-diagramming-cld.webp)
![Figure 6. A simple system [49]](https://thumb-eu.123doks.com/thumbv2/5dokorg/4436618.107386/24.918.115.805.257.694/figure-a-simple-system.webp)
![Figure 7. Different discrete formalism [50]](https://thumb-eu.123doks.com/thumbv2/5dokorg/4436618.107386/25.918.111.806.257.997/figure-different-discrete-formalism.webp)
![Table 3. Classification of LSCM Issues [1]](https://thumb-eu.123doks.com/thumbv2/5dokorg/4436618.107386/29.918.262.722.215.777/table-classification-of-lscm-issues.webp)
![Figure 8. LSCM Strategic/tactical Continuum [1]](https://thumb-eu.123doks.com/thumbv2/5dokorg/4436618.107386/30.918.235.755.70.659/figure-lscm-strategic-tactical-continuum.webp)