School of Innovation, Design and Engineering
Supporting Strategic Decisions for
Operational Changes through the use of
Discrete Event Simulation
A Case Study in Production Scheduling at AstraZeneca
Master thesis work
30 credits, Advanced level
Product and Process Development Production and Logistics
Ali Ansari
Emanuel Freiberg
2017
Tutor (company): Thomas Bertilsson Tutor (university): Erik Flores
In recent years, market competitiveness exerts more pressure on process industries to increase their number of products, reduce order sizes and shorten delivery lead time. This causes an expansion of order enquiries from customers, which leads to an insufficient use of scheduling and planning systems to meet these changes. This force process industries to adopt other tools, such as Discrete Event Simulation for supporting their strategic decisions to align with these operational changes.
The objective of this thesis is to understand how Discrete Event Simulation supports strategic decisions prior to the implementation of operational changes in process industries. Therefore, a case study in the pharmaceutical industry was conducted at AstraZeneca, Södertälje. Discrete Event Simulation was used as a tool to support the strategic decision of implementing the Product Wheel technique as an operational change. Simultaneously, a theoretical review was carried out to investigate types of strategic decisions which can be supported by Discrete Event Simulation use in process industries. Then, contributions and challenges of Discrete Event Simulation use for supporting strategic decisions for operational changes were clarified.
The empirical results indicate the importance of Discrete Event Simulation in supporting deliverability as a competitive priority to AstraZeneca, followed by flexibility and cost as second and third competitive priorities. The analysis also identified the contribution of Discrete Event Simulation in supporting long-term decisions in the company by providing analytical solutions in different scenarios, dynamic visualization and increased knowledge about the simulated operational change. Additionally, two main challenges in the use of Discrete Event Simulation for supporting strategic decision are identified. First, Discrete Event Simulation was not suitable for supporting all kinds of competitive priorities such as quality, environment and innovation. Second, the direction of the communication between the Discrete Event Simulation use and the strategic decisions differs.
A framework is developed to facilitate the use of Discrete Event Simulation for supporting strategic decisions prior to implementing the Product Wheel technique as an operational change. This framework provides a guideline to identify the range of contributions from Discrete Event Simulation use for supporting different types of competitive priorities prior to the implementation of the Product Wheel method. Generally, Discrete Event Simulation could be a useful tool for supporting deliverability, cost and flexibility by implementing the Product Wheel technique, while it has a limited capability when dealing with other strategic decisions such as quality, innovation and environment.
Keywords: Strategic Decisions, Operational Changes, Discrete Event Simulation, Product Wheel, Process Industry
We would like to express our gratitude to AstraZeneca in Södertälje for giving us the opportunity to develop this project. Special thanks to Thomas Bertilsson, our supervisor at AstraZeneca, who supported us in sharing knowledge, interesting discussions and solutions for the challenges that we faced along the way. We also want to say thank you to Samuel Caceres, who went deep into databases and helped us getting the right information, and all other members that were involved in this project at AstraZeneca.
Furthermore, we would like to express our special thanks to Erik Flores, our supervisor at the Mälardalen University, for all the guidance and constructive criticism which helped us enormously to increase the quality of our research.
Finally, a warm thanks to our families and friends who supported us the entire time so we could focus on this research.
Västerås, May 2017
1.1 BACKGROUND ... 1
1.2 PROBLEM FORMULATION ... 2
1.3 AIM AND RESEARCH QUESTIONS ... 3
1.4 PROJECT LIMITATIONS... 3 2 RESEARCH METHOD ... 4 2.1 RESEARCH PROCESS ... 4 2.1.1 Literature Review ... 4 2.1.2 Data Collection ... 5 2.1.3 Case Study ... 7 2.1.4 Simulation Model ... 8 2.1.5 Data Analysis ... 10 2.2 QUALITY OF RESEARCH ... 10 3 THEORETICAL FRAMEWORK ... 13 3.1 PROCESS INDUSTRY ... 13
3.1.1 Characteristics of Process Industries ... 13
3.1.2 Operational Changes in Process Industries ... 15
3.1.3 Product Wheel ... 17
3.1.4 Development Process of a Product Wheel ... 18
3.2 STRATEGIC DECISIONS ... 20
3.2.1 Decision Categories ... 21
3.2.2 Competitive Components and Priorities ... 23
3.2.3 Challenges of Strategic Decisions ... 24
3.3 DISCRETE EVENT SIMULATION ... 25
3.3.1 Discrete Event Simulation in the Process Industry ... 25
3.3.2 Advantages of using Discrete Event Simulation for Operational Changes ... 25
3.3.3 Disadvantages of using Discrete Event Simulation for Operational Changes ... 26
3.3.4 Discrete Event Simulation supporting Strategic Decisions ... 26
4 DISCRETE EVENT SIMULATION ... 28
4.1 STEP-1:FORMULATE THE PROBLEM ... 28
4.2 STEP-2:COLLECT INFORMATION/DATA AND CONSTRUCT CONCEPTUAL MODEL ... 28
4.3 STEP-3:IS THE CONCEPTUAL MODEL VALID? ... 29
4.4 STEP-4:PROGRAM THE MODEL ... 30
4.5 STEP-5:IS THE PROGRAMMED MODEL VALID? ... 31
4.6 STEP-6:DESIGN, CONDUCT AND ANALYSE EXPERIMENTS ... 32
4.7 STEP-7:DOCUMENT AND PRESENT THE DES RESULTS ... 33
5 EMPIRICAL FINDINGS ... 34
5.1 COMPANY INTRODUCTION ... 34
5.2 CURRENT STATE - PRACTICAL BACKGROUND AND PROBLEM ... 35
5.2.1 Supply Chain Management – Material Handling Process ... 35
5.2.2 Blister Packing Line ... 36
5.2.3 Production Scheduling and Planning ... 37
5.3 FUTURE STATE -IMPLEMENTATION OF THE PRODUCT WHEEL ... 38
5.4 CONDUCTED STRATEGIC DECISION TYPES ... 40
5.5 CHALLENGES OF DES USE TO SUPPORT STRATEGIC DECISIONS ... 42
6 ANALYSIS ... 44
6.1 TYPES OF STRATEGIC DECISIONS THAT CAN BE SUPPORTED BY DES ... 44
6.2 CONTRIBUTION OF DES TO SUPPORT STRATEGIC DECISIONS ... 47
6.3 CHALLENGES OF DES SUPPORTING STRATEGIC DECISIONS ... 49
6.4 FRAMEWORK FOR SUPPORTING STRATEGIC DECISIONS BY DES USE WHEN IMPLEMENTING A PW ... 50
7 CONCLUSIONS AND RECOMMENDATIONS ... 53
8 REFERENCES ... 55
9 APPENDICES ... 60
Figure 2-1: Research process diagram ... 4
Figure 2-2: A seven-step approach for conducting a successful simulation study (Law, 2009) .. 8
Figure 3-1: Complex product chain in process industries (Lager & Storm, 2013) ... 15
Figure 3-2: Performance pyramid (Judson, 1990) ... 16
Figure 3-3: Product wheel (King & King, 2013) ... 17
Figure 3-4: Illustration of the TSP problem (El-Gharably, et al., 2013) ... 18
Figure 3-5: Classification of strategic decisions ... 22
Figure 3-6: Classification of decisions (Manzini & Bindi, 2009) ... 23
Figure 4-1: Conceptual Model for the DES ... 28
Figure 4-2: Simulation Process- Phase-II ... 31
Figure 4-3: Structure of the Verification & Validation Process ... 32
Figure 5-1: AstraZeneca’s lean house ... 34
Figure 5-2: Supply Chain at AstraZeneca ... 36
Figure 5-3: Packing line for blister I ... 36
Figure 5-4: Packing line for blister II ... 37
Figure 6-1: Scope of research questions ... 44
Figure 6-2: Six dimensions of strategic decisions ... 44
Figure 6-3: Strategic decisions based on theory ... 45
Figure 6-4: Strategic decisions based on case study ... 45
Figure 6-5: Strategic decisions supported by DES ... 47
Figure 6-6: Location of DES in organization level ... 48
Figure 6-7: Framework for DES use to support strategic decisions prior PW implementations 52
List of Tables
Table 2-1: Data collection techniques ... 5Table 2-2: Document groups ... 6
Table 2-3: Case study tactics for four quality tests (Yin, 2009) ... 11
Table 3-1: Types of strategic decisions supported by DES from theoretical findings ... 27
Table 4-1: Collected Data ... 29
Table 4-2: Conducted Experiments and Scenarios ... 32
Table 5-1: Net weekly available time ... 40
Table 5-2: Types of strategic decisions supported by DES from empirical findings ... 41
Table 5-3: Source of DES use challenges when supporting strategic decisions ... 42
Table 6-1: Contribution factors of DES use to support decisions in process industries ... 48
Table 6-2: Source of challenges of using DES to support strategic decisions ... 49
Appendix 2: Layout packing line 17 ... 61
Appendix 3: Products input details ... 62
Appendix 4: Products changeover time matrix ... 63
Appendix 5: Working hours, Planned & Unplanned stops ... 64
Appendix 6: OEE chart for Blister 17 ... 65
Appendix 7: Calculate EOQ & Optimum Sequence ... 66
Appendix 8: ExtendSim output for Wheel W1 ... 67
Appendix 9: ExtendSim output for Wheel W2 ... 68
Appendix 10: ExtendSim output for Wheel W3 ... 69
Appendix 11: ExtendSim output for Wheel W4 ... 70
Appendix 12: ExtendSim output for Wheel W5 ... 71
Appendix 13: ExtendSim output for Wheel W6 ... 72
Appendix 14: MTO products during the 1st. 4 weeks cycle ... 73
Appendix 15: Packing Line Output ... 74
API Active Pharmaceutical Ingredients
DES Discrete Event Simulation
EOQ Economical Order Quantity
MTO Make-To-Order
MTS Make-To-Stock
OEE Overall Equipment Effectiveness
PIT Process Improvement Time
PW Product Wheel
RQ Research Question
SHE Safety, Health and Environment
SKU Stock Keeping Units
TSP Total Salesman Problem
1 INTRODUCTION
This section presents the background, problem definition and purpose of this thesis. Three research questions are formulated in relation to the background and problem. Finally, the scope of this thesis is defined, which sets the limitations of this research.
1.1 Background
The process industry faces a high level of uncertainty related to increased competition, continuous changes in customer demands, and shorter product lifecycles (Wilson & Ali, 2014). Consequently, the process industry is required to change and adapt current practices to meet future needs and achieve operational competitiveness (Benedetti et al., 2014). Past research indicates the importance of developing a strategic vision that guides the development of changes in the process industry. The strategy of a company reflects a combination of norms and values which is the base for creating a competitive advantage (Gatignon & Xuereb, 1997; Kandemir & Acur, 2012). This results in a company-specific strategic competence, which has an impact on strategic decisions that are made in the entire company and thus contribute to long-term company success (Hao & Song, 2016; Kandemir & Acur, 2012). To achieve this objective, prior studies have pointed out that a firm’s strategic decisions should be expressed in terms of quality, cost, deliverability and flexibility (Roth & Van, 1991), as well as innovation (Leong et al., 1990). The consideration of strategic decisions in the process industry is important because these decisions constitute an important element of company culture and thus provide a framework for a firm’s actions and goals (Gatignon & Xuereb, 1997). More importantly, research findings indicate that complying to a firm’s strategic decisions, when operational changes are implemented, leads to increased company productivity, reduced lead time and cost as well as improved quality (Martinez & Pérez, 2001).
In process industries, strategic decisions are important as they provide alternatives for the success of an organization which affect processes in the entire hierarchy of the company (Elbanna, 2006). According to Johnson, et al. (2008), strategic decisions are often initiated by top management and include every level of the organization including an organization’s operations which observe changes and requires high responsiveness to changes. An example for taking strategic decisions to guide operational changes in the process industry is given by Haapasalo, et al. (2006). These researchers connected company strategies to operational management by implementing a balanced scorecard on the operational level. With the help of this balanced scorecard the broad company strategy, vision and competitive priorities where converted into specific operational actions and measurements. However, this connection is more rarely seen than commonly used in the industry. Manzini & Bindi (2009) and Schmidt & Wilhelm (2000) have performed studies about the consequences of strategic designs of logistics systems in operational changes. According to them, the most significant issue when guiding a company’s strategy arises from the missing connection between strategic decisions and operational management where strategic designs of logistics systems do not support operational planning schedules and the consequential changes.
Discrete Event Simulation (DES) is a commonly used simulation tool for analyzing industrial processes for operational changes in different enterprises to provide a detailed vision on these changes in the production system (Albrecht et al., 2014; Jahangirian et al., 2010; Negahban & Smith, 2014). DES evaluates the changes in state variable when events occur at different points in time and analyzes a model numerically by computational procedures (Banks et al., 2010). 1
There is extensive research providing evidence on the use of DES to support decisions (Banks & Gibson, 1997; Ingemansson, et al., 2005) and the use of DES to study operational changes has been strongly suggested because changes can be studied without interrupting a real-life process and the impact of changes can be analyzed in relation to a specific outcome (Ingemansson, et al., 2005; Popovics, et al., 2016). In spite of the many benefits of DES, questions remain in relation to its use and contributions when supporting strategic decisions.
1.2 Problem Formulation
As seen above, global competitiveness forces the manufacturing organizations to consider operational change. However, empirical evidence suggests that when operational changes are made in practice, firms react quickly in today’s fast moving world by focusing on one or two components such as flexibility or deliverability, while ignoring the impact of the other competitive priority components such as cost, quality, and innovation which will have a negative effect on the company (Ward et al., 1998). This is problematic because prioritizing short term solutions over long term strategic goals reduces a company’s competitiveness in the market (Wisner & Fawcett, 1991). Thus, the long-term effects of these operational changes are often not considered because these decisions are made quickly to solve a problem rapidly (Rösiö & Bruch, 2014). Other reasons why short term over long term thinking is an issue for a company’s success are the limited evaluation of consequences, lack of structured approaches, strong dependence on economic objectives and guesswork (Chryssolouris, 2013). This issue has been reported to occur frequently in the context of the process industry in pharmaceutical companies where short term solutions are used instead of long term thinking in the decomposition of large-scale scheduling problems that involve a large number of products (Wu & Ierapetritou, 2003).
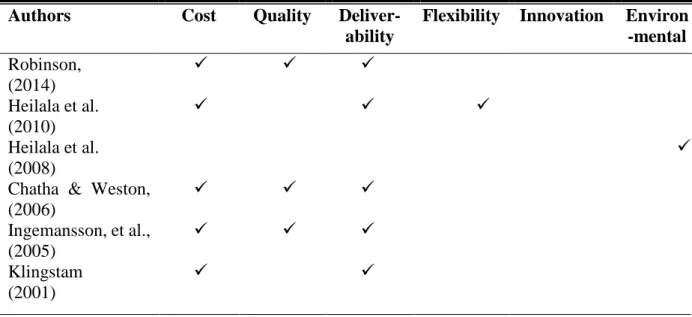
From a DES perspective, a number of open issues remain to provide support for strategic decisions in the process industry. DES studies have focused on operational changes that target every day concerns (Jahangirian et al., 2010; Negahban & Smith, 2014) like transportation routing problems where the scheduling of deliveries to different customers is simulated to minimize the total costs of transportation (ElGharably et al., 2013). However, a limited number of studies connect operational changes through DES showing how these changes are influenced by strategic decisions (Heilala et al., 2010; Chatha & Weston, 2006). This is problematic because there is insufficient understanding of the types of strategic decisions that DES can support when targeting operational changes, and because of the contributions of DES use it would lead to operational changes that consider strategic decisions which have not been analysed (Ren et al., 2006).
The above highlights the need to better understand the manner in which DES supports strategic decisions when operational changes are considered in the process industry. It is not only important to understand how DES is used, but also to ensure that the results of a DES model benefit long term strategic decisions and do not only focus on local optimizations (Heilala et al., 2010).
1.3 Aim and Research Questions
To address this problem, the aim of this thesis is to understand how DES supports strategic decisions prior to the implementation of operational changes in the process industry. In order to fulfil this objective, the following research questions (RQ) will be answered:
RQ 1: What type of strategic decisions can be supported by Discrete Event Simulation in the process industry prior to the implementation of operational changes?
RQ2: How can Discrete Event Simulation contribute to support strategic decisions prior to the implementation of operational changes in the process industry?
RQ 3: What are the challenges in the use of Discrete Event Simulation when supporting strategic decisions prior to the implementation of operational changes in the process industry?
1.4 Project Limitations
Three research areas are the focus of this thesis: strategic decisions, DES and operational changes. This thesis applies DES as a simulation tool to understand the impact of strategic decisions on the implementation of specific operational changes in the process. The software
Extendsim© version 9 was used to build all DES models. Furthermore, the topic of operational
changes will be narrowed down to the implementation of a Product Wheel (PW) technique. The PW is a modified Lean tool (Heijunka) designed to use in the process industry involving a continuous and regularly repeating sequence of production on a specific piece of equipment (King, 2009).
Due to time restrictions, this thesis focuses on a study conducted at AstraZeneca, a pharmaceutical industry in Södertälje as a single case study to represent the entire process industry. Selecting a single case study for this thesis creates other limitations for drawing generalizations in the study conclusions (Voss et al., 2002).
Another important constraint is that the case study will focus on only one specific line where blisters are packed. Furthermore, just this packing process is taken into consideration and not the previous production steps of the production. The entire data that is used in the case study is based on past records from the year 2016. All data was provided by AstraZeneca. Also, the case company verified and validated all data in this study.
2 RESEARCH METHOD
This chapter describes the research method. The research process is illustrated and the choice of a case study method explained. This is followed by a description of reviewed literature. The approach to the data collection and the data analysis in this research are explained. Hereafter, the chapter presents how quality of research is ensured.
2.1 Research Process
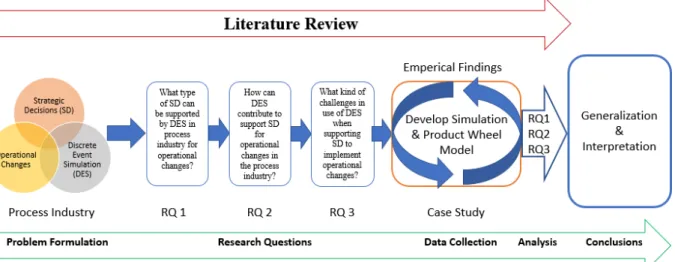
This thesis’ research process is described in Figure 2-1, starting from problem formulation by identifying the broad field of the desired area of investigation. It is followed by dividing the wide area into sub-areas to understand the relationship between them and address the gap in the body of knowledge, followed by raising three research questions. These questions help to define the research aim. By collecting data from the company’s historical records, interviews and observations, a model for the case study was developed. Simultaneously, relevant literature was reviewed, focusing on the field of supporting strategic decisions prior to the implementation of operational changes in process industries by using DES. A case study method was selected to collect data relevant to this thesis. Additionally, a DES model and a Product Wheel concept were developed. The DES model was verified and validated based on the available collected data. Then, empirical results were analyzed and compared with literature findings to provide answers to the research questions. Finally, a generalization and interpretation overview from the results of this specific case study was drawn.
Figure 2-1: Research process diagram
The following sections describe the research process steps in-depth. They also describe the technique used for collecting and analyzing data with the verification and validation process of this data.
2.1.1 Literature Review
The literature overview deals with three major topics: strategic decisions, DES and operational changes in process industry. The aim of the literature review for these three topics is determining the relationship between the research problem and the body of knowledge in this area, broadening the researchers’ knowledge, bringing clarity to the research problem, improving research 4
methodology and contextualizing the findings (Kothari, 2004). Literature has been reviewed on the topic of DES and narrowed down to understand the use of DES for supporting strategic decisions in a company. Furthermore, related literature about DES was introduced as a supporting tool for any operational change within the process industry. This required additional investigation to understand the background, strategies, and challenges in process industries such as pharmaceutical industries where the current case study has been conducted in.
The scientific papers which were used as references were drawn from scholarly databases. Literature was selected in two stages. First, the databases used for searching were: Google Scholar, Discovery, DiVA, IEEE Xplore, EBSCO Host, Emerald Insight, Research Gate and Scopus. Keywords were used in different combinations to form search phrases like “Strategic Decisions”, “DES”,” Process Industry”, “Product Wheel” and “Operational Changes”. The number of hits had been identified and the selected articles were determined based on keywords and hits. In order to find the right paper in a specific topic, a number of filters were used in searching. The filters used were “full text”, “articles” and “books”, also to ensure getting the updated database, and the timespan was limited between 1990- 2016. The papers had been selected through reading the abstracts and examining the suitability for the current study. In the second stage the snowball technique was used by searching for more references from the collected database and with delimitations of the publishing year or literature type. At the end, journal articles and books were used as well.
2.1.2 Data Collection
Data collection helps a researcher to draw inferences and conclusions for his study (Kothari, 2004). To understand how DES can support the strategic decisions and contribute to operational changes in process industries required a collection of data from different sources and using different techniques. The types of techniques used for data collection in this thesis include documents, interviews, observations, and regular meeting. Table 2-1 summarizes the collected data based on these techniques:
Table 2-1: Data collection techniques
Technique No. Duration Type of data collected
Documents Historical data of year 2016 related to blister-packing line 17. Documents are classified into four main groups: Production documents, Product documents Financial documents and General documents
Interviews 5 35 min Participant background, importance of this project for implementation of a PW, impact of DES on supporting strategic decisions prior to the implementation of operational changes. Observations Consensus Meetings 2 8 5 hours 2 hours
Observations conducted in two parts: First to understand the process flow starting from raw materials and finishing with the packing stage. Second to focus on the nominated packing line Blister 17.
Verify the collected data from different groups, project status, benchmarking presentation, progress, DES status and development, DES findings and discussions.
Data collection regarding documents including those related to blister packing line 17 was necessary to create and design the PW through the DES model. The company decided to first test the PW technique on one packing line and by using historical data of year 2016. The documents which have been collected for this case study can be divided into four groups: production documents, product documents, financial documents and general documents. The production documents are related to the machine parameters of blister packing line 17, while the product documents deal with the number and types of products which were packed during year 2016. Finally, the financial documents are related to financial records about each product and the packing line itself. Table 2-2 presents a description of the collected documents.
Table 2-2: Document groups
Group Description
Production Documents Machine Description Cycle time in each station Total available time per week Planned working hours per week Planned prevented maintenance Duration of maintenance Unplanned stops
Machine OEE Performance loss Quality loss
Working hours & shift information Product Documents Product information
Packing information Takt time for each product Annual production volume Annual demand variability Product mix
Change-over time for each product Number of defects per cycle Financial Documents Change-over cost per product
Unit material cost of each product Inventory carrying cost of each product
All the interviews were conducted during week 12 and 13 with different employees at different positions in AstraZeneca: An industrial engineer, production engineer, product line manager, maintenance engineer, lean coordinator and tactical planning advisor. Interviewees were selected on the basis of their knowledge in the process industry, which ranged from nine to 21 years of work experience. The interviewees were mainly involved in this project directly and were asked about operational changes, strategic decisions and DES. All the interviews were designed as semi-structured interview and were conducted after a discussion with MDH tutor as indicated in Appendix 1. The questions were developed to ensure that the purpose of the interview was aligned with the scope of the thesis objectives, while giving the interviewees flexibility to respond and present additional information. Interview questions were categorized to answer the three research questions. All the interviews were recorded and transcribed, then displayed into a note sheet for further analysis. The information from these interviews was used later in the 6
empirical findings as chain of evidence to have the triangulation between data collection, DES outcomes and literature review.
During the guided visit on the first day in the plant, observations regarding materials process flow were conducted. This visit was done in two parts. The first part was two hours long and the aim of that visit was to understand the process flow starting from raw materials and finishing with the packing stage. The second part was two hours long at the same day, and the aim was to understand the process of packing line Blister 17. During this visit observations were conducted from the line process screen, which provide different information about line working hours during the current week, shifts information, number of planned and unplanned stops during this period, and volume of the outcomes during that week.
During the thesis period, the authors conducted three meetings on-site with the production engineer, senior planning and scheduling manager, lean implementation manager and the company tutor. These meetings helped verify the required data from the different groups: production, planning and finance. Based on the discussions in those meetings, the company promised to submit all the required data of year 2016 on week 10, which served as a base for starting to build the PW and DES model. During these meetings the authors presented the status of the DES to the participants and discussed possible solutions for the not available data. The participants agreed on presenting them as assumptions in the conceptual model.
2.1.3 Case Study
The reasons for adopting a case study research are the following: first, the nature of the research questions and objectives (i.e. the use of “what?” and “how?” questions); second, the researchers have a limited possibility to control the events (Yin, 2009). Furthermore, a case study method was selected because of the limited knowledge about the contribution of DES as a tool to support strategic decisions prior to the implementation of operational changes in the process industry. The research combines data collection methods such as the use of historical sales records of 2016, interviews and observations (Eisenhardt, 1989) exclusively from one case in AstraZeneca in Södertälje. The importance of this case study lays in the fact that the method can be beneficial to other situations in the process industry and not only in the pharmaceutical industry.
This thesis employs a single case study, as opposed to a multiple case study, to represent a critical test to existing theory (Yin, 2009). The benefit of conducting this type of study is the greater opportunity for depth of observation (Voss & Frohlich, 2002). This research is considered as qualitative research, because the study was descriptive and flexible in all aspects of the research study (Kothari, 2004). The design of this case study is based on five process components (Yin, 2009): study questions “what and how”, study propositions by providing links between different phenomena, verifying study units of analysis (e.g. units must typically be comparable with the study questions), linking the data logically to the propositions and finally criteria of interpreting the findings.
Based on the description above, the current case study deals with operational changes in the process industry at a pharmaceutical company. Three questions have been conducted in the problem formulation which reflect the research objectives, followed by the related literature on this topic which has been gathered. Reviewing theory helps to understand the relationship between the research problem and the body of knowledge in this area (Kothari, 2004). In the study, propositions of the data collected through different sources have been connected to the
research questions. This connection between the study propositions and the study questions helps to provide more understanding on relevant evidence for case study objectives.
The unit of analysis are the competitive priorities in strategic decisions on the operational changes in the process industry. This unit of analysis has been verified through several conducted interviews and site observations as well as the information provided from DES. The collected data from both interviews and observations was compared with the literature review based on this unit of analysis. The outcomes from DES and PW models help to interpret the case study findings.
2.1.4 Simulation Model
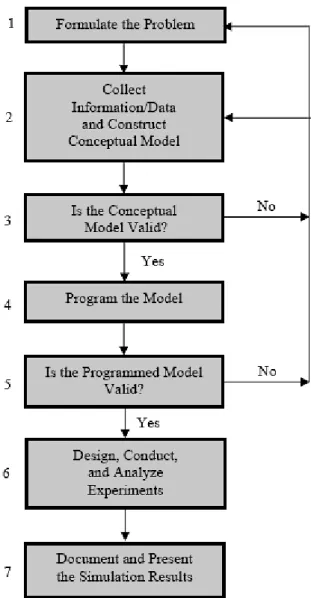
The simulation model was created based on the collected data through company historical document in 2016, meetings, and from the generated PW outcomes as discussed in section 2.1.2. The simulation process in this case study follows the seven steps approach which was clarified by Law (2009). Figure 2-2 describes this seven steps approach for conducting a successful simulation study (Law, 2009).
Figure 2-2: A seven-step approach for conducting a successful simulation study (Law, 2009)
Step-1: Formulate the problem
This is the first step in the simulation journey and it is the most important stage. The problem has to be stated by the policy-makers and shared with the others who are involved in this study through a number of consensus meetings (Law, 2009).
AstraZeneca stated the problem during the first meeting on the difficulties arising from the production planning process to get an optimal economical change-over sequence. Based on this stated problem, the case study objectives were formulated and included finding the inventory level and batch size of each product produced through blister packing line 17 based on a PW process and determining the Overall Equipment Effectiveness (OEE) number in blister packing line 17 after implementing the PW process.
Step-2: Collect information/ data and construct conceptual model
This step deals with two connected approaches: building the conceptual model and collecting data. The conceptual model should be developed to describe system components, define variables and constraints in a graphical way (Shannon, 1998). Therefore, it is better to start with a simple model and develop it to reach for more complexity along with the progress in data collection, because it can take a long time to collect these data (Banks et al., 2010). The process of data collection and the type of collection technique in this simulation project was described in section 2.1.2 previously, while Figure 4-1 in section 4.4.2 clarifies the conceptual model that was conducted for this simulation process.
Step-3: Is the conceptual model valid?
This step is considered as a gate or checkpoint in the simulation journey before moving forward to the following stages. The concept in this step is to validate the outcomes from the first two steps with all the people concerned in this project to ensure no errors in both the problem formulation and conceptual model based on the collected data have occurred (Law, 2009). In case of an error discovered during this validation process, there is a need to go back to the previous steps, fix the problems, and get approval to move forward in the following steps. A meeting with the production manager, the senior planning manager and the company tutor was held in AstraZeneca, to present the conceptual model concept and the additional required data for the simulation project.
Step-4: Program the model
Once both the problem formulation and the conceptual model are validated based on the collected data, it is the time to build a program for the conceptual model using one of the simulation software packages (Law, 2009). In this thesis, the authors decided to build the model by using the DES program Extendsim© version 9. The model was originally simple and increased in complexity until the project objectives and problem formulation were answered.
Step-5: Is the program model Valid?
This is considered as a second gate or checkpoint in the process. Once the model programing is complete it is required to check whether the components function properly and work as they were designed for (Shannon, 1998). This checking process is called verification. Additionally, validation also takes place. Validation refers to testing the simulation program outcomes by comparing the results with the real-world system and these outcomes should be close to the real- world system to a certain degree of confidence (Shannon, 1998).
The simulation of the PW was verified through several checks to ensure the best performance of the model blocks in terms of counting the number of wheels, wheel´s utilization, line’s utilization 9
percentage and inventory level for the main finished product. Afterwards the model was validated by comparing the simulation program outcomes for the inventory level and re-order point for those main products to the actual inventory level for the same products at the end of year 2016. The model was also validated by checking the outcomes of the overall OEE figure for blister packaging line 17 line with the actual numbers during the same period.
Step-6: Design, conduct and analyze experiments
Once the model was verified from errors and validated to have more accuracy, the experimental design process follows. This process is defined by Law (2009) as a tactical plan for the execution of different scenarios e.g. run length, number of simulation runs and analysis of the outcome to decide if additional experiments are required.
Multiple scenarios or tactical issues were conducted to decide the economical wheel sequence, OEE percentage and optimal inventory levels. The simulation was done in 10 runs and the indicated outcomes were discussed with the production and planning engineers.
Step-7: Document and present the simulation results
This is the final step in the simulation process. In this stage, the results are documented and presented to stakeholders. There are different way for the presentations such as animation, tables, charts, and pictures (Law, 2008). The simulation results for the PW model were documented using different types of tables and charts as indicated in Appendix 7.
2.1.5 Data Analysis
The data analysis was conducted based on the collected data from the case study, outcomes from both PW and DES models, along with reviewing literature within the existing research problem. The process of data analysis was performed as suggested by Miles & Huberman (1994) which includes data reduction, data categorization, and data display.
First the collected data from historical documents, interviews, consensus meeting, observations, and PW and DES outputs were filtered and reduced to serve the research problem and find answers to the study questions. Second, the categorization of the data into different types served for the research objectives of supporting strategic decisions to operational changes in the process industry. Information from DES supports the strategic decisions on the operational changes in process industries and challenges in DES to support the strategic decisions in the process industries. Third, data was displayed through using matrix format and excel spreadsheets from PW and DES models to facilitate the comparisons between empirical findings and similar themes in the literature review, which aid in drawing the final conclusions.
The outcomes from the PW and DES models were compared to AstraZeneca’s performance measure records in 2016. Afterwards two scenarios for the implementation of the operational changes in the planning and scheduling process were perform by introducing four wheel cycles on weekly bases and six wheel cycles on weekly bases also to present as a future state.
2.2 Quality of Research
As indicated in section 2.1.3 the quality of this case study research lays in earning credibility that the method can be beneficial to other situations in the process industry. This requires a method for testing research quality. To this end, four dimensions of research quality of construct validity,
internal validity, external validity, and reliability suggested by Yin (2009) were taken into account. Table 2-3, describes those four tests associated with the used tactics used in type.
Table 2-3: Case study tactics for four quality tests (Yin, 2009)
Tests Activities Phase of research
process Construct validity Use multiple source of evidence such as:
Interviews with distinct levels of employees in AstraZeneca.
On-site observations during the guide tour in AstraZeneca shop-floor.
Historical records for year 2016 relating to production, product, and financial records. Feedback from weekly meeting reviews.
Data collection
Internal validity Determine a pattern of triangulation between the multiple sources of the collected data.
Data analysis
External validity Compare the empirical observed pattern with the previous related study outcomes.
Research design
Reliability Generate several repeating steps for the empirical process to provide more generalization.
Perform a proper documentation process to provide transparency.
Data collection
Construct validity relates to the relationship between the concept and study objectives through establishing a chain of evidences from different sources (Yin, 2009). This thesis identified the unit of analysis and linked to the research objectives and questions a chain of evidence. The sources of evidences came from the conducted interviews within different levels of employees in AstraZeneca Sodertalje as indicated previously in section 2.1.4, from the authors’ site observation and from the historical documents of the year 2016. Through regular meetings between the authors and the MDH supervisor, a review of the gathered data was conducted to improve the research quality.
Internal validity concerns establishing a causal relationship to perform an optimal triangulation pattern between the collected evidences and trying to explain how to link these evidences with each other (Mathison, 1988). The conducted interviews with distinct key employees from AstraZeneca emphasized the collected historical data which are strengthened by the additional information collected by the author’s site observations.
External validity was conducted during data analysis and it deals with whether the study’s findings are generalizable based on comparing these empirical findings with the existing research
studies in a similar body of knowledge (Yin, 2009; Mathison, 1988). The considered outcomes of the operational changes within the planning and scheduling process in the company were analyzed to understand their impact on the company’s strategic decisions by comparing observation patterns were with previous study outcomes. Furthermore, a theoretical framework was developed to emphasize the connection of the research objectives with the empirical finding.
Since the research was conducted as a single case study, the constructed validity and internal validity were designed to test the research quality triangulate with previous studies in similar fields to provide a certain reliability that can be conducted in the same method for similar future studies (Yin, 2009).
The reliability of the thesis comes from describing every part of the research with transparency to create a full understanding of what and how things are executed through performing proper documentation and reporting the process (Yin, 2009). The collected data was documented as tables in excel spreadsheets for further implementations in DES. On the other hand, the interview questions were built to give credibility to the thesis by providing more transparency on finding answers to the thesis questions. The literature study was carried out through reviewing relevant literature to create a generalization by finding a connection between the literature outcomes with the thesis’ empirical findings. The developed PW- DES model has been described deeply in chapter 4 (empirical findings), where each step in that model was verified and validated by running the model several times and comparing its outcomes. That gives more reliability to the model and it can be used in similar cases for operational changes in terms of planning and scheduling in other process industries.
3 THEORETICAL FRAMEWORK
The purpose of this chapter is to describe the current understanding related to the research problem. The first section presents an overview of the process industry and describes the importance of changes in the operational level. Then, strategic decisions are defined and their competitive priorities described. The main challenges and contributions of strategic decisions are presented. Finally, DES theory, application of the DES in operational changes and the challenges in supporting strategic decision components are summarized.
3.1 Process Industry
The process industries are considered as a part of the manufacturing industry using raw materials to produce non-assembled products. Generally, the manufacturing process in the process industries is based on supplying raw materials to the production area where the operation steps are connected in a continuous flow and the material in the process takes place in the fluid form (Lager & Storm, 2013).
The process industries are mainly characterised by a continuous or batch mode process in mixing, separating, forming and/or chemical reactions of raw materials (Dennis & Meredith, 2000). In a continuous process, plants are producing a limited number of products with high volume and long campaign or batches. This requires that the production process be created through special purpose equipment allowing a continuous flow in up and down-stream with no defined start and end time (Kallrath, 2002). On the other hand, the batch mode considers a small quantity with a large number of stock keeping units (SKU) named campaign, which are produced through using multi-purpose equipment. The stream steps in batch mode are well defined from start-up to end time (Kallrath, 2002).
Process industry generally supplies products as mainly raw materials or ingredients, not components as in other manufacturing industries. Furthermore, in process industries, the continuous and batch production system are one of their characteristics to produce a large number of products using multi-purpose equipment, which are operated in batch modes (Kallrath, 2002). One more difference between the process industries and manufacturing industries is that the finished products or assembled products must align with a customer’s product platform in the manufacturing industries, while in the process industries finished products or ingredients must be compatible with the complementary materials in the customer’s production process (Lager & Storm, 2013). Based on the above definition and characteristics for the process industries, several industrial sectors have been considered as process industry such as: oil and gas industry, chemical industry, pharmaceuticals, food industry, steel industry, mining & metal industry, mineral & material industry, beverage industry, forest industry, and biotechnology (Storm et al., 2013). 3.1.1 Characteristics of Process Industries
Recently, most of the process industries such as pharmaceutical manufacturers are facing a quick need of improvement on the operational level to keep their performance within tight control (Benedetti et al., 2014). To begin with, it is required to understand the main characteristics that distinguish the process industries from other manufacturing industries. The following characters are recognised for the process industries which have impact on industrial engineering and operational changes and development:
• Volume, variety, and variability (3V’s): As mentioned above, one of the main characteristics of the process industries is the consideration of a continuous or batch system for the flow of the materials (Dennis & Meredith, 2000), and that translates in terms of high volume, low variety of products, or low volume with high variety of products at the other hand. Besides the volume and variety, process industries have to deal with the third V (Variability) (King et al., 2008). Nowadays and due to the competitiveness and the continuous changes in customer requirements, process industries need to consider the volume variability in customer demands.
• Capital intensive vs. labour intensive: In the process industry, capital productivity precedes labour productivity in importance. The regular tools that focus on reducing labour waste such as: the number of operators per stations, operator cycle time, and total operators working time per unit are important to identify the source of waste. However, other important parameters are still missing to determine the asset productivity such as: number of SKU’s in each production step and yield components of OEE. These tools play an enormous role in the process industries and need to be understood and tracked to get better productivity (King et al., 2008).
• Equipment throughput limitation: In process industries, equipment is the primary rate-limit factor opposite to the assemble parts industries where the labour is considered as the rate-limit factor (King et al., 2008). In many assembly lines, bottlenecks can be eliminated by increasing the number of operators or relocating them in a way that increases the productivity. This case is not applicable in the process industries, since the production rate is more effective on the equipment throughout than labour throughout. Process industries are very often running 24 hours 7 days a week. Therefore, process industries have no time to add additional shifts in case of variability in customer demands. Consequently, levelling production to meet with the customer demand is an important matter in the process industries to generate a smooth production flow (King et al., 2008).
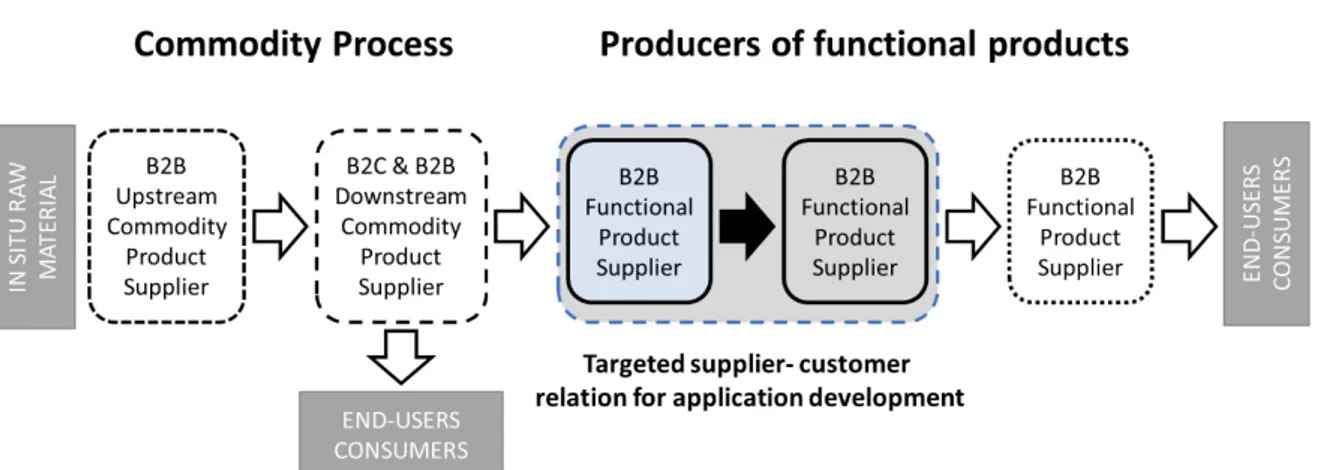
• Complex production chain: This is one of the significant characteristics of the product and process changes and innovation in process industries. The production chain in process industries starts with raw materials and may include other finished goods as intermediate stages before having the final products ready for the distribution to the customers. This process could include a large number of plants in different locations and is operated by different firms where plants are closely integrated in one chain production system (Tottie & Lager, 1995). Figure 3-1 describes the process of supply chain in the process industries from the raw materials to finished goods presented by Lager & Storm (2013). The process starts with the availability of the raw materials and finishes with consumer products of a commodity character or with a functional character. The complexity in the Supply Chain comes from the dimensions of the firm’s competitive situation in the market. In the upstream commodity producer, process industries are competing only on the price of its products (cost) and product quality (quality of raw material supplies). However, in the downstream the functional products’ competing characters are not only cost and quality, but other value added activities such as application development in innovation, flexibility, and deliverability (Lager & Storm, 2013).
Figure 3-1: Complex product chain in process industries (Lager & Storm, 2013)
• Equipment size and relocation process: Most of the equipment in the process industry is categorized as heavy equipment with a very long pipe network, integrated hydraulic systems and complex electrical wiring. That gives more difficulty in relocating machines positions for any operational change and improvement. However, the applied Lean Cellular Manufacturing system is still applicable within process industries (King et al., 2008). • Difficulty in stopping and restarting the processes: In the typical assembly line process,
machines are easy to stop and start-over. But this is not the same in the process industries. Most of the equipment in the process industries requires a long time and high cost for stopping and restarting. This limitation causes a problem to the production engineers and planners and results in overproduction, unnecessarily large inventories and effects on the application of other Lean tools such as JIT and the Pull replenishment process (King et al., 2008).
• Complexity in product changeover: The changeover process in the assemble line process create waste in both time and labour, while in the process industries besides those two waste factors there is materials waste due to a Clean-in-place process. This process includes cleaning all machine parts and the piping from the fluid, gas, syrup before starting with another flavour or brand. That also includes the additional laboratory tests that have to be done during any changeover process which add substantial waste in terms of time and cost. That leads to considering longer production cycles to reduce changeover waste (King et al., 2008). One good solution for managing the product assets with high changeover time and cost is using a scheduling and planning concept called Product Wheel which will be further explained in chapter 3.1.3.
3.1.2 Operational Changes in Process Industries
According to Shah (2005), most of the process industries are facing several challenges in terms of the interest of shifting from product oriented business into service oriented business and reduced product life-cycle time due to high competition. Besides, there is a trend towards mass product customisation through delivering customized products at commodity cost and developing sustainability. Environmental conditions for the product supply chain process are a new challenge facing the process industries based on Shah (2005). Buchholz, (2010) add two more challenges, the process industries are facing: resource efficiency or limited resources from rising demand and cost of different types of energy resources. The investment risk due to wrong decisions can increase the risk of failures.
The challenge is the consideration of strategic decisions that target operational changes in redesigning the supply chain network within the process industries (Shah, 2005). These strategic decisions include new facility location, changes in the existing facility (expansion, construction, planning and scheduling) and decisions that include the type of products that should be produced, production facility and markets to serve. One or more of these changes needs supported decisions from the top management (Skinner, 1969). Operational changes and development in the process industries require more than adding more resources or taking more investing risk. Operational development is related to considering all the competitive capabilities (cost, quality, deliverability, flexibility, and innovation) to solve technical problems, integrate different production facilities and have deeper fundamental process knowledge (Pisano, 1997). To meet this end, Judson (1990) introduced the performance pyramid as relationship diagram between the strategy and the operational changes in the company. As indicated in Figure 3-2, this pyramid links the strategic competitive priorities and operations to ensure an effective achievement of the company goals based on customer priorities. The performance pyramid assigns two directions, namely external and internal effectiveness. The external effectiveness depends on functional performance and competitiveness, while the internal effectiveness is conditioned by cost, production factors, activities, products and revenue (Jungman et al., 2004; Laitinen, 1996).
Figure 3-2: Performance pyramid (Judson, 1990)
The operative performance factors at the top of the pyramid are related to short- term changes using control and managing quality as guidance. At the same time, the long-term strategic performance has two roles: implementing and updating the strategic decisions by using customer satisfaction and market competitiveness as a guideline (Jungman et al., 2004). The flexibility factor is located in the middle of the performance pyramid, since it is required for various conditions. Palaniswami (1994) determines five conditions in which flexibility is requested: Product demands, manufacturing processes (like machine set-up time, productivity, etc.), planning and scheduling, human resources and relation with supplier and shortening delivery times.
3.1.3 Product Wheel
The PW, or also called Rhythm Wheel, is a modified Lean tool that is part of the production leveling called Heijunka. This lean tool is mostly used in the process industry where it creates a regularly repeating sequence of production on a specific piece of equipment in a continuous production process (King & King, 2013). The PW concept is based on combining all the products or SKU produced in a specific machine or production line and schedule them in a sequence to provide the best balancing between high changeover cost and high inventory costs (Wilson & Ali, 2014).
Questions that can be answered from the PW-concept include how long a production cycle should be or how much of each product should be produced in each cycle (King & King, 2013). A typical Product Wheel can run for 7 or 30 days to satisfy the product availabilities and fulfil customer demand. According to King & King (2013) changeover losses will be minimized, low-volume products will not be produced in every cycle and make-to-order and make-to-stock products can be included. Figure 3-3 shows a simple version of a final PW. The different products, here from A to K, are called spokes and indicate the sequence, by the order they have been placed, and the quantity, by the size of the spokes of the production. The gaps between the spokes display the change-overs and in the end of every PW a Process Improvement Time (PIT) is used as slack time for improvements and unplanned stop time (King & King, 2013).
Figure 3-3: Product wheel (King & King, 2013)
The PW is associated with a pull replenishment system to provide a good paradigm of Lean operation in process industries (King & King, 2013). It is a heuristic technique which requires experience and individual judgment to create an optimal design because it is not only a mathematical optimization (Wilson & Ali, 2014). The PW concept considers strategic decisions like production flexibility, resource configuration, uncertainty and product variety (Wilson & Platts, 2009). Moreover, the PW synchronizes the entire supply chain and not only single operations (Packowski & Francas, 2013).
Benefits of the PW according to King & King (2013) are a balanced production, optimized sequences, optimized campaign length, reduced inventory, improved delivery performances, a structure in production scheduling and a tool to support decisions. Packowski & Fitzer (2014) add an improved OEE to the benefits, which includes a reduced variability in the supply chain, an enhanced customer service level, local visibility for supply chain synchronization and a
reduction of the bullwhip effect. Overall, the PW has a positive effect on the entire production through reducing the inventory and increasing the flexibility which does not only lead to better response in delivery but also to improvements in the quality and reduction of costs like carrying cost (King & King, 2013).
One of the main challenges in the wheel’s design is the optimization of the sequence process in complex situations when there are high numbers of products passing through specific machines with different changeover times (King & King, 2013). One of the powerful approaches used to solve this problem is the total salesman problem approach TSP (El-Gharably, et al., 2013). It involves finding out the shortest route of N stores that a salesman can take to finish his tour with one pass to each store as indicated in Figure 3-4 TSP (El-Gharably, et al., 2013; King & King, 2013).
Figure 3-4: Illustration of the TSP problem (El-Gharably, et al., 2013)
3.1.4 Development Process of a Product Wheel
The PW is one of the most effective and reliable planning methods in process industries (King & King, 2013). The whole process to developing a PW is described by King & King (2013) in the following steps.
Step-1: Data Collection (Product & process)
This is the first step and it requires collecting information about the conducted process and products. There are many ways to preform it such as sales forecasts, production lot, Value Stream Mapping, interviews with production planning and supervisors and finally through direct observation of production runs (Wilson, 2014). The aim of this step is to investigate and decide which assets would benefit from the product wheel (King & King, 2013).
Step-2: Decide which asset benefits from applying a PW
Key parameters for the decision on which machine or assets should apply the PW are: changeover times, changeover losses and number of SKUs. Generally, PW applies to a specific equipment entire the production line. Often applied on the packing lines where scheduled as single integrated activity (King & King, 2013).
Step-3: Classify products between Make to Stock and Make to Order
It is required to analyse each product demand and demand variability in order to determine if a product should be classified as Make to Stock (MTS) or Make to Order (MTO) (Wilson, 2014). Therefore, products with very small volumes and with no stable demand can classify as MTO, and it does not make any sense to keep high stock of this product in the inventory. At the same time, products with high volume and clear repeatable demand should classify as MTS (King & King, 2013).
Step-4: Determine optimal sequence
Determining the optimal sequence means to cycle any product with a certain time to produce within the production line (King & King, 2013). The sequence distribution is based on different factors such as the length of change over time for different product families (Wilson, 2014). Having an appropriate sequence can be developed through different techniques, one of them is cellular manufacturing. This is a straightforward concept which starts by gathering all the products into specific groups of families with similar conditions or properties. This is followed by locating these family groups into a specific process equipment and creating a virtual work cell by identifying an acceptable flow pattern. The objective from applying the cellular technique is to reduce the number of products in each wheel and group them in families to reduce the changeover time and cost, which results in an efficient wheel design (King & King, 2013). Step-5: Calculate shortest wheel time
Deciding wheel time is an essential decision in the entire process, because dependent on that all other steps are taken. King & King (2013) identify five factors that should be considered when determining wheel time: Available changeover time, Economical order quantity EOQ, short-term demand variability, minimum lot size, and finally the shelf life of the product. As mentioned above, the changeover time factor is one of the important factors in calculating wheel time. This is also called the shortest wheel time. Then, the shortest wheel time needs to be calculated, based on the formula given in equations (1) and (2) (Wilson, 2014).
Wheel cycle per period = 𝑇𝑇𝑇𝑇𝑇𝑇𝑇𝑇𝑇𝑇 𝑇𝑇𝑎𝑎𝑇𝑇𝑎𝑎𝑇𝑇𝑇𝑇𝑎𝑎𝑇𝑇𝑎𝑎 𝑇𝑇𝑎𝑎𝑡𝑡𝑎𝑎−𝑇𝑇𝑇𝑇𝑇𝑇𝑇𝑇𝑇𝑇 𝑝𝑝𝑝𝑝𝑇𝑇𝑝𝑝𝑝𝑝𝑝𝑝𝑇𝑇𝑎𝑎𝑇𝑇𝑝𝑝 𝑇𝑇𝑎𝑎𝑡𝑡𝑎𝑎
∑𝐶𝐶ℎ𝑇𝑇𝑝𝑝𝑎𝑎𝑎𝑎𝑇𝑇𝑎𝑎𝑎𝑎𝑝𝑝 𝑇𝑇𝑎𝑎𝑡𝑡𝑎𝑎𝑡𝑡 𝑝𝑝𝑎𝑎𝑝𝑝 𝑝𝑝𝑐𝑐𝑝𝑝𝑇𝑇𝑎𝑎 (1)
Wheel Time = 𝑇𝑇𝑇𝑇𝑇𝑇𝑇𝑇𝑇𝑇 𝑇𝑇𝑎𝑎𝑇𝑇𝑎𝑎𝑇𝑇𝑇𝑇𝑎𝑎𝑇𝑇𝑎𝑎 𝑇𝑇𝑎𝑎𝑡𝑡𝑎𝑎−𝑇𝑇𝑇𝑇𝑇𝑇𝑇𝑇𝑇𝑇 𝑝𝑝𝑝𝑝𝑇𝑇𝑝𝑝𝑝𝑝𝑝𝑝𝑇𝑇𝑎𝑎𝑇𝑇𝑝𝑝 𝑇𝑇𝑎𝑎𝑡𝑡𝑎𝑎
∑𝐶𝐶ℎ𝑇𝑇𝑝𝑝𝑎𝑎𝑎𝑎𝑇𝑇𝑎𝑎𝑎𝑎𝑝𝑝 𝑇𝑇𝑎𝑎𝑡𝑡𝑎𝑎𝑡𝑡 𝑝𝑝𝑎𝑎𝑝𝑝 𝑝𝑝𝑐𝑐𝑝𝑝𝑇𝑇𝑎𝑎 (2)
Identifying the shortest wheel time is important as a guideline for business strategic decisions to know the possible shortest manufacturing lead time.
Step-6: Determine the economical wheel time
If minimizing production cost is the priority of business strategic policy in the company, then calculating the Economical Order Quantity (EOQ) must consider also (Wilson, 2014). The EOQ is the quantity of a specific product that balance between the high inventory costs generated from long wheel runs and the high changeover costs generated from short wheel runs (King & King, 2013). The EOQ defined by equation (3) (Wilson, 2014).
EOQ =
�
2∗𝐶𝐶𝐶𝐶𝐶𝐶∗𝐷𝐷𝑉𝑉∗𝑝𝑝
�
1/2(3)
COC = Changeover cost, D = Demand per time period, V = Unit cost of material, r = Percentage of carrying cost of inventory per time period.
The result number from equation (3) is a quantity unit. To convert it into time units the EOQ result needs to be divide with the specific product demand during the same period of time (D) to get the economical wheel time.
Step-7: Verity the EOQ
After defining both the shortest and the economical wheel time, it is required to set the production frequency to each product and number of items produced for each product. This quantity must be more or equal to the minimum batch size (King & King, 2013). Therefore, the benefit of this step is to check that the EOQ should be more than the minimum batch size limits otherwise one should return and re-calculate the next best EOQ which can fit this requirement.
Step-8: Balance the wheel
Having a balanced wheel is beneficial to keep the production consistent from cycle to cycle and allow the operation to develop in routine schedule. King & King (2013) identified four main benefits from balancing the wheel: Increasing the regularity level for the manufacturing operation, improve the PIT time by keeping this time approximately the same in each cycle, providing a uniform repeating buffer, so the wheel can be adjusted when MTO products required and providing a frequently repeating time that can be used for emergency and crisis events. The concept of balancing the wheel is to utilize the wheel time and keep it approximately similar in each cycle besides finding a pattern where similar products are made in same cycle to reduce the consumption in change over time (Wilson, 2014). The selection of the best arrangement alternative is defined as judgment- call. This judgment-call is more dependent on the experience and involvement of different levels in the production process such as: process engineers, operators, mechanics, and technicians (King & King, 2013).
Step-9: Design and draw the wheel
The benefit from drawing the wheel is to provide a powerful visualization tool to the decision- makers which is worth a thousand of words (King & King, 2013). The graphical representation for the wheel builds a good understanding of the production scheduling process and provide a decent communication tool between production staff. Normally the product wheel is presented in a Pie graph which each graph representing one wheel cycle. It consists of all the produced products within this cycle and their produced sequence (Wilson, 2014).
3.2 Strategic Decisions
The word strategy originates from the Greek and can be translated into the art of the leader. It was first used in the literature of European military in the beginning of the 18th century with the purpose to plan and direct overall army operations (Ackoff, 1990). Nowadays, the word strategy is regularly used in the industry as a plan of actions to accomplish an overall or long-term goal. Strategy is related to decisions because decision making is normally divided into three hierarchical levels independent from each other: strategic, tactical and operational. Operational decisions handle the actual implementation of tasks to achieve the overall aim, the tactical decisions give the framework to achieve the overall aim and strategic decisions determine the overall aim for the organization (Zapata, et al., 2008).
The main contribution of strategic decisions is the advantage of the long-term thinking compared to a short-term thinking (Miltenburg, 2005). The target for Miltenburg (2005) is to achieve competitive advantages to be successful by following the main strategies like low cost or 20
differentiation, which means providing better quality and service compared to the competitors. According to Wheelwright (1984) there are five general characteristics that are associated with strategies in the industry. One important characteristic of strategy is the long-term time horizon in which decisions are made. This characteristic is important because a certain amount of time for implementing these strategic actions may be necessary, and the resulting consequences are not to be perceived and evaluated in the short term. This leads to the second characteristic of a strategy, as the total impact of decisions made on the strategic level will be more significant than on the tactical or operational level. Strategy is additionally characterised by a certain concentration of effort, as resources are focused solely on pursuing a special strategic aim which indicates a narrow focus and less resources for other activities. Strategies consist of a certain pattern of decisions on different organisational levels which need to be reinforced and revised over time. These strategic patterns comprise a unique competence ultimately leading to organisational competitive advantage. Important for its true implementation is a wide distribution of the strategic goals within all levels of a company, accompanied by special norms and values of behaviours for pursuing this strategy.
Today, different definitions exist for the term strategic decisions that are partly competing and complementing each other. Many authors agree that strategic decisions are made from top management and affect the entire organization (Ackerdorf, 1990; Eisenhardt & Zbaracki, 1992; Ren, et al., 2006). Strategic decisions are followed for reaching long term goals and can formulate principles and policies in organizations (Ackerdorf, 1990; Eisenhardt & Zbaracki, 1992). This long-term thinking is needed to develop new products or enter new markets. Ackerdorf (1990) points out, that strategic decisions concentrate on previous and future responses to actual changes in the environment with a great impact of the organization’s performance. Also, Elbanna (2006) emphasises that strategic decisions show how organisations manage their connection between them and their surroundings. Furthermore, strategic decisions require a great proportion of an organization’s resources and are needed rather for extraordinary concerns than for routine situations.
A challenge that is seen by Skinner (1969) and also Wheelwright (1984) is that trade-offs are involved in making strategic decisions. These trade-offs indicate that strategic decisions can have a great impact on other decisions which can make them counterproductive. Furthermore, these strategic decisions cannot create the desired benefits because they bring up new decisions in other sections because of these trade-offs (Skinner, 1969; Wheelwright, 1984). Strategic decisions are context dependent and it may depend on the kind of industry if a decision is strategic or not. For some industries, the introduction of a new product is a strategic decision, compared to other industries where it may not affect the overall strategy (Elbanna, 2006). Additionally, strategic decisions are complex, future oriented, centralized and not repetitive compared to tactical and operational decisions. They establish the environment in which the other two decision levels are performing (Schmidt & Wilhelm, 2000).
3.2.1 Decision Categories
In today’s business environment, the uncertainty and diversity increases and companies are countering with increasing flexibility concerning their operational strategies (Martínez Sánchez & Pérez Pérez, 2005). Generally, decision making is divided into three main levels: strategic, tactical, and operational (Corsano, et al., 2014; Packowski & Francas, 2014). The integration of these decision levels is important to connect strategic objectives to operational actions, so managers at the strategic level know more about the operational process (Ren, et al., 2006), for