1998
SUSTAINABLE DRYLAND AGROECOSYSTEM MANAGEMENT1
G.A. Peterson2, D.G. Westfall2, L.Sherrod3, D. Poss4 K. Larson5 , D.L. Thompson5, and L.R. Ahuja6
A Cooperative Project of the
Colorado Agricultural Experiment Station Department of Soil and Crop Sciences
Colorado State University Fort Collins, Colorado
and the
USDA - Agriculture Research Service Natural Resources Research Center
Great Plains Systems Research Unit Fort Collins, Colorado
1
Funding is provided by: Colorado Agricultural Experiment Station; USDA-ARS; High Plains Regional Climate Center.
2Professors of Soil and Crop Sciences, Department of Soil and Crop Sciences, Colorado State
University, Fort Collins, CO 80523
3USDA-ARS Technician - Great Plains Systems Research Unit 4
Graduate Research Assistant
5Researchers - Plainsman Research Center at Walsh, Colorado 6USDA-ARS Research Leader - Great Plains Systems Research Unit
Sterling Stratton Walsh 0 20 40 60 80 Locations Grain Yield; Bu/A
Wheat Millet Corn Sorghum
Figure 1. Grain yields averaged over soil positions and 12 years of production for each location.
RESEARCH APPLICATION SUMMARY
We established the Dryland Agroecosystem Project in the fall of 1985 and the first crop year was 1986. Grain yields, stover yields, crop residue amounts, soil water measurements, and crop nutrient content are reported annually in previously published technical bulletins. This summary updates our findings for the 12 year period.
Annual yield fluctuations concern growers because they increase risk. Stable yields translate into stable income levels in their operations. Figure 1 provides a summary of 12 years’ average yield history for wheat, corn, sorghum, and proso millet at our three study locations. Wheat has been grown all 12 years at all sites, corn every year at Sterling, and sorghum every year at Walsh. Other crops have been grown for shorter periods of time. Complete data for each crop are available in previously published bulletins (see reference section).
We included yields in Figure 1 from all years, even those where yield losses occurred due to hail, early and late freezes, insect pests, winter kill of wheat, and herbicidal carryover. Fluctuations in corn and sorghum yields are of most interest because they represent the highest input crops. Corn yields have averaged 65 bu/A (Ranging from 14 to 107 bu/A) at Sterling and 72 bu/A (Ranging from 37 to 112 bu/A) at Stratton. These averages include the disastrous yields recorded in 1994, which were caused by drought. Grain sorghum was produced at Stratton for 4 years and yielded an average of 44 bu/A (ranging from 20 to 63 bu/A), but corn has averaged 72 bu/A for the past 7 years, making it a better choice for this environment. At Walsh grain sorghum yields have averaged 45 bu/A (ranging from 27 to 74 bu/A), including the results from the very dry 1995 season.
The 3- and 4-year systems like wheat-corn(sorghum)-fallow and wheat-corn-millet-fallow or wheat-sorghum-sorghum-fallow have increased average annualized grain production by 74% compared to the 2-year wheat-fallow system (Figure 2). Yields are annualized to account for the nonproductive fallow year in rotation comparisons. Economic analyses show this to be a 25-40%
Sterling Stratton Walsh Mean 0 500 1,000 1,500 2,000 2,500 Locations System Grain Yield: Lbs/A
2-Year 3-Year 4-Year
Figure 2.System grain yield for each location.
increase in net annual income for the three year rotation in northeastern Colorado. However, in southeastern Colorado the three year wheat-sorghum-fallow rotation, using stubble mulch tillage in the fallow prior to wheat planting, netted about the same amount of return as reduced till wheat-fallow. New herbicide programs with fewer expensive residual materials have shown promise.
No-till management allows more water storage than conventional tillage, but it also costs more to control the weeds with herbicides used at labeled rates than by tillage. By inserting summer crops like corn, grain sorghum, and annual forages into the rotation the additional water stored is converted to additional production that results in more profit than with wheat-fallow.
Dryland corn yields in northeastern Colorado are highly related to rainfall during the period of 15 July through 25 August (Nielsen, et al. 1996). This is not surprising because this time period includes the tasseling, silking and pollinating period. You may estimate potential long-term corn yields in your area by using the equation:
Grain Yield = 33.9 + 7.49*(Rainfall from 15 July through 25 August)
First obtain the long-term precipitation records from a site near your farm for the 15 July through 25 August period. Then multiply this value by 7.49 and add 33.9. The resulting number is the expected yield in Bu/A. Refer to the publication by Nielsen, et al. (1996) for more detail.
Producers in northeastern Colorado have been adopting the more intensive cropping systems at an increasing rate since 1990. Since corn is one of the principle crops used in more intensive systems, its acreage can be used as an index of adoption rate by producers (see Table below). Area planted to dryland corn has increased from about 20,000 acres per year in years previous to 1990 to over 138,000 acres in 1997. Data for sunflower and proso millet in similar rotations are not available, but individual producers report larger acreages of these crops as well.
Producers wishing to get started in dryland rotation farming may consult bulletins published in previous years and/or the publication by Croissant, et al. (1992).
Dryland Corn Acreage in Eight Northeastern Colorado Counties from 1971 to 1997. YEAR ACRE 1971-1988 21,200 1989 27,000 1990 26,000 1991 32,500 1992 48,500 1993 79,000 1994 92,500 1995 95,500 1996 104,000 1997 138,500
1Data from Colorado Agricultural Statistics (Adams, Kit Carson, Logan, Morgan, Phillips,
CONCURRENT RESEARCH PROJECTS
Wheat - Corn Rotation at Sterling: {Established in fall 1993}
Objective:
Maximize time in crop and minimize weed control costs between crops. Procedure:
i) Roundup, Atrazine, and Command applied after winter wheat harvest. ii) Corn planted into the wheat stubble the following May with an Atrazine + Prowl weed control program. If needed Banvel is used for kochia control. iii) Corn is harvested in late September and wheat is planted the same day, directly into the corn stalks.
iv) Roundup sprayed at planting for downy brome control. Results:
i) Corn yields in 1997 averaged 98 bu/A.
ii) Wheat was cut for hay in 1996 because of excessive amounts of downy brome. The downy brome was not caused by the rotation, but was a carryover from a time when this plot had been in a wheat-fallow system. Wheat was seeded on 17 October 1996, germinated, but winter killed.
Expectations:
Since wheat yield is most dependent on May and June rainfall, wheat yields following corn should be adequate if plants can be established in the dry soil following corn harvest. To date our wheat production has not been very successful. Corn yields would be expected to be similar to those obtained in other rotations.
Experiment Managers:
G.A. Peterson, G. Lindstrom, and D.G. Westfall
Triticale-Corn-Hay Millet Rotation at Sterling: {Established in fall 1993}
Objective:
Maximize time in crop, provide both a cash crop (corn) and forage crops for a mixed livestock-grain farm. Land preparation costs would also be minimized. Procedure:
i) Winter triticale is planted in September into the hay millet stubble.
ii) Harvest winter triticale for forage in June before heading, leaving a 8-10 inch stubble. Roundup, Atrazine, and Command applied after harvest.
iii) Corn planted into the triticale stubble the following May with an Atrazine + Prowl weed control program. If needed Banvel used for kochia control. iv) Corn is harvested in late September.
v) Hay millet is planted into corn stalks the following May and is harvested in July, leaving a 4-6 inch stubble. Weeds controlled with Roundup if necessary. Results:
i) Corn yields in 1997.
ii) Hay millet yields were non-harvestable the first 3 years, but in 1997 averaged 2.0 T/A. The dry summers in 1994 and 1995 were not conducive to hay millet production. In 1996 the sandbur problem was large and we destroyed the crop with Roundup.
iii) Triticale “Harvested” yields have averaged 2.2 T/A over the 4 years, even though we left a 10-12" stubble remaining in the field for cover (Following table)
Triticale and corn grain yields by year and soil. Year Crop Production Soil Positions
Summit Sideslope Toeslope Average ---Tons/A or
Bu/A---1994 Triticale Total 2.6 2.2 3.5 2.8
Harvested1 1.5 1.2 2.0 1.6
Corn Grain All yields < 3 bu/A
1995 Triticale Total 4.6 4.3 3.7 4.2 Harvested1 3.8 3.6 2.9 3.4 Corn Grain 26 2 38 22 1996 Triticale Total 3.0 2.5 3.6 3.0 Harvested1 2.0 1.7 2.5 2.1 Corn Grain 61 66 99 75 1997 Triticale Total 2.0 1.5 2.8 2.1 Harvsted1 1.7 1.3 2.3 1.7 Corn Grain 82 94 98 91
Hay Millet Total 1.5 2.7 2.2 2.1
Harvested2
1.4 2.5 2.0 2.0
1Harvested leaving 10" stubble; 2Harvested leaving 4" stubble.
Expectations:
Winter triticale seems to be a well adapted cool season forage crop. Corn following triticale should be equivalent to corn after wheat, which has a good record at this site over a ten year period of years. The hay millet, given a normal spring moisture pattern, should yield in the 2 T/A range as it did in 1997.
Experiment Managers:
G.A. Peterson, G. Lindstrom, and D.G. Westfall
Wheat-Corn-Pea Rotation at Sterling and Stratton: {Experiment established in fall 1994}
Objective:
Grow winter or spring legumes, after corn harvest and before wheat in the wheat- corn-fallow rotation to evaluate amount of cover produced, water requirement, potential of peas as a forage, N contribution from the legumes to subsequent crops in the rotation, and yields of subsequent crops in the rotation.
Procedure:
i) Austrian Winter Pea planted no-till in fall after corn harvest. Spring legumes planted no-till in March after corn harvest.
50% removed; 0% removed; and a control with no peas. Soil water content is measured monthly in the peas. After harvest remaining peas are killed with Roundup to stop water use.
iii) Winter wheat is planted in September. Herbicides are same as in the wheat-corn- fallow rotation.
iv) Corn is planted in wheat stubble each spring. Herbicides used are same as in the wheat-corn-fallow rotation.
Results:
i) Austrian winter pea at Sterling yielded 3479 lbs/acre and 1919 lbs/ac. Since the Trapper spring pea results have been erratic and undesirable, we decided to try other legumes in 1997. We spring planted Trapper spring pea, Profi spring pea, Austrian winter pea, and black lentils. The yields were as follows
(all planted on March 31, 1997):
Sterling Stratton
---Lbs/A---Trapper spring 2610 1967
Austrian Winter 3387 2221
Profi peas and black lentils were planted for seed production. The profi pea seed was too large to permit a consistent stand, so no yields were taken. The black lentils were too short to harvest and did not appear to have many seeds. It was interesting that the Austrian winter peas planted in the spring yielded as much as those planted in the fall. ii) Total nitrogen left in above ground biomass of the peas were as follows:
Planting Date Sterling Stratton
---Lbs/A---AWP (100% left) Fall 57.8 33.6
AWP (50% left)Fall 24.7 19.4
AWP (100% left) Spring 55.9 50.2
Trapper (100% left) Spring 37.8 33.6
iii) Wheat yields at Sterling were decreased by 4 bu/A following winter peas, compared to yields where no peas had been grown. The precipitation level after pea harvest in 1996 did not result in adequate stored water for the wheat.
Changes for 1998:
We have not been able to track the nitrogen from the pea biomass in the field into the following crops. We speculate the biomass may be blowing off the plots. So, in 1998 we will trap areas with screen to decrease potential blowing losses.
Expectations:
Soil water measurements are being made to determine how much water is used by the peas and how that might affect subsequent winter wheat yields. Data from the
literature would indicate there should be little effect on wheat yield because water use by peas is minimal, and water storage from pea harvest to wheat planting should be adequate to establish good winter wheat stands in the fall.
Using Natural Soil Variability in Landscapes: Site Specific Management of N on Dryland Corn
Objectives:
1) To quantify the spatial variability of corn yields, soil N and "in-situ" net N mineralization over "typical" landscapes of eastern Colorado.
2) To study the spatial relationships among corn yields, soil properties, soil N and N mineralization.
3) To attempt to develop a N recommendation model for dryland corn. Procedure:
Three landscapes, two located near Sterling, CO and one in Stratton, CO were selected for study. The elevation difference within each landscape was 18 and 12 ft. at Sterling and Stratton,
respectively. Soil samples were collected from a maximum depth of four feet across each landscape. In situ N mineralization, as described by Kolberg et al. (1997), was measured at strategic positions across each landscape. The landscapes were cropped with dryland corn under no-till management in a WCF cropping system. The corn was fertilized with five N rates (30, 60, 90 and 120 lb N/A ) and planted in parallel strips across landscapes. In all cases N was applied as UAN solution, and a base P fertilization of 15 lb P2O5/A was applied to all treatments. At
maturity, corn was harvested at 40 and 20 ft. intervals across the Sterling and Stratton landscapes respectively and yields were expressed at 15.5% moisture. Total N was determined in grain and plant material by dry combustion.
Results:
Corn yields of the 0 lb N/A treatment described the variation in soil properties over the landscapes. Higher yields were associated with depositional areas that had higher SOM content and available N, lower pH values, and lower lime contents. Soil profile NO3-N varied 300 and 1200% at the Sterling 1996 and Stratton landscapes, respectively. At Sterling, lowest residual NO3-N was found on the eroded sideslope, but all other positions were generally low. We developed a "soil index" made of a standardized linear combination of SOC, SON, SIC, pH, profile NO3-N and
mineralization rates. Soil organic C, SON, NO3-N, and N mineralization rates, positively influenced the value of the "soil index". Conversely, SIC and soil pH weighted negatively on the "soil index" value. Soil index value explained between 36 and 60% of the total variability in the corn yield of the unfertilized treatment.
We developed models using several independent variables to explain total N uptake and for computing N fertilizer recommendations. Models solely based on profile NO3-N did not perform well. Models using the “balance Method” performed well as long as May-July mineralization rates were included in the model. The only weakness of this model is that it does not have provisions for maximum N uptake, and may overestimate N rates. Models that used "soil index" alone or N mineralization rates in combination with profile NO3-N had a better prediction ability than did any other model. Models that include an index of soil productivity potential (i.e. soil index, or N mineralization rates) can be successful across environments of similar soil variability. Results of this study show promise for improving N fertilizer recommendations in dryland corn either under conventional or VRT soil fertility management.
Literature Cited:
Kolberg, R. L., B. Rouppet, D. G. Westfall and G. A. Peterson 1997. Evaluation of an in situ soil nitrogen mineralization method in dryland agroecosystems. Soil Sci. Soc. Am. J. 61: 504-508.
INTRODUCTION
Colorado agriculture is highly dependent on precipitation from both snow and rainfall. Dryland acreage exceeds irrigated acreage by more than two fold, and each unit of precipitation is critical to production. At Akron each additional inch (25 mm) of water above the initial yield threshold translates into 4.5 bu/A of wheat (12 kg/ha/mm), consequently profit is highly related to water conservation (Greb et al. 1974).
A research project was established in 1985 to address efficient water use under dryland conditions in Eastern Colorado. A more comprehensive justification for its initiation has been reported previously (Peterson, et al.,1988). The general objective of the project is to identify dryland crop and soil management systems that will maximize water use efficiency of the total annual precipitation.
Specific objectives are to:
1. Determine if cropping sequences with fewer and/or shorter summer fallow periods are feasible.
2. Quantify the relationship of climate (precipitation and evaporative demand), soil type and cropping sequences that involve fewer and/or shorter fallow periods.
3. Quantify the effects of long-term use of no-till management systems on soil structural stability, micro-organisms and faunal populations of the soil and the organic C, N, and P content of the soil, all in conjunction with various crop sequences.
4. Identify cropping or management systems that will minimize soil erosion by crop residue maintenance.
5. Develop a data base across climatic zones that will allow economic assessment of entire management systems.
Peterson, et al.(1988) document details of the project in regard to the "start up" period and data from the 1986-87 crop year. Results from the 1988 - 1996 crop years were reported by Peterson, et al. (1989, 1990, 1991, 1992, 1993, 1994, 1995, 1996, and 1997). As in previous bulletins, only annual results are presented. Cropping system research is highly time and weather dependent, and therefore we do not draw major conclusions on an annual basis. Other
publications, such as Wood, et al. (1990), Croissant, et al. (1992), Peterson, et al. (1993a & 1993b) and Nielsen, et al. (1996) summarize and draw conclusions based on a combination of years.
MATERIALS AND METHODS
We are studying interactions of climate, soils and cropping systems. Three sites, located near Sterling, Stratton, and Walsh, were chosen in Eastern Colorado that represent a gradient in potential evapotranspiration (PET) (Fig. 3). All sites have long-term precipitation averages of approximately 16-17 inches (400-425 mm), but increase in PET from north to south. Open pan evaporation, an index of PET for the cropping season, ranges from 40 inches (1,050 mm) in the north to 75 inches (1,900 mm) in the south. Elevations are 4400 (1341 m), 4380 (1335 m), and 3720 (1134 m) feet above sea level at Sterling, Stratton, and Walsh, respectively.
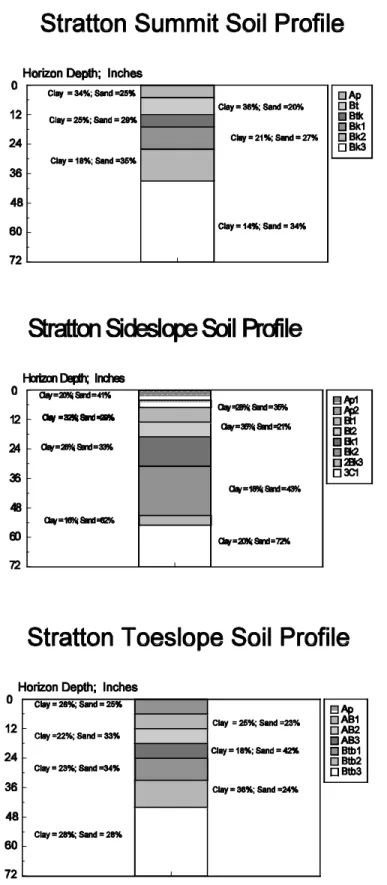
Figure 3. Experimental locations on a climatic gradient, soil variables by slope position, and cropping systems over soil positions.
Each site was selected to represent a catenary sequence of soils common to the
geographic area. Textural profiles for each soil at each location are shown in Figures 4a, 4b, and 4c. There are dramatic differences in soils across slope position at a given site and from site to site. We will contrast the summit soils at the three sites to illustrate how different the soils are. Each profile was described by NRSCS personnel in summer 1991. Note first how the summit soils at the three sites differ in texture and horizonation. The surface horizons of these three soils (Ap) present a range of textures from loam at Sterling, to silt loam at Stratton, to sandy loam at Walsh. Obviously the water holding capacities and infiltration rates differ. An examination of the
horizons below the surface reveals even more striking differences.
The summit soil profile at Sterling (Figure 4a) changes from a clay content of 21% at the surface(Ap) to 31% in the 3-8" depth (Bt1) to a clay content of 38% in the layer between the 8-12" depth (Bt2). At the 8-12" depth the clay content drops abruptly to 27%. The water infiltration in this soil is greatly reduced by this fine textured layer (Bt2). At about the 36" depth (2Bk3) there is an abrupt change from 21% clay to 32% clay in addition to a marked increase in lime content. The mixture of 32% clay and 45% sand with lime creates a partially cemented zone that is slowly permeable to water, but relatively impermeable to roots. Profile plant available water holding capacity is 9" in the upper 36 inches of the profile.
At Stratton the summit soil profile (Figure 4b) is highest in clay at the surface, 34% in the Ap horizon, and then decreases steadily to 14% clay (Bk3) below the 40" depth. There are few restrictions to water infiltration at the surface nor to roots anywhere in the profile compared to
summit soil at Sterling. Profile plant available water holding capacity is 12" in the upper 72 inches of soil.
The summit soil at Walsh (Figure 4c) has very sandy textures above 54" compared to either summit soil at the other sites. No restrictions to water infiltration nor root penetration occurs in the profile. In this soil the abrupt increase in clay content at 54", 40% in the Btkb horizon, represents a type of “plug” in the soil profile. Water can infiltrate rapidly in the coarse-textured surface horizons, but water does not drain rapidly beyond the root zone due to the high clay content of the deepest horizon at 54". This makes this soil more productive than a similar soil with no clay “plug”. The profile plant available water holding capacity is 11". About 2" of the total is in the 5-6' depth, leaving only a 9" storage capacity in the upper 5' of soil.
Many other soil contrasts can be observed by the reader, both within and across sites. All of these soils had been cultivated for more than 50 years, and all exhibit the effects of both wind and water erosion damage. The toeslopes are the recipients of soil materials from the summit and sideslope positions because of their landscape location relative to the others. Hence they also have the highest organic matter content in their surface horizons.
The cropping system during the previous 50 years had been primarily dryland wheat-fallow with some inclusion of grain sorghum at Walsh and corn at Sterling. We placed cropping system treatments over the soil sequence at each site (Fig.3) and they are identified in Table 1. Each system is managed with no-till techniques, and herbicide programs are reported in Appendix Tables 1, 2 and 3. Complete details on measurements being made and reasons for treatment choices are given by Peterson, et al.(1988). Wheat, TAM 107, was planted at 60 lbs/A (67 kg/ha) on 2 October, 24 September, and 25 September 1996 at Sterling, Stratton, and Walsh,
respectively. Corn, Pioneer 3752, was planted on 5 and 6 May 1997 at 17,100 seeds/A (42,240 seeds/ha) at Sterling and Stratton, respectively. Corn, Northrup King N4640Bt, was planted at Walsh on 19 May 1997 at 17,100 seeds/A (42,240 seeds/ha). Sorghum, Northrup King KS310, was planted at Walsh on 12 June 1997 at a seeding rates of 43,000 seeds/A (106,210 seeds/ha) in the WSF and WSSF treatments. Sunflower, Triumph 505C, was planted at a rate of 17,000 seeds/A (41,990 seeds/ha) on 17 and 5 June 1997 at Sterling and Stratton, respectively.
Nitrogen fertilizer is applied annually in accordance with the NO3-N content of the soil profile (0-6 ft or 0-180 cm) before planting, and expected yield on each soil position at each site. Therefore, N rate changes by year, crop grown, and soil position (Table 2). Nitrogen fertilizer for wheat, corn, and sunflower was dribbled on the soil surface over the row at planting time at Sterling and Stratton. Nitrogen on wheat at Walsh was topdressed in the spring, and N was sidedressed on corn and sorghum. We made all N applications as 32-0-0 solution.
We band applied P (10-34-0) at planting of all crops near the seed. Phosphorus was applied on one-half of each corn and proso millet plot over all soils, but applied to the entire plot in the case of wheat . The rate of P is determined by the lowest soil test on the catena, which is usually found on the sideslope position. This rate has been 8.5 lbs/A (20 lbs P2O5/A) or (9.5
kg/ha) of P at each site each year thus far. We changed the P fertilization treatment for wheat in fall 1992, so that the half plot that had never received P fertilizer in previous years is now treated when planted to wheat. Other crops in the rotation only receive P on the half plot designated as NP. Zinc (0.9 lbs/A or 1 kg/ha) is banded near the seed at corn planting at Sterling and Stratton to correct a soil deficiency.
Table 1. Cropping systems for each site in 1997. Site Rotations Sterling 1) Wheat-Fallow (WF) 2) Wheat-Corn-Fallow (WCF) 3) Wheat-Corn-Sunflower-Fallow (WCSF) 4) Opportunity Cropping* 5) Perennial Grass Stratton 1) Wheat-Fallow (WF) 2) Wheat-Corn-Fallow (WCF) 3) Wheat-Corn-Sunflower-Fallow (WCSF) 4) Opportunity Cropping* 5) Perennial Grass Walsh 1) Wheat-Fallow (WF) 2) Wheat-Sorghum-Fallow (WSF) 3) Wheat-Sorghum-Sorghum-Fallow (WSSF)
4) Continuous Row Crop (Alternate corn & sorghum) 5) Opportunity Cropping*
6) Perennial Grass
*Opportunity cropping is designed to be continuous cropping without fallow, but not monoculture.
Opportunity Cropping History Year Site
Sterling Stratton Walsh
1985 Wheat Fallow Sorghum 1986 Wheat Wheat Sorghum 1987 Corn Sorghum Millet 1988 Corn Sorghum Sudex 1989 Attempted Hay Millet Attempted Hay Millet Sorghum
1990 Wheat Wheat Attempted Sunflower 1991 Corn Corn Wheat
1992 Hay Millet Hay Millet Corn
1993 Corn Corn Fallow
1994 Sunflower Sunflower Wheat
1995 Wheat Wheat Wheat
1996 Corn Corn Fallow
1997 Hay Millet Hay Millet Corn
We measured soil water with the neutron-scatter technique. Aluminum access tubes were installed, two per soil position, in each treatment at each site in 1988. These tubes are not removed for any field operation and remain in the exact positions year to year. Precautions are taken to prevent soil compaction around each tube. By not moving the tubes over years we get the best possible estimates of soil water use in each rotation. Soil water measurements were made on all soils and rotations at planting and harvest of each crop, which also represents the beginning and end of non-crop or fallow periods.
RESULTS AND DISCUSSION Climatic Data
Precipitation and its distribution in relationship to plant growth stages controls grain and forage yields. Rarely do the precipitation amounts and distributions match the long-term normals. Precipitation in the last six months of 1996, the period prior to wheat planting, was above the normals by 1.4 in. (35 mm) at Sterling, by 0.9 in. (23 mm) at Stratton, and by 5.3 in. (135 mm) at Walsh (Table 3a). The first half of 1997 was substantially below normal at Sterling (-2.4 in. or 61 mm) , about normal at Stratton, and 1.6 in. (41 mm) below normal at Walsh. Precipitation was well above normal during the second half of 1997 at all sites; especially at Sterling where rainfall exceeded the long-term normal by 7.6 in. (193 mm) (Table 3a).
Hail damage in 1997 occurred twice at the Stratton site, mid and late July, and the corn plants were seriously damaged. The corn still averaged 49 bu/A, which is about 25 bu/A less than would have been expected with the high rainfall in July and August.
Wheat
Wheat yields in 1997 were a function of weather and insect related factors. Yields at Sterling were near the 12 year average at this site, but yields at Stratton were 15 bu/A (1000 kg/ha) below the long-term mean because of damage due to a combination of Brown Wheat Mite [Petrobia
latens], Russian Wheat Aphid [Diuraphis noxia (Mordvilko)] and a minor Wheat Streak Mosaic
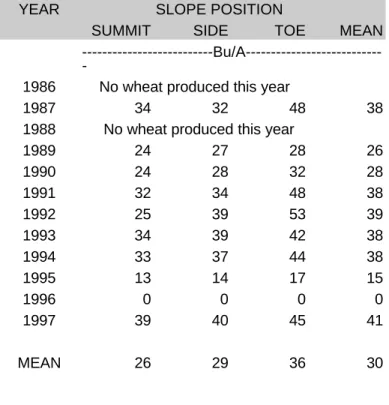
Virus infestation (Tables 5 & 6). Conversely wheat yields at Walsh were 11 bu/A (740 kg/ha) above the 10 year average for this site because of good fall planting moisture conditions and timely spring rains (Table 7). Note in Tables 4a & 4b that soil position also affected yield, with toeslopes always having the highest yields due to their greater chance for additional water and having no root restrictions (Figures 4a, 4b, & 4c)
Cropping system effects on wheat yields were very apparent at Sterling and Stratton (Tables 4a & 4b) where WF yielded about 10 bu/A (670 kg/ha) less than wheat in either the WCF or WCSF rotations. Downy brome (Bromus tectorum L.) infestations in the WF damaged yields relative to the other rotations. Over the long-term, 3-year systems have yielded the same as WF when no downy brome is present. However, the 4-year systems have yielded about 5 bu/A more than either WF or WCF at Sterling and Stratton. The reason is not obvious. At Walsh all systems have yielded essentially the same. It is important to note that the shorter fallows in the more intensive systems have never decreased wheat yield and potential profit for that crop.
Corn and Sorghum
Corn yields at Sterling exceeded the 12-year average by 42 bu/A (2630 kg/ha) (Table 9), but were 23 bu/A (1440 kg/ha) below the average at Stratton (Table 10). The high Sterling yields were directly attributable to the above average rainfall during the corn growing season (Tables 3b). July and August precipitation at Sterling totaled 10.9 in., which is 6.5 in. above the normal. The rainfall from 15 July to 25 August, the critical period for corn production, was 9.5 in. at Sterling. Using the equation published by Nielsen, et al. (1996) we would predict a yield of 105 bu/A with this amount of rainfall, which is very near the 107 bu/A yield reported in Tables 8a & 9. The corn at Stratton was damaged by hail on two different dates in July. During the critical
76 bu/A. This suggests that the hail reduced yields by at least 25 bu/A.
The toeslope soil position produced the highest yields at both sites as was expected because of its more favorable water regime (Figures 4a & 4b). Compared to other years the summit and sideslope soil positions at Sterling produced proportionately more grain than usual. For example the summit and sideslope produced 77 and 90% of the yield of the toeslope, respectively. The long-term means are 63 and 74% for the summit and sideslope postions, respectively. In years with favorable precipitation during the critical period, soil water storage capacity and slope position have less influence on yield.
Phosphorus fertilization increased corn grain yield on both the summit and sideslope positions at Sterling, but had essentially no effect on these same soils at Stratton (Tables 8a & 8b). Soil tests indicate that responses to P fertilizer are expected on the sideslopes, but are not likely on the summit positions. Recall that the entire experimental plot now receives P fertilizer when planted to wheat. Using both the 1996 and 1997 corn yield data, we still can not be definitive regarding the value of the carryover P to the corn from the fertilized wheat crop.
Sorghum yields at Walsh ranged from 33 to 83 bu/A (2070 to 5200 kg/ha) (Tables 8a & 8b), which is above the long-term average (Table 11). The excellent spring rainfall plus the above average August rainfall, 4.6 in. (117 mm), gave us excellent yield potential (Table 3a).
Long-term sorghum yields (Tables 11 & 12) are about 45 bu/A for the WSF and WSSF-1 rotation and about 35 bu/A for the second year sorghum in the WSSF-2 rotation. The second year sorghum yield is very similar to the average yield for continuous sorghum. Our sorghum yields the first year after wheat are 15 bu/A (940 kg/ha) higher than the Baca County average sorghum yield [30 Bu/A = 1880 kg/ha (1986-1996)], and our second year yields in the WSSF rotation are 5 bu/A (310 kg/ha) higher than the mean.
A continuous row-crop system (Tables 8a, 8b & 12) has been included at the Walsh site since its beginning. We planted grain sorghum every year from 1986-1992. By 1992 the shatter cane weed problem was so severe that we planted corn in 1993 to allow use of herbicides that could control the shatter cane. Two additional plots were added to the experiment in 1993 so that we could test a rotation effect within the continuous row-crop system. This year the corn, with P applied, yielded 42, 50 and 70 bu/A for the summit, sideslope and toeslope respectively (Table 8a). These yields are 2 to 2.5 times greater than our previous average. For the first time in 1997 we were able to plant later, 19 May, and take advantage of the late season precipitation
distribution. Our success with later planted corn was made possible by using a Bt corn, which prevented damage from the southwestern corn borer. In previous years we did not our corn with an insecticide for corn borer control because we considered treatment was too expensive for a dryland system. Corn in the opportunity system yielded even better, averaging 62 Bu/A (3860 kg/ha) over all soils. The opportunity system had an apparent advantage because it had been fallowed the previous year. However, soil water data at planting, Tables 26b and 27 do not indicate any difference in stored water at planting.
Phosphorus fertilizer effects differed by rotation. In rotations with first year sorghum after wheat P fertilizer appeared to have adverse effects on yields on all soils (Tables 8a & 8b). In contrast the second year sorghum in the WSSF rotation and the sorghum and corn in the
continuous row crop system responded positively to P fertilization, even on the toeslopes which have high soil test P levels. The average response to P over all soils in these more intensive
systems averaged 6 Bu/A (380 kg/ha). Sometimes response to P fertilization relates to effects on maturity in terms of either timely rainfall events or earlier than expected frost dates. In 1997 neither of these maturity related issues was a factor.
Sunflower
Sunflower was planted following corn in the 4-year system (WCSF) at Sterling and Stratton beginning in 1994. We replaced proso millet with sunflower to help reduce grassy weed problems that were increasing in the four-year system. This year sunflower stands were excellent at Sterling and weed control also was good. However, at Stratton stands were poor and Kochia was
uncontrolled by the herbicide program.
Seed yields ranged from 1060 to 1720 lbs/A (1190 to 1930 kg/ha) and from 130 to 310 lbs/A(150 to 340 kg/ha) at Sterling and Stratton, respectively (Tables 13a & 13b). With adequate weed control, yields at Sterling were good, but the high weed pressure, primarily kochia, at Stratton ruined the crop. Herbicides were applied identically at both sites and both were incorporated with a Lilliston rolling cultivator, but the results were widely different. We did accomplish our goal of grassy weed control and were able to essentially eliminate sandbur from the sunflower plots.
Opportunity Cropping
Opportunity cropping is an attempt to crop continuously without resorting to monoculture. It has no planned summer fallow periods, and is cropped as intensively as possible. In 1997 we grew hay millet in the opportunity system at Sterling and Stratton and corn at Walsh (Tables 8a, 14a, & 14b). Yields were excellent in all cases, and especially the corn at Walsh, which was the highest corn yield ever achieved at that site. From the beginning of our experiment in fall 1985 we have grown 10, 10, and 8 crops in 12 years at Sterling, Stratton and Walsh, respectively in the opportunity system (Tables 15, 16 & 17). Productivity in opportunity cropping has been excellent, especially at Sterling and Stratton. Note that in 12 years at these two sites the system has produced a total of 93 to 130 bushels of wheat, 305 to 334 bushels of corn or sorghum, and 4.7 tons of forage per acre. Crop productivity at Walsh over 12 years has been 93 bushels of wheat, 195 bushels of corn or sorghum, and 0.5 tons of forage. Two fallow years were included at Walsh and crops failed in two years, 1987 and 1990.
Using common grain and forage prices, the average total gross value of the 12 year production averaged over soils was $1324, $1543, and $881 at Sterling, Stratton and Walsh, respectively (Tables 15, 16 & 17). Average total value was $110, $129, and $73/A/year at Sterling, Stratton and Walsh, respectively. Suppose, for comparison purposes, you produced 40 bu/A wheat yields in a wheat-fallow system. Using the same wheat price per bushel, the average gross value would have been $80/A/year, since you only produce wheat on one-half of your acres each year. Obviously the opportunity cropping has an advantage in gross income compared to wheat-fallow at the two northern locations. If you had a wheat-corn-fallow system with 40 bu/A wheat and 70 bu/A corn yields, annual gross income would be $112/A, which is similar to the $110 and $129/A/year produced in the opportunity system at Sterling and Stratton, respectively.
Above average annual precipitation has been a major factor contributing to the excellent productivity; annual precipitation has been 2 to 3 inches above the long-term normals for all sites
during the 11 year study period. Therefore, growers should use extreme caution in extrapolating these results to their own operations. On the other hand, the systems could have been even more productive had we managed them more carefully. The missed crop at Sterling and Stratton in 1989 was a management mistake and not related to weather. The stored water was used by weeds in that summer and thus functioned like crop removal in terms of the water budget. Failure to produce a millet crop at Walsh in 1987 occurred because we chose proso millet, which is not a well adapted crop for that climate. A forage like sudex, for example, would have done well that year. Sunflowers at Walsh in 1990 failed because of jack rabbit damage, and again not because of climatic factors. The fallows in 1993 and 1996, however, were necessary.
Our goal has been to produce wheat and corn or sorghum, the highest value crops, as
frequently as possible in our systems. We have used forages to transition from row crops back to fall planted wheat. The plan has been to harvest the forage early enough to plant wheat in the fall, which has been successful. We have preliminary data that shows that we might be able to plant wheat directly in the corn stalks in early October and omit the need for a forage crop. Another good possibility is planting proso the year after corn or sorghum, harvesting it as early as possible, and then planting wheat immediately into the proso stubble in late September or early October.
One of the great advantages of continuous cropping is avoidance of seedbed preparation costs and the short intervals between crops. Secondly, we have observed distinct advantages in residue cover when we avoid fallow periods. Thirdly the weed control has been less of a problem in the opportunity system. The combination of crop competition and no fallow has reduced weed pressures compared to other systems. One major example of differences in weed pressure has been in regard to the invasion of the perennials, Tumblegrass (Schedonnardis paniculata) and Red Threeawn (Aristada longiseta), in our no-till systems. All systems with fallows, especially WF and WC(S)F, have had devastating invasions of these grassy weeds. We have resorted to shallow sweep tillage to control these grasses in all of our systems except opportunity. The opportunity system has remained free of these weeds. These perennial grasses are shallow rooted and cannot get established if surface soil water is low. Fallow, where we are saving water and keeping the surface weed free, provides an excellent environment for their establishment. Since glyphosate is not very effective on these plants, tillage is the only economically feasible control. In contrast, opportunity cropping has no long fallows. Crop plants keep the soil surface dry much of the time and the two grassy invaders have not established.
Crop Residue Base
Maintenance of crop residue cover during non-crop periods and during seedling growth stages is vital to maximizing water storage in the soil. Crop residues provide protection from raindrop impact, slow runoff, and decrease water evaporation rates from the soil. Cover greatly reduces erosion, both by wind and water.
Residue amount is being monitored by soil and crop within each system (Tables 18, 19 & 20). Residues present at planting are needed to protect the soil during the early plant growth stages when there is little canopy present. Residue levels are subject to annual variations in climate, both in terms of production and decomposition rates. Obviously drier years decrease production, but also may decrease decomposition rates. The net effect is difficult to assess because the particular portion of the year that is extra dry or wet will change the direction of the
impact. Residue quantities always are largest on toeslopes at each site, which is a function of productivity level. Walsh, the most stressed site historically, has usually had the lowest residue levels over all years.
Residue levels present just prior to wheat planting are the minimum point in all systems because this time marks the end of the summer fallow period where decomposition has been occurring with no new additions of crop biomass. Therefore, cover is at its minimum, and erosion potential is at its maximum point. Residues present at wheat planting (Table 18) for WF are usually less than for either the 3- or 4-year systems on all soils at all sites, but exceptions did occur as can be noted in Table 20. The WF system produces less biomass compared to the more intensive systems. Residue levels generally are lowest at the Walsh site because less biomass is produced and decomposition is greater because of the longer growing season at that site.
However, at wheat planting in the fall of 1996 the Walsh location had residue levels similar to the other sites. This is an example of how year to year variability affects residue levels and why it is unwise to make decisions regarding system residue levels based on a single year of observation.
Opportunity cropping has no planned summer fallow periods, but is cropped as intensively as possible. In general opportunity cropping has more residue than all others. Two factors are responsible: (1) There is more addition of residue from the high intensity cropping; and (2) there is no summer fallow period with warm, moist soil conditions to encourage decomposition at the expense of addition. Over the past 12 years there have been crops produced in 10 of the 12 at Sterling and Stratton and in 8 of the 11 at Walsh. At Sterling and Stratton there was a large input of weed residues to the soil in one of the failed crop years, and thus residue inputs at these sites are even higher than indicated by harvested crop data. An additional benefit of the opportunity system is that continuous cropping with no-till results in soil surfaces that are very resistant to soil erosion by wind or water.
Soil Water
Soil water supplies plant demand between rainfall events. Soils of eastern Colorado cannot store sufficient water to sustain a crop for the whole season, even if at field capacity at planting time. We monitor soil water in our systems to determine how efficiently various rotations and crops within rotations are using water. Our concern is how well precipitation is captured in non-crop periods, and subsequently how efficiently water is used for plant growth. Soil water at planting and harvest of each crop is shown by soil depth increment for each crop (Tables 21 to 28).
Wheat:
Soil profile available water was near field capacity at all soil positions in all systems at wheat planting in the fall of 1996 at all sites (Tables 21, 22 & 23). Note that at all sites the amount of available water at planting was essentially equal in all systems despite the fact that the 3- and 4-year systems have fewer months of time to store water than does the 2-4-year wheat-fallow.
Water use by the wheat crop was similar for all systems at all sites, but there was more water remaining in the soil profile at harvest than normally occurs. At Walsh late rains near harvest replenished the upper soil profile.
Walsh in 1997 the lower profile was totally exhausted of available water.
Corn and Sorghum:
Soil water contents at corn and sorghum planting were excellent (Tables 24, 25 & 26). Even the second year sorghum in the WSSF rotation at Walsh had a large quantity of of available water at planting, which is not always the case because of the short recharge period from the previous fall (Table 26). Rains in the late summer and fall of 1996 allowed this treatment to have higher than average soil water content at sorghum planting in spring 1997 (Table 3a).
Distribution of soil water at corn and sorghum planting and harvest also is shown in these tables. A relatively large amount of available water remained in the soil at corn and sorghum harvests at all sites compared to what we observe in most years. The above average rainfall in July and August probably accounts for this (Table 3a). Our long-term average data show water use from depths greater than 5 feet (150 cm) for both corn and sorghum, even though it was not very apparent in 1997.
Sunflower:
Available soil water at sunflower planting in May at Sterling and Stratton in the WCSun-F rotation was excellent as is shown in Table 26. Sunflower effectively used water to the 5 foot depth (155 cm) as evidenced by the water data on on the toeslope at Sterling. Poor plant populations at Stratton accounted for the minimal water use by sunflower at that site.
Opportunity and Continuous Cropping Systems:
Soil water data for opportunity and continuous cropping systems are shown in Tables 27a, 27b, & 28). Note that in all cases in 1997 there was adequate water remaining in the profile at harvest to favor cropping again in 1998. Wheat was planted into the hay millet residue at Sterling and Stratton in fall 1997. At Walsh the opportunity cropping was in corn in 1997 and wheat was planted after corn harvest in fall 1997.
Nitrogen and Phosphorus Contents of Grain and Stover
Nitrogen and P contents were determined for both grain and stover for each crop on each soil at each site (Tables 29-32). The reader can calculate crude protein content of grain by multiplying wheat grain N content by 5.7; corn or sorghum grain N content by 6.3; and hay millet or triticale forage N by 6.3. All nutrient concentrations are on a dry weight basis, consequently crude protein levels will appear high compared to market levels. Therefore, a grain moisture correction must be applied to obtain market levels.
On a dry matter basis, wheat proteins averaged 12.6% at Sterling, 13.7% at Stratton and 13.0 % at Walsh (Table 29a). To correct these values for grain moisture content, multiply by 0.88, which results in an average of about 11.5% protein averaged over all sites at market
moisture levels. These values indicate that N fertilization was adequate for the wheat crop based on research by Goos, et al. (1984). They established that if grain protein levels were above 11.1%, yield was not likely to be limited by N deficiency.
Wheat straw N concentrations ranged from 0.51 to 1.01% and averaged 0.70 % over all sites; thus each ton of straw contained about 14 lbs of N (Table 29b). The highest straw N levels were found at Stratton, which was the site with the lowest grain yields. The insect damage stunted growth and reduced grain yield, which caused more N to remain in the straw at this site.
6.8 to 9.1% protein on a market moisture basis (Table 30a). Corn and sorghum stover N contents varied from 0.51 to 1.08% and averaged 0.78% (Table 30b). Each ton of corn or sorghum stalks thus contained an average of 16 lbs of N. Note that second year grain sorghum in the WSSF rotation at Walsh had lower N contents in the stover as compared to all other systems at that site. This may mean we were very near a N deficiency point for this crop.
Nitrogen levels in sunflower seeds (Table 31a) ranged from 2.72 to 3.57%, while levels in the stover ranged from 0.65 to 2.08% (Table 31b). At Stratton where stands and seed yields were low, the stover had N levels that were nearly double those found at Sterling.
Hay millet forage N content ranged from 1.12 to 1.88% and averaged 1.55%, which is equivalent to 9.8% crude protein on a dry matter basis (Table 32).
Soil Nitrate-Nitrogen
Residual soil NO3-N analyses are routinely conducted on soil profile samples (6 ft or
0-180 cm ) taken prior to planting for each crop on each soil at each site (Table 33). These analyses are used to make fertilizer N applications for a particular crop on each soil at each site.
Accumulation of residual nitrate allows reduction in the fertilizer rate. By using residual soil nitrate analyses of the root zone we also can determine if nitrate is leaching beneath the root zone. With improved precipitation-use efficiency in the more intensive crop rotations, the amount of nitrate escaping the root zone should be minimized. Generally over the past 5 years, the wheat-fallow system has had higher residual nitrates than the 3- or 4-year rotations at the end of wheat-fallow prior to wheat planting. However, in 1997 this pattern was not obvious. Perhaps the use of adequate, but not excessive N rates over the years, has caused the N availability in each system to come to a new equilibrium. The opportunity system at Walsh in 1997 had higher nitrate levels than most other systems at that site. This particular treatment was planted to wheat in 1995 and very low yields were harvested (<18 bu/A). It was then fallowed in 1996; thus nitrates were higher than usual because of little removal and a fallow that allowed mineralized N to accumulate.
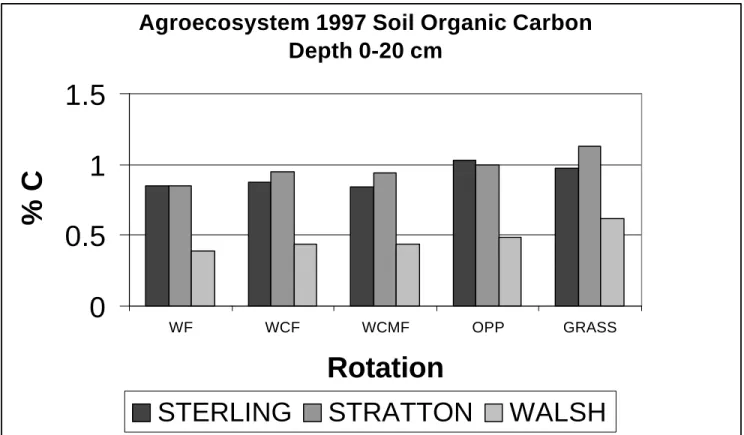
Soil Organic Carbon
Soils were sampled for organic carbon (C) analysis in August 1997 in the fallow phase of the WF, WC(S)F, and WCS(S)F rotations plus the Opportunity and Continuous Grass treatments. By summer 1997 all systems had been in place for 12 years. Samples were taken to a depth of 20 cm in increments of 0-2.5, 2.5-5, 5-10, and 10-20 cm and organic C was determined by Walkley-Black titration.
Organic C increased as cropping intensity increased (Table 34). All rotations at all depths at all sites had higher C levels than did WF with the exception of the 10-20 cm depth in WCF at Sterling. Opportunity and Continuous grass had the highest organic C contents across all sites and soil depths. Figure 5 depicts the soil C concentrations for the complete 20 cm depth. Increases in soil organic C are an indication that the systems are improving overall soil conditions. Aggregate structure in surface soils should be strengthened by increases in C and thus become more open to water infiltration.
Agroecosystem 1997 Soil Organic Carbon
Depth 0-20 cm
0
0.5
1
1.5
WF WCF WCMF OPP GRASSRotation
% C
STERLING
STRATTON
WALSH
Figure 6. Soil organic carbon in 1997 by site and cropping system (0-20 cm depth).
SUMMARY & CONCLUSIONS
The 1997 cropping season provided the usual variability in yields. Wheat, corn, and sunflower at Stratton yielded less than expected because of insect damage to the wheat, hail damage to the corn, and poor stands of sunflower with large kochia infestations. Sterling had average wheat yields and the highest corn and sunflower yields observed in our 12 years of work. Walsh had outstanding wheat yields, normal sorghum yields, and the highest corn yields we have ever observed at that site. Summer rainfall was excellent at all sites and was the reason for the excellent warm season crop yields, but the hail and poor stands at Stratton did not allow the potential yields to be realized. Long-term averages of summer crops, corn and sorghum, are 65, 72 and 45 bu/A for Sterling, Stratton and Walsh, respectively. These means include years of near crop failure due to drought, hail, and early frost. Our data show that cropping intensification is certainly possible in the central Great Plains.
More intensive rotations like fallow and wheat-corn(sorghum)-millet-fallow have more than doubled grain water use efficiency in all three study environments when compared over years. Water conserved in the no-till systems has been converted into increased grain production. In northeastern Colorado intensive rotations have increased dollar returns to land, labor, capital, management and risk by 25-40% compared to wheat-fallow
practiced either with no-till or with conventional tillage (Peterson, et al., 1993a). Because, historically, millet prices are relatively low, the wheat-corn-fallow has been more profitable than wheat-corn-millet-fallow. In southeastern Colorado, even though the increased water use
efficiency is achieved, the net returns favor wheat-fallow over the intensive rotations. The cost of sorghum production in our systems has been too high compared to the added yield received. Lower cost weed control systems are being tested at Walsh in an attempt to improve the profit potential of the intensive systems in that environment.
REFERENCES
Croissant, R.L., G.A. Peterson, and D.G. Westfall. 1992. Dryland cropping systems in eastern Colorado. Service in Action No. 516. Cooperative Extension. Colo. State Univ. Fort Collins, CO.
Goos, R.J., D.G. Westfall, and A.E. Ludwick. 1984. Grain protein content as an indicator of nitrogen fertilizer needs in winter wheat. Colorado State University Service in Action No. .555. Greb, B.W., D.E. Smika, N.P. Woodruff and C.J. Whitfield. 1974. Summer fallow in the Central Great Plains. In: Summer Fallow in the Western United States. ARS-USDA. Conservation Research Report No. 17.
Nielsen, D., G.A. Peterson, R. Anderson, V. Ferreira, W. Shawcroft, and K. Remington. 1996. Estimating corn yields from precipitation records. Cons. Tillage Fact Sheet 2-96. USDA/ARS and USDA/NRCS. Akron, CO.
Peterson, G.A., D.G. Westfall, N.E. Toman, and R.L. Anderson. 1993a. Sustainable dryland cropping systems: economic analysis. Tech. Bul. TB93-3. Colorado State University and Agricultural Experiment Station. Ft. Collins, CO.
Peterson, G.A., D.G. Westfall, W. Wood, and S. Ross. 1988. Crop and soil management in dryland agroecosystems. Tech. Bul. LTB88-6. Colorado State University and Agricultural Experiment Station. Ft. Collins, CO.
Peterson, G.A., D.G. Westfall, W. Wood, L. Sherrod, and E. McGee. 1989. Crop and soil management in dryland agroecosystems. Tech. Bul. TB89-3. Colorado State University and Agricultural Experiment Station. Ft. Collins, CO.
Peterson, G.A., D.G. Westfall, L. Sherrod, C.W. Wood, and E. McGee. 1990. Crop and soil management in dryland agroecosystems. Tech. Bul.TB90-1. Colorado State University and Agricultural Experiment Station. Ft. Collins, CO.
Peterson, G.A., D.G. Westfall, L. Sherrod, C.W. Wood, and E. McGee. 1991. Crop and soil management in dryland agroecosystems. Tech. Bul.TB91-1. Colorado State University and Agricultural Experiment Station. Ft. Collins, CO.
Peterson, G.A., D.G. Westfall, L. Sherrod, E. McGee, and R. Kolberg. 1992. Crop and soil management in dryland agroecosystems. Tech. Bul.TB92-2. Colorado State University and Agricultural Experiment Station. Ft. Collins, CO.
dryland agroecosystem management. Tech. Bul. TB93-4. Colorado State University and Agricultural Experiment Station. Ft. Collins, CO.
Peterson, G.A., D.G. Westfall, L. Sherrod, R. Kolberg, and B. Rouppet. 1994. Sustainable dryland agroecosystem management. Tech. Bul. TB94-1. Colorado State University and Agricultural Experiment Station. Ft. Collins, CO.
Peterson, G.A., D.G. Westfall, L. Sherrod, R. Kolberg, and D. Poss. 1995. Sustainable dryland agroecosystem management. Tech. Bul. TB95-1. Colorado State University and Agricultural Experiment Station. Ft. Collins, CO.
Peterson, G.A., D.G. Westfall, L. Sherrod, R. Kolberg, and D. Poss. 1996. Sustainable dryland agroecosystem management. Tech. Bul. TB96-1. Colorado State University and Agricultural Experiment Station. Ft. Collins, CO.
Peterson, G.A., D.G. Westfall, L. Sherrod, D. Poss, K. Larson, and D.L. Thompson. 1997. Sustainable dryland agroecosystem management. Tech. Bul. TB97-3. Colorado State University and Agricultural Experiment Station. Ft. Collins, CO.
Wood, C. W., D. G. Westfall, G. A. Peterson and I. C. Burke. 1990. Impacts of cropping
intensity on carbon and nitrogen mineralization under no-till agroecosystems. Agron. J. 82: 1115-1120.
Table 2. Nitrogen fertilizer application by soil and crop for 1997.
ROTATION
SITE SOIL CROP WF WCF WCMF OPP
---Lbs/A---Sterling Summit Wheat 46 46 46
Sideslope " 46 46 46 Toeslope " 46 46 46 Summit Corn - 100 100 Sideslope " - 100 100 Toeslope " - 100 100 Summit Sunflower - - 31 Sideslope " - - 31 Toeslope " - - 31
Summit Hay Millet 75
Sideslope " 75
Toeslope " 75
WF WCF WCMF OPP
Stratton Summit Wheat 46 46 46
Sideslope " 46 46 46 Toeslope " 46 46 46 Summit Corn - 100 100 Sideslope " - 100 100 Toeslope " - 100 100 Summit Sunflower - - 31 Sideslope " - - 31 Toeslope " - - 0
Summit Hay Millet 75
Sideslope " 75
Toeslope " 75
CONT.
WF WSF WSSF OPP CROP
Walsh Summit Wheat 50 50 50
Sideslope " 50 50 50 Toeslope " 50 50 50 Summit Sorghum1 - 35 35 Sideslope " - 35 35 Toeslope " - 35 35 Summit Sorghum2 - - 60 Sideslope " - - 60 Toeslope " - - 60 Summit Corn - - - 35 35 Sideslope “ - - - 35 35 Toeslope “ - - - 35 35
Table 3a. Monthly precipitation for each site for the 1996-97 growing season.
MONTH STERLING STRATTON WALSH
1996 1996 Normals 1996 Normals 1996 Normals
JULY 2.43 2.40 6.06 2.60 4.39 3.10 AUGUST 2.89 2.00 2.32 2.30 4.82 2.30 SEPTEMBER 3.55 1.20 0.68 1.60 4.24 1.30 OCTOBER 0.39 1.00 0.07 1.00 0.29 1.10 NOVEMBER 0.00 0.70 0.28 0.70 0.28 0.60 DECEMBER 0.03 0.60 0.09 0.40 0.00 0.30 SUBTOTAL 9.29 7.90 9.50 8.60 14.02 8.70
1997 1997 Normals 1997 Normals 1997 Normals
JANUARY 0.24 0.50 0.46 0.40 0.27 0.40 FEBRUARY 0.36 0.50 1.27 0.40 0.68 0.30 MARCH 0.11 1.30 0.05 1.00 0.08 0.70 APRIL 0.55 2.00 0.98 1.60 2.20 1.30 MAY 2.51 3.00 2.29 2.70 0.73 2.50 JUNE 3.93 2.80 2.94 2.40 2.37 2.70 SUBTOTAL 7.70 10.10 7.99 8.50 6.33 7.90
1997 1997 Normals 1997 Normals 1997 Normals
JULY 7.86 2.40 9.11 2.60 0.53 3.10 AUGUST 3.05 2.00 4.24 2.30 4.63 2.30 SEPTEMBER 1.69 1.20 0.45 1.60 0.60 1.30 OCTOBER 2.31 1.00 4.21 1.00 2.47 1.10 NOVEMBER 0.18 0.70 0.96 0.70 0.00 0.60 DECEMBER 0.41 0.60 1.16 0.40 1.94 0.30 SUBTOTAL 15.50 7.90 20.13 8.60 10.17 8.70 YEAR TOTAL 23.20 18.00 28.12 17.10 16.50 16.60 18 MONTH 32.49 25.90 37.62 25.70 30.52 25.30 TOTAL
Growing Season Segments
Wheat Corn Vegetat. Reprod. Preplant Growing Season Sep - Mar Apr - Jun Jul - Apr May - Oct Year ---Inches---1987-88 5.2 9.9 11.1 15.8 1988-89 3.1 6.5 10.5 14.3 1989-90 5.1 4.7 11.8 13.0 1990-91 3.8 7.2 12.3 11.7 1991-92 4.5 4.8 9.1 14.8 1992-93 4.5 6.2 15.5 10.6 1993-94 6.4 3.0 10.2 6.1 1994-95 7.3 14.4 9.6 17.2 1995-96 4.2 9.2 7.5 18.0 1996-97 4.7 7.0 10.6 21.4 Long Term 5.8 7.8 12.2 12.4 Average
Table 3c. Precipitation summary by growing season segment for Stratton from 1986-1997.
Growing Season Segments
Wheat Corn Vegetat. Reprod. Preplant Growing Season Sep - Mar Apr - Jun Jul - Apr May - Oct Year ---Inches---1987-88 4.3 7.2 8.8 12.6 1988-89 3.0 9.4 5.3 15.5 1989-90 5.3 6.1 11.0 13.4 1990-91 4.4 4.1 10.7 14.7 1991-92 3.3 6.1 14.2 13.6 1992-93 3.3 3.8 11.8 14.7 1993-94 4.3 7.8 16.7 13.5 1994-95 7.0 10.0 14.8 13.7 1995-96 3.5 6.0 8.1 14.5 1996-97 2.9 6.2 12.2 23.2 Long Term Average 5.5 6.7 12.0 12.6
Table 3d. Precipitation summary by growing season segments for Walsh from 1986-1997.
Growing Season Segments
Wheat Sorghum Vegetat. Reprod. Preplant Growing Season Sep - Mar Apr - Jun Jul - Apr May - Oct Year ---Inches---1987-88 4.3 7.6 7.4 11.1 1988-89 4.1 11.5 8.1 20.2 1989-90 5.7 7.4 14.1 12.5 1990-91 5.0 7.7 11.7 12.2 1991-92 2.7 5.8 7.1 13.2 1992-93 6.1 9.2 13.8 14.5 1993-94 3.2 5.3 8.7 16.3 1994-95 4.6 7.2 16.6 7.2 1995-96 1.7 3.5 1.9 17.1 1996-97 5.8 5.3 17.2 11.3 Long Term 4.7 6.5 11.4 13.0 Average
Table 4a. Grain and stover yields for WHEAT in English units in 1997.
SLOPE POSITION
SUMMIT SIDESLOPE TOESLOPE
SITE
& GRAIN STOVER GRAIN STOVER GRAIN STOVER
ROTATION NP* NP NP* NP NP* NP NP* NP NP* NP NP* NP
STERLING: --- Bu./A. --- --- lbs./A. --- --- Bu./A. --- --- lbs./A. --- --- Bu./A. --- lbs./A.
---WF 18 20 1634 1757 24 23 1950 1680 18 20 1795 2084
WCF 24 26 2097 2109 25 28 2053 2499 32 34 2852 2972
WCSF 26 25 2212 2196 25 31 2419 1566 39 35 3463 3153
NP* NP NP* NP NP* NP NP* NP NP* NP NP* NP
STRATTON: --- Bu./A. --- --- lbs./A. --- --- Bu./A. --- --- lbs./A. --- --- Bu./A. --- lbs./A.
---WF 16 19 2155 2162 9 15 1310 1802 14 20 3038 3319
WCF 25 23 3196 1790 19 20 2158 2835 32 36 5068 5428
WCSF 25 27 2537 2684 16 19 1699 2359 28 29 4867 4763
NP* NP NP* NP NP* NP NP* NP NP* NP NP* NP
WALSH: --- Bu./A. --- --- lbs./A. --- --- Bu./A. --- --- lbs./A. --- --- Bu./A. --- lbs./A.
---WF 33 34 3076 3036 46 43 4405 4010 45 49 4249 4527
WSF 48 42 4033 4163 48 36 4310 4328 45 43 4257 4141
WSSF 36 39 3414 3665 32 34 3124 3224 44 43 4498 4198
1. Wheat grain yield expressed at 12% moisture.
Table 4b. Grain, stover and total biomass yields for WHEAT in 1997.
SLOPE POSITION
SUMMIT SIDE TOE
SITE
& GRAIN STOVER TOTAL GRAIN STOVER TOTAL GRAIN STOVER TOTAL
ROTATION NP* NP NP* NP NP* NP NP* NP NP* NP NP* NP NP* NP NP* NP NP* NP
STERLING: ---Kg/ha--- ---Kg/ha---
---Kg/ha---WF 1183 1322 1830 1967 2871 3130 1614 1513 2183 1881 3603 3212 1234 1336 2010 2333 3096 3509 WCF 1626 1765 2349 2362 3780 3915 1668 1885 2299 2799 3767 4458 2158 2311 3194 3328 5093 5362 WCSF 1773 1664 2477 2459 4037 4623 1704 2066 2709 1753 4209 3571 2596 2359 3878 3531 6162 5607
NP* NP NP* NP NP* NP NP* NP NP* NP NP* NP NP* NP NP* NP NP* NP
STRATTON: ---Kg/ha--- ---Kg/ha---
---Kg/ha---WF 1058 1272 2413 2421 3344 3540 635 1035 1467 2018 2026 2929 913 1355 3402 3716 4205 4908 WCF 1684 1536 3579 2005 5061 3357 1271 1376 2416 3174 3534 4385 2145 2445 5675 6078 7563 8230 WCSF 1692 1843 2841 3006 4330 4628 1081 1252 1903 2642 2854 3744 1856 1929 5451 5334 7084 7032
NP* NP NP* NP NP* NP NP* NP NP* NP NP* NP NP* NP NP* NP NP* NP
WALSH: ---Kg/ha--- ---Kg/ha---
---Kg/ha---WF 2245 2316 3444 3400 3080 2911 4933 4490 7643 7052 3009 3317 4759 5069 7407 7988 WSF 3209 2791 4516 4661 3250 2441 4827 4847 7687 6995 3046 2917 4767 4638 7447 7205 WSSF 2451 2615 3823 4105 2144 2318 3498 3610 5385 5650 2968 2875 5036 4701 7648 7231
Table 5. Wheat yields at optimum fertility by year soil position at STERLING from 1986-1997.
YEAR SLOPE POSITION
SUMMIT SIDE TOE MEAN
--- Bu/A---1986 27 25 28 27 1987 22 15 25 21 1988 18 27 19 21 1989 36 38 46 40 1990 35 34 47 39 1991 31 29 41 34 1992 17 18 35 23 1993 41 38 52 44 1994 22 28 36 29 1995* 27 28 30 28 1996 53 53 66 57 1997* 26 30 35 30 MEAN 30 30 38 33
*Averages do not include wheat-fallow, which was infested with
downy brome.
Table 6. Wheat yields at optimum fertility by year and soil position at Stratton from 1986-1997.
YEAR SLOPE POSITION
SUMMIT SIDE TOE MEAN
---Bu/A---1986 32 29 23 28 1987 27 20 24 1988 38 43 49 43 1989 43 31 87 54 1990 48 53 72 58 1991 49 40 56 48 1992 29 29 31 30 1993 36 35 51 41 1994 37 35 51 41 1995 46 36 48 43 1996 40 35 62 46 1997* 25 20 31 25 MEAN 38 34 51 40
*Averages do not include wheat-fallow, which was infested with
Table 7. Wheat yields at optimum fertility by year and soil position at Walsh from 1986-1997.
YEAR SLOPE POSITION
SUMMIT SIDE TOE MEAN
Bu/A
-1986 No wheat produced this year
1987 34 32 48 38
1988 No wheat produced this year
1989 24 27 28 26 1990 24 28 32 28 1991 32 34 48 38 1992 25 39 53 39 1993 34 39 42 38 1994 33 37 44 38 1995 13 14 17 15 1996 0 0 0 0 1997 39 40 45 41 MEAN 26 29 36 30
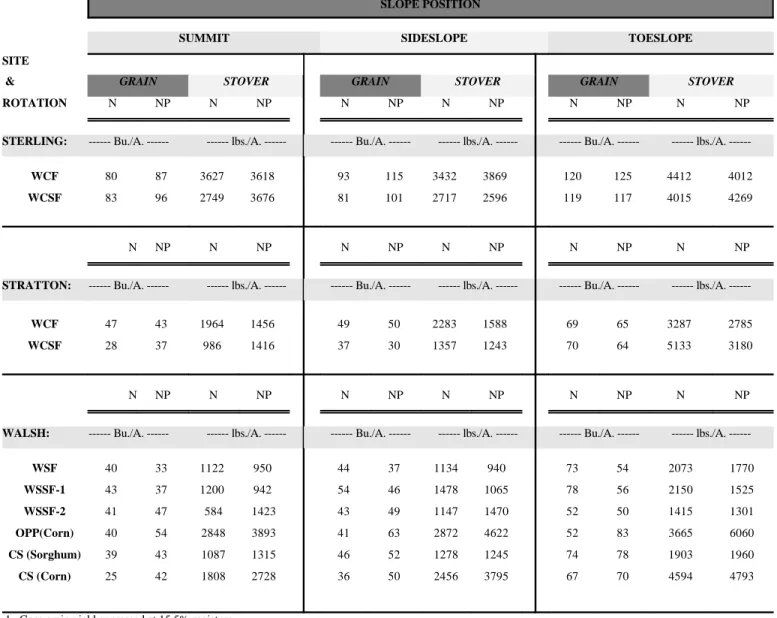
Table 8a. Grain and stover yields for CORN AND SORGHUM in English units in 1997.
SLOPE POSITION
SUMMIT SIDESLOPE TOESLOPE
SITE
& GRAIN STOVER GRAIN STOVER GRAIN STOVER
ROTATION N NP N NP N NP N NP N NP N NP
STERLING: --- Bu./A. --- --- lbs./A. --- --- Bu./A. --- --- lbs./A. --- --- Bu./A. --- lbs./A.
---WCF 80 87 3627 3618 93 115 3432 3869 120 125 4412 4012
WCSF 83 96 2749 3676 81 101 2717 2596 119 117 4015 4269
N NP N NP N NP N NP N NP N NP
STRATTON: --- Bu./A. --- --- lbs./A. --- --- Bu./A. --- --- lbs./A. --- --- Bu./A. --- lbs./A.
---WCF 47 43 1964 1456 49 50 2283 1588 69 65 3287 2785
WCSF 28 37 986 1416 37 30 1357 1243 70 64 5133 3180
N NP N NP N NP N NP N NP N NP
WALSH: --- Bu./A. --- --- lbs./A. --- --- Bu./A. --- --- lbs./A. --- --- Bu./A. --- lbs./A.
---WSF 40 33 1122 950 44 37 1134 940 73 54 2073 1770 WSSF-1 43 37 1200 942 54 46 1478 1065 78 56 2150 1525 WSSF-2 41 47 584 1423 43 49 1147 1470 52 50 1415 1301 OPP(Corn) 40 54 2848 3893 41 63 2872 4622 52 83 3665 6060 CS (Sorghum) 39 43 1087 1315 46 52 1278 1245 74 78 1903 1960 CS (Corn) 25 42 1808 2728 36 50 2456 3795 67 70 4594 4793
1. Corn grain yield expressed at 15.5% moisture. 2. Sorghum grain yield expressed at 14% moisture.
Table 8b. Grain, stover and total biomass yields for CORN and SORGHUM in 1997.
SLOPE POSITION
SUMMIT SIDE TOE
SITE
& GRAIN STOVER TOTAL GRAIN STOVER TOTAL GRAIN STOVER TOTAL
ROTATION N NP N NP N NP N NP N NP N NP N NP N NP N NP
STERLING: ---kg/ha--- ---kg/ha---
---kg/ha---WCF 4995 5453 3792 3782 8013 8390 5859 7201 3587 4045 8538 10130 7536 7860 4612 4193 10980 10835 WCSF 5191 6034 2873 3842 7259 8941 5094 6318 2840 2714 7144 8306 7480 7353 4197 4462 10518 10675
N NP N NP N NP N NP N NP N NP N NP N NP N NP
STRATTON: ---kg/ha--- ---kg/ha---
---kg/ha---WCF 2924 2728 2053 1522 4524 3827 3059 3165 2387 1660 4972 4334 4311 4076 3436 2911 7079 6355 WCSF 1728 2299 1031 1480 2491 3423 2308 1883 1418 1299 3368 2890 4382 4028 5366 3324 9069 6728
N NP N NP N NP N NP N NP N NP N NP N NP N NP
WALSH: ---kg/ha--- ---kg/ha---
---Kg/ha---WSF 2538 2091 3232 2675 5415 4473 2768 2322 3435 2858 5815 4855 4558 3367 5846 4552 9766 7448 WSSF-1 2698 2311 3451 2850 5771 4837 3357 2892 4268 3455 7155 5942 4909 3495 6179 4405 10401 3006 WSSF-2 2597 2965 2705 3879 4938 6429 2711 3084 3394 4075 5725 6727 3280 3124 4136 3934 6957 6621 OPP (Corn) 2519 3390 2977 4069 5143 6984 2553 3973 3002 4832 5198 8249 3240 5205 3831 6334 6617 10810 CS (Sorghum) 2432 2709 3115 3574 5207 5904 2863 3259 3664 3936 6126 6739 4612 4880 5713 5997 9679 10194 CS (Corn) 1542 2606 1890 2852 3216 5093 2272 3148 2567 3967 4521 6674 4176 4417 4802 5010 8393 8809
Table 9. Corn yields at optimum fertility by year and soil position at STERLING from 1986-1997.
YEAR SLOPE POSITION
SUMMIT SIDE TOE MEAN
---Bu/A-- ---1986 48 34 70 51 1987 47 59 70 59 1988 61 71 78 70 1989 52 74 102 76 1990 66 80 104 83 1991 55 69 105 76 1992 84 87 120 97 1993 43 50 70 54 1994 4 17 22 14 1995 10 12 29 17 1996 57 67 94 73 1997 92 108 120 107 MEAN 52 61 82 65
Table 10. Corn and sorghum yields at optimum fertility by year and soil position at STRATTON from 1986-1997.
YEAR SLOPE POSITION
SUMMIT SIDE TOE MEAN
-Bu/A ---1986 52 38 99 63 1987 30 34 51 38 1988 42 46 78 55 1989 21 15 24 20 MEAN 36 33 63 44
Corn replaced sorghum beginning in 1990
1990 54 54 88 65 1991 89 79 117 95 1992 82 76 111 90 1993 64 74 94 77 1994 48 34 68 50 1995 26 29 56 37 1996 106 101 128 112 1997 40 40 67 49 MEAN 64 61 91 72
Table 11. Rotation sorghum yields at optimum fertility by
year and soil position at Walsh from 1986-1997.
YEAR SLOPE POSITION
SUMMIT SIDE TOE MEAN
---Bu/A---1986 35 26 44 35 1987 29 31 20 27 1988 43 47 72 54 1989 18 28 85 44 1990 24 37 76 46 1991 33 49 64 49 1992 44 54 56 51 1993 50 54 56 53 1994 62 63 97 74 1995* 27 34 35 32 1996 25 30 38 31 1997 38 45 65 49 MEAN 36 42 59 45 *Average of WSF and WSSF-1.
Table 12. Continuous row crop yields at optimum fertility
by year and soil position at Walsh from 1986-1997.
YEAR SLOPE POSITION
SUMMIT SIDE TOE MEAN
---Bu/A---1986 35 26 44 35 1987 29 26 13 23 1988 39 21 66 42 1989 31 27 70 43 1990 44 33 47 41 1991 43 41 38 41 1992 42 48 49 46 1993 22 20 31 24 1994 24 20 21 22 1995 27 30 26 28 1996 18 21 22 20 1997 42 50 68 53 MEAN 33 30 41 35
Table 13a. Grain and stover yields for SUNFLOWER in English units in 1997.
SLOPE POSITION
SUMMIT SIDESLOPE TOESLOPE
SITE
& GRAIN STOVER GRAIN STOVER GRAIN STOVER
ROTATION N NP N NP N NP N NP N NP N NP
STERLING: ---lbs/A--- ---lbs/A---
---lbs/A---WCSF 1063 1317 1870 2317 1546 1410 2856 2605 1432 1724 2142 2578
N NP N NP N NP N NP N NP N NP
STRATTON: ---lbs/A--- ---lbs/A---
---lbs/A---WCSF 131 177 299 406 237 271 564 643 263 307 786 917
1. Sunflower grain yield expressed at 12 % moisture. * Only receives phosphorus in wheat phase of each rotation.