Scienpress Ltd, 2018
Climate Change: The Uncertain Future of Tigris
River Tributaries’ Basins
Nasrat Adamo1, Nadhir Al-Ansari1, Varoujan K. Sissakian2, Sven Knutsson1 and Jan Laue1
Abstract
Global warming is hitting all parts of the world for the last fifty years due to Global Climate Change and it is expected to continue in the future in an increasing trend unless the present mode of CO2 emission is limited or reversed. This is manifested in the rising temperature over land and the changes induced in the general weather circulation patterns over land and oceans. The Tigris River catchment as most of other parts in the world is suffering from increased temperatures and reduced precipitation contributing to reduced water resources elements all over it and reduction of the river stream flow itself. Studies using the soil and water assessment tool SWAT were performed on the five Tigris River tributaries basins in Iraq in order to assess these impacts. This paper summarizes the results of those studies, the characteristics of each of the five basins, and illustrates the application of SWAT as a tool for future predictions. Moreover, it explains in more details the work done on one of the basins as an example, summarizes the results of the five studies and then analyzes these results and discusses the expected future outcomes. The final conclusion which can be drawn is that severe shortage in all water resources elements will occur over the five basins and the Tigris River stream flow will suffer a considerable decline. This situation demands that policy makers in Iraq should take steps immediately to improve water and soil management practices to try and reduce as much as possible the expected damage that will hit all water using sectors.
Keywords: Climate Change, Global warming, CO2 emission, SWAT model.
1Lulea University of Technology, Lulea, Sweden 2
1 Introduction
The largest part of Iraq’s territory depends on the fresh waters of the Tigris and the Euphrates Rivers for its livelihood. These two rivers although do not originate within Iraq they flow through the whole country from the Turkish border, in the Tigris River’s case and from the Syrian border, in the Euphrates River case only to join in the south in their last reaches to form the Shat Al-Arab River, which empties in the Arabian Gulf about 200 kilometers from their confluence. The country has experienced in the last few decades clear manifestations of Global Warming as other regions of the world have done. In the Iraqi case; however, the country has witnessed erratic climatic conditions, which have resulted among other things in, droughts, desertification and severe sand storms, and a marked decrease of the two rivers natural flows. A recent paper by Adamo et al. (2018) has summarized some of the changes which have hit the watershed of the Tigris and Euphrates Rivers and were revealed by the many studies carried out in recent years. Some of these studies have traced these changes back to the wider frame of climate changes and variations that have prevailed lately in the North Atlantic zone and surrounding humid regions. These changes, in fact were caused partly by the changes on the North Atlantic Pressure Oscillations (NAO) which affects the atmospheric circulation. For sub-zones which are closely related to the North Atlantic Zone such as the Eastern Mediterranean and the Middle East (EMME) sub-zone, the aggregation of the rising temperature’s effects and changes to the general atmospheric circulation have brought severely negative results. Among these are reduced and erratic precipitation, increased evaporation and evapotranspiration and finally reduction
of the Euphrates and Tigris Rivers natural flow as an end result. In this paper, an endeavor is made to have a closer look on one part of the
Tigris River watershed, which covers the area extending from the Zagros Mountains ridge i.e. the border of the watershed, down to the river course itself encompassing the basins of the Tigris tributaries within the Iraqi territory. This is done by summarizing the modeling process followed by the same team on these five tributaries, Abbas et al. (2016 a, b, c, d, e), and presenting more details on one basin (Diyala River Basin) as an example. The studies utilized the Soil and Water Assessment Tool (SWAT) model in predicting the future changes to the water resources of the five tributaries which could result from the climate changes under different emission scenarios.
2 The Study Areas
Tigris River rises in the mountains of south eastern Anatolia in Turkey. It flows within rugged terrain and collects water from many tributaries until it enters the Iraqi territory at Fesh-Khabour. It continues afterwards in south easterly course
through Iraq, where in the southern part of the country it merges with the Euphrates River to form Shatt Al-Arab, which then flows to the Arabian (Persian) Gulf and empties there. The river has numerous tributaries within Iraq. Apart from Al-Adhaim tributary whose full catchment is within Iraq, the others originate from southern Turkey and northwestern part of Iran and they all merge into the Tigris River on its eastern side. The Tigris River has total length of 1,899 km, while the total area of its basin is 387,000 km2. This is shared unequally between the three riparian countries in which the river flows. In Turkey at the upstream reach where, 40% of the river flow is generated, the contributing catchment area is only 46,512 km2 (12%) which covers the catchment area of the main river and parts of the catchments areas of both of Khabour and Greater Zab Tributaries. In Iraq, in the downstream, the basin area is 209,304 km2 (54%) and it contributes (51%) of the water resources. The catchment area in Iraq includes the remaining catchments of the Khabour and Greater Zab tributaries, the complete catchment of Al-Adhaim tributary, part of the Lesser Zab and Diyala tributaries. While the northwestern region of Iran which comprising 131,784 km2 of the basin (34%) it contributes (9%) of the river flow through the tributaries: Lesser Zab River, and Diyala River (Kibaroglu, 2014). The Tigris River also runs along and forms the boundary between Turkey and Syria for 44 kilometers (Isaev et al., 2009 giving Syria a share in the basin of only 776 km2 (0.2%) which has no contribution to its water
resources. The Tigris and the Euphrates Rivers form the source of fresh water on which
Iraq’s livelihood is based. The mean annual flow of the Tigris amounts to 52 BCM
divided between the riparian countries in the percentages mentioned before. It is well known fact today that climate change which is brought about by the
global warming is hitting all parts of the planet earth. The resulting effects are varying in their form and magnitude from one region to the other depending on many factors like the location of the area with respect to oceans and seas, latitudes and longitudes, topographical nature of the region and the severity of changes induced in the general weather circulation systems around the particular region. It follows that for any particular region these factors should be taken together in studying the present trend of change and predicting the nature and amount of such change in some known period in the future.
For this study the region under consideration is the one containing the basins of the five Tigris River tributaries within the Iraqi territory which feed the river as they flow in southwesterly direction following the general slope of the terrain to meet the Tigris River at various locations. Taken in sequence they are; the Khabour tributary at the entry point of the Tigris River at Fesh- Khabor, the Greater Zab, the Lesser Zab, Al-Adhaim, and finally the Diyala tributary which
ends in the Tigris only 30 kilometers south of Baghdad city. Going from north to south the first basin is the Khabour tributary basin. This river
originates at the Uludere District in Turkey and emerges from a number of small rivers flowing off the Bolkar mountain range south-east of Hakkari. From there, it generally flows south, crossing the Turkish-Iraqi border before turning west
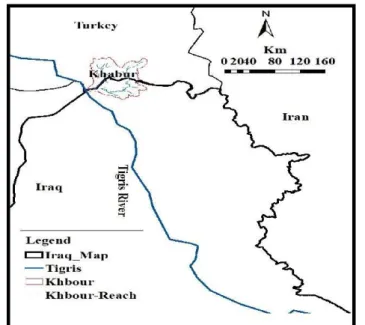
toward the Tigris. It passes through the Iraqi town of Zakho which is an important town on the river. Few kilometers west of Zakho, the river joins with its main tributary the Hezil Suyu (or Nizil River), and from there onward the Khabour River forms the border for around 20 km and flows to the Tigris River. The river basin area is 6,143 km2, out of this 57% is in Turkey and 43% is in Iraq. The total length of the river is 181 kilometres and runs in mountainous area. This tributary contributes about 2 BCM of water to the average annual flow of the Tigris River and the location of the river basin is shown in Figure (1).
Figure 1: Location of the Khabour River Basin (Abbas et al., 2016 a)
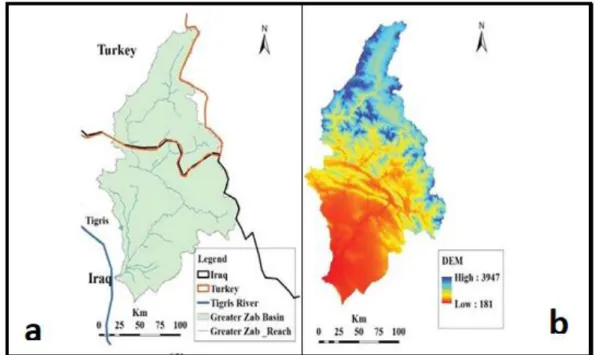
The second basin among the six tributaries basins is that of the Greater Zab River. This tributary drains an area of 26,473 km2 in Turkey and Iraq (Figure, 2a). The terrain is mountainous with elevation ranging from 220 m to 4000 m (a. s. l.) as can be seen from the results of the Digital Elevation Model (DEM) (Figure, 2b). The river has four tributaries; Shamdenan, Hagi Beg, Rawandooz and Khazer-Gomel rivers. The mean annual temperature over the basin area is 14º C and the mean annual precipitation is 570 mm ranging from 350 mm to 1000 mm, which mainly falls in winter and spring (48.9%) and it includes snow fall, 12.9% in autumn and only 0.57% in summer.
The length of the Great Zab River has been variously estimated at 392 kilometers (Kilot, 1994, Shahin, 2007) and 473 kilometers (Isaev et al., 2009). Approximately 300 kilometers of the river's course are located within Iraq (Kilot, 1994). The average annual discharge of the Greater Zab River is 419m3 /sec, but peak discharges of up to 1,320 m3 /sec have been recorded, and the average annual discharge is 13.2 BCM.
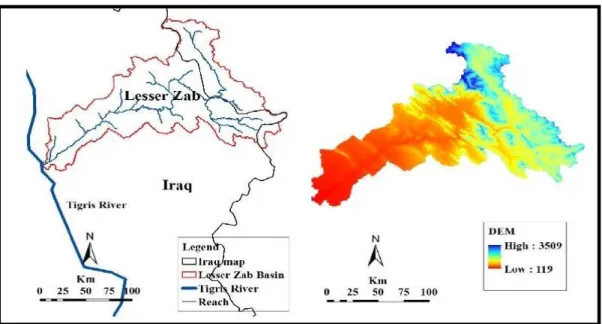
The third among the tributaries basins is that of Lesser Zab River, which has an area of 15,600 km2 and it is bordered by the Greater Zab River basin from the north and extends in Iran from the east. In the upstream of the basin, the river runs through deep valleys joined by a number of small streams such as the Banach and Qazlaga, and after a length of about 302 km, the river merges with the Tigris River at Al-Fatha (south of Mosul). Two dams are built on this tributary; the Dokan storage dam and the Debbis diversion dam. Figure (3) shows a location map of the basin and a DEM map of the area.
Figure 2: Greater Zab basin: (a) the location; (b) DEM (Abbas et al., 2016 b)
The next basin among the tributaries basins is Al-Adhaim River basin. which is located in northeast Iraq. The river rises from hilly and mountainous areas and drains about 13,000 km2 which lie totally in Iraq (Figure, 4). The river is fed by rainfall only; therefore, the occurrence of effective flow is during the wet season only. Al-Adhaim River generates about 0.79 BCM annually and it merges with the Tigris River at approximately 13 km downstream of the town called Balad. The length of the river from the source to the confluence is 230 km. The annual precipitation of Al-Adhaim basin ranges from (80 to 330) mm, and the temperatures vary over the basin between 2˚C and 48˚C. This river runs dry in summer from May to October and high flow occurs during November to May. Accordingly, Al-Adhaim River’s catchment area can be classified as an arid basin. Approximately, 7.1% of the basin is covered by forest, 29% by irrigated land and the remaining part is comprised of rain fed lands. Al Adhaim River itself is forms from merging of many perennial streams. First two of these streams i.e. Khasa Chai and Taouq Chai which outflow both in Wadi Zegheton. This later in its tern
meets with Duz Chai at some distance downstream to form Al Adhaim River. One large dam was constructed on the Al Adhaim River itself, another one on the Khasa Chi, and finally a low diversion weir was built just downstream of Al Adhaim dam; i.e.-Dhuloiya weir.
Figure 3:Location and boundaries of the Lesser Zab River basin and a DEM map (Abbas et al, 2016c)
Figure 4: Location of Al-Adhaim basin (Abbas et al., 2016 d)
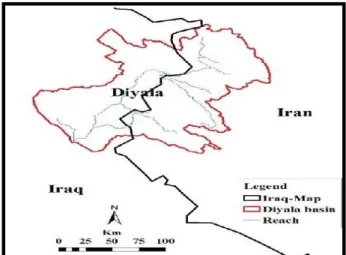
The last basin for this group of tributaries is the Diyala River basin (Figure 5). The surface area of this sub- basin is 32,600 km2 and it extends partly into Iran. The Diyala River has four main tributaries which are; Sirwan, Tanjeru, Diwana and Al-Wand rivers, in addition to other perennial streams such as Kifri Cha and Nareen Chai The total length of the river is 445 km and its confluence with the
Tigris River is at about 30 kilometers south of Baghdad. Two storage dams were built on the river within Iraq: these are Derbendikhan and Hemren dams in addition to a diversion weir, which is called Diyala Weir just below Hemren Dam by about 8 kilometers, in addition to one more dam on the Al-Wand tributary. The Diyala Weir is the headwork of an extensive irrigated fertile area, which extends south easterly until Baghdad.
Figure 5: Catchment area of the Diyala River, International border with Iran is shown (Abbas et al., 2016 e).
3 The Modeling Studies
In these studies, the model Soil and Water Assessment Tool (SWAT) was used to simulate the existing conditions over the basins one by one and to predict expected changes in the future. Abbas et al. (2016 a, b, c, d, e). This model is a river scale model developed to quantify the impact of land management practices in large and complex watersheds. It is a hydrological model with the following components: weather, surface runoff, return flow, percolation, evapotranspiration, transmission losses, pond and reservoir storage, crop growth and irrigation, groundwater flow, reach routing, nutrient and pesticide loading, and water transfer. SWAT can be considered as a watershed hydrological transport model, it uses a two-level disaggregation scheme. Preliminary sub- basin identification is carried out based on topographic criteria, followed by further discretization using land use and soil type considerations. Areas with the same soil type and land use form a Hydrologic Response Unit (HRU), a basic computational unit assumed to be homogeneous in hydrologic response to land cover. More can be learnt on this model from Neitsch et al. (2002). In establishing this model for the intended studies, six General Climate Models (GCMs) and three emission scenarios were used to get the climate change projections over each basin of the considered basins. A general circulation model (GCM) is a type of climate model which employs a
mathematical model of the general circulation of a planetary atmosphere or ocean. It uses the Navier–Stokes equations on a rotating sphere with thermodynamic terms for various energy sources.
The GCMs used in the studies were from CMIP3 and they were namely: CGCM3.1/ T47, CNRM-CM3, GFD- CM2.1, IPSLCM4, MIROC3.2, and MRI CGCM2.3.2. The CMIP3 itself is one phase of the Coupled Model Intercomparison Project established by the Working Group on Coupled Modeling under the World Climate Research Program (WCRD). The CMIP3 includes “realistic” scenarios for both past and present climate forcing based on data sets which provided much of the new material underlying the Intergovernmental Panel on Climate Change (IPCC) Fourth Assessment Report (AR4) (2007). As for the emission scenarios, the selected scenarios for these studies were A2 (high emission scenario), A1B (medium emission scenario) and B1 (low emission scenario). The full range of scenarios were formulated by IPCC Working Group III (2000) as illustrated in Figure (6) and described below:
The A1 scenarios are of a more integrated world. The A1 family of scenarios is
characterized by: Rapid economic growth, a global population that reaches 9 billion in 2050 and then gradually declines, the quick spread of new and efficient technologies, a convergent world - income and way of life converge between regions, extensive social and cultural interactions worldwide. There are subsets to the A1 family based on their technological emphasis: A1FI - An emphasis on fossil-fuels (Fossil Intensive), A1B - A balanced emphasis on all energy sources, A1T - Emphasis on non-fossil energy sources.
The A2 scenarios are of a more divided world. The A2 family of scenarios is
characterized by: A world of independently operating, self-reliant nations, continuously increasing population, regionally oriented economic development.
The B1 scenarios are of a more integrated world, and more ecologically friendly
The B1 family of scenarios are characterized by: Rapid economic growth as in A1, but with rapid changes towards a service and information economy, Population rising to 9 billion in 2050 and then declining as in A1, reductions in material intensity and the introduction of clean and resource efficient technologies, an emphasis on global solutions to economic, social and environmental stability.
The B2 scenarios are of a world more divided, but more ecologically friendly.
The B2 scenarios are characterized by: continuously increasing population, but at a slower rate than in A2. Emphasis on local rather than global solutions to economic, social and environmental stability, Intermediate levels of economic development, less rapid and more fragmented technological change than in A1 and B1.
Figure 6: Total global annual CO2 emission from all sources (energy, Industry, and land use) from
1990 to 2100 (in Gigatonnes of carbon per year) Gt C/ yr) for the families and four Scenario groups
In running the SWAT model for the basins under consideration, calibration and verification of this model had to be done first so that the outputs would be representative of actual conditions over these basins. The calibration processes are done to better parameterize the model to give set of local conditions, thereby reducing the prediction uncertainty by comparing model predictions (output) for a given set of assumed conditions with observed data for the same conditions. The final step is validation for the component of interest (stream flow, sediment yield…etc.). Model validation is the processes of demonstrating that a given site- specific model is capable of making sufficiently accurate simulations. It involves parameters that were determined during calibration process, and comparing the predictions to observed data that include wet, average, and dry years (Arnold et al., 2012). The Bias Corrected Spatial Downscaling (BCSD) method was used to downscale the GCNs results for implementing the model calibration for the particular basin under consideration.
All the GCMs used showed consistent increase in the temperature and decreases in the precipitation, and as expected, highest rates was under the high emission scenario (A2), and lowest rates was for (B2) scenario. The mean annual temperature and precipitation outputs from the six GCMs identified earlier were processed by SWAT for each basin under the three selected emission scenarios (A2, A1B, and B1) for the two future periods (2046 – 2064) and (2080 – 2100) and results were compared to the baseline period (1980 – 2010). Table (1) gives details of the calibration period, the validation period and the discharge station utilized in furnishing the stream flow data with the lengths of records for the five basins.
Table 1: Summary of calibration periods, validation periods and discharge stations data used in the application of SWAT model over the five basins
Basin Calibration Record Period Validation Record Period Discharge Station Remarks
Al-Khabour 1977- 1986 1987- 1999 Zakho The model was calibrated and validated on monthly scale Greater Zab 1979- 1996 1997- 2004 Bekhma
Bakerman Eski-Kelek The model was calibrated and validated on monthly scale Lesser Zab 1977- 1995 1977- 1984 1996- 2004 1985- 1987 Dokan Altun Kupri The model was calibrated and validated on monthly scale Al-Adhaim 1979- 1991 1992- 1997 Injana The model
was calibrated and validated on monthly scale Diyala 1979- 1996 1997- 2004 Derbndi- Khan The model was calibrated and validated on monthly scale
In this paper, the Diyala basin is selected to illustrate the projected changes in the mean annual temperature for the two future periods (2046 – 2064) and (2080 – 2100) relative baseline period (1980 – 2010) (Abbas et al., 2016 e). For the other basin mentioned in this paper reference must be done to Abbas et al. (2016 a,
Abbas et al (2016 b), Abbas et al (2016c), Abbas et al. (2016d). Using the calibrated model of the Diyala River basin, the annual precipitation,
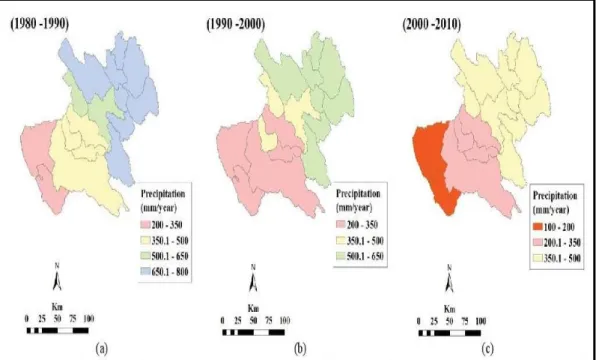
blue water (summation of water yield), green water storage (soil water content) and green water flow (evapotranspiration) were estimated during the last three decades to detect the effects of climate change on the water cycle components. Precipitation showed a general decline in the decades 1980 – 1990, 1990 – 2000 and 2000 – 2010 with a decreasing spatial trend from upstream to downstream and from east to west of the basin; as illustrated in Figure (7). This is because the northern and eastern parts of the basin are mountainous with high precipitation
and snowfall, while the southern and south western parts are relatively flat with less precipitation. Other water cycle components have also decreased as given in Table (2). Blue water and Green Water storage in the basin decreased from upstream to downstream following precipitation trend. Over the three decades the Blue water decreased by 29% in 1990s and 33% in 2000s relative to 1980s. Green water storage decreased by 18% and 30% in 1990s and 2000s decades respectively (Table, 2).
Figure 7: Spatial distribution of precipitation in the Diyala basin over three decades (a) 1980 – 1990; (b) 1990 – 2000; (c) 2000 –2010.
Mean annual temperatures outputs from the six GCMs, which were identified earlier, were processed under the three scenarios (A2, A1B, and B1). Table (3) captures the projected changes in mean annual temperature for the two future periods 2046 – 2064 and 2080 – 2100, relative to baseline period 1980 –2010. Figure (8) shows the predicted projections in the mean annual precipitation over the basin in the same future periods under the same scenarios.
Table 2: Relative changes in blue water, and Green water in the Diyala basin over three decades.
Rate of relative change in the last four decades
Water component 1990’s vs. 1980’s (-) % 2000’s vs. 1980’s (-) % 2000’s vs. 1980’s (-) % Blue water 29 33 52 Green Water Storage 18 14 30
Green water Flow 3 6 9
Table 3: GCMs predicted changes in the mean annual temperatures under (A2, A1B, B1) scenarios in Diyala basin
Scenario Period
Annual Changes (increase) in mean annual temperatures (° C)
General Circulation Models (GCMs) Used predicting changes to mean annual temperatures OGCM3.1/ T47 CNRM-C M3 GFDL-CM 2.1 PSLCM4 MIROC3.2 MRI CGCM2.3.2 A2 2046 – 2064 2.53 2 2.2 2.7 2 1.4 2080 – 2100 5.7 5.5 5.3 5.56 5.2 3.9 A1B 2046 – 2064 2.16 2.6 3 3.2 2.7 1.8 2080 – 2100 4.29 4.6 5 5 5 3.4 B1 2046 – 2064 1.7 1.7 1 1.4 1.5 1.4 2080 – 2100 1.9 1.7 1.2 1.7 1.7 1.2
4 Summary and Analysis of Results
The results of the five studies showed a general trend of increasing future temperatures over all Tigris River tributaries watershed areas in the southern Turkey, northwest of Iran and within Iraq itself. As clearly indicated in the performed studies, this is a direct consequence of global warming hitting the whole earth including this region. These results showed some variations under the six GCMs used in each basin, and the magnitudes of the increase in temperature differed according to the individual tributary basin which shows the effect of the geographic location and topographical conditions. Temperature rise also varied according to the emission scenario used as expected. Higher values were obtained under the high emission scenario A2, intermediate values for the intermediate emission scenario A1B and finally the lowest values under the lowest emission scenario B1. Projecting the results over two future periods extending to 2100, indicate that this rise in temperature continues steadily and no improvement will be witnessed unless actions are taken to limit and reduce the present emission patterns in the whole world.
Taken together the presented studies can be considered as a guide to the future upper and lower limits of the temperature rise over the whole watershed areas under consideration. The upper limits may be taken as the pessimistic case while the lower limits may be considered as the optimistic one. But, even looking at the optimistic case it shows a very bleak future with negative impacts on all water resources elements in the whole watershed area with an increased water stress in the area accompanied by drastic reduced flow of the Tigris River itself. The maximum values of temperatures increase obtained from SWAT applications for the six GCMs outputs are given for the two future periods 2046 – 2064 and 2080 – 2100. These values are tabulated for the five basins under the three emission scenarios and presented in Table (4) for illustration. Similarly, the resulting values of the decrease in precipitation over the five basins were obtained from SWAT applications and they are summarized in Table (5). The reductions are modified by the topographic differences between the five basins. These changes of topography were taken into consideration in the application of SWAT itself.
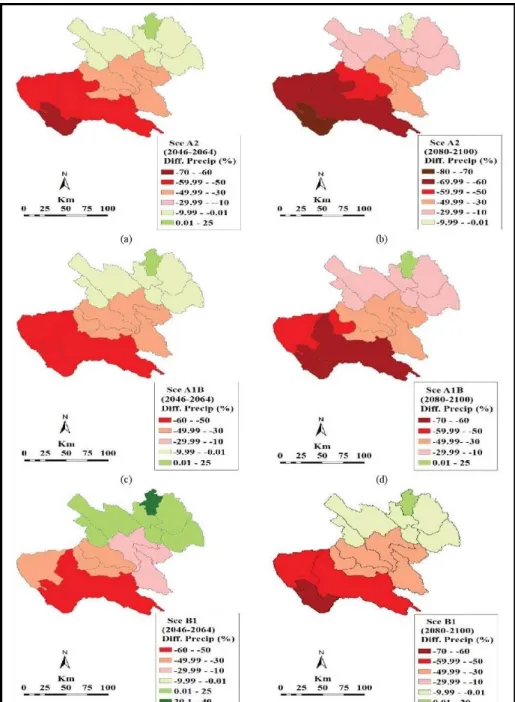
Figure 8: The impact of climate change on the precipitation of the Diyala basin: (a) anomaly based on the Scenario (A2) for the period 2046- 2064; (b) anomaly for (A2) to 2080- 2100; (c) anomaly for
A1B to 2046- 2064; (d) anomaly for A1B to2080- 2100; (e) anomaly for B1 to 2046- 2064; (f) anomaly for B1 to 2064- 2100.
The results showed smaller decrease of precipitation in the mountainous areas in the northeast and east of the Tigris River, while higher decrease is indicated in the hilly and flat parts of the basins which extends to the south and west directions in all the basins. Table (5) gives only the maximum point values of the decrease in precipitation and does not indicate the spatial distribution of this
decrease. In this paper and for clarification purpose one example is given only for the spatial distribution of precipitation reduction over these basins i.e. Diyala River basin, so the reader is advised to refer to the actual papers which are listed in the references list for more information on this subject. Table (9) is presented to show the order of magnitude of the maximum change in each basin in the described conditions.
Table 4: Summary of the maximum temperature increases for the six GCMs under the three selected emission scenarios in the Tigris River tributaries basins
Basin
Mean Annual Temperature Increase °C
Emission Scenario Future Periods 2046 – 2064 2080 – 2100 Khabour A2 + 2.8 + 5.3 A1B + 2.7 + 4.5 B1 + 1.5 +1.5 Greater Zab A2 + 3.2 + 5.6 A1B + 2.4 + 4.7 B1 + 1.7 + 1.7 Lesser Zab A2 + 3.4 + 5.2 A1B + 2.5 + 5 B1 + 2.7 + 3.8 Al- Adhaim A2 + 3.65 + 5.5 A1B + 2.9 + 4.8 B1 + 2.9 + 4 Diyala A2 + 2.7 +5.7 A1B + 3.2 + 5 B1 +1.7 + 1.9
Table5: Summary of the maximum precipitation increases for the six GCMs under the three selected emission scenarios in the Tigris River tributaries basins
Basin
Mean Annual Precipitation Decrease (- %)
Emission Scenario Future Periods 2046 – 2064 2080 –2100 Khabour A2 18 38 A1B 16 26 B1 7 15 Greater Zab A2 28 35 A1B 17 25 B1 14 15 Lesser Zab A2 30 38 A1B 32 30 B1 10 22 Al- Adhaim A2 26 37 A1B 14 25 B1 7 16 Diyala A2 26 40 A1B 21 32 B1 17 17
It may be mentioned however that the studies also indicated a small increase of precipitation in local and very limited mountainous areas in the northwest which do not contribute to any improvement to the general picture of the water resources elements. This is again attributed to the local modifications on the circulation patterns due to these mountains. It may be said as a final conclusion that the increased temperatures and reductions of precipitation will have negative impacts on water resources element in the form of increased evaporation, increased
evapotranspiration, reduced soil-water storage and decrease in ground water recharge. Major reduction on Tigris River stream flow will be inevitable, which will add up to the reduction that wills be suffered in the remaining parts of the watershed in Turkey.
5 Discussion and Conclusions
1. In all the carried out studies on the five basins of the River Tigris tributaries within Iraq the SWAT model proved to be a good tool to simulate past climate change and predict future once relative to a baseline period. Calibration and validation required using stream flow records from hydrological stations on the tributaries to validate the model itself. And this part was successful.
2. In predicting future climate impacts on the temperature and water resources this has required the selection of some GCMs to be used under the chosen emission scenarios. This part is subjective and the results depend to a large extent on the GCMs and selected Emission Scenarios which in turn depends on the choice of the researcher himself. The three Emission Scenarios chosen in these studies represent a wide range in the emission mechanism that gives rise to a wide range of variation in the predicted future temperatures and precipitation; which is seen clearly in the final presented results. Needless to say that a realistic emission scenario depends on the decisions taken by policy makers in the world and what actions are actually adopted over the coming years in reducing CO2 emission and reduction of fossil fuel use. It follows that the actual impacts on the study area may be somewhere within the limits indicated in the presented results in these studies.
3. Whatever course of action over CO2 emission is taken in the foreseen future the current trend of temperature is increasing all over the world which is accompanied by a disturbed pattern of precipitation distribution. In the Middle East Region the precipitation is decreasing all over the region; including the area under consideration. Studies show that this trend is not likely to reverse during this century and the area under consideration is going to suffer from severe shortage of water resources which will affect all cultivated lands, pasture areas and forests. Water resources will be deficient in the five studied basin whether this may be surface or ground water. The summarized results in this paper show this very clearly. This situation makes the adoption of new set of water management policies, introduction of changes to water use procedures, cultivation and crop production patterns mandatory; in order to limit the expected damage as much as possible.
4. Although SWAT has proved itself in a host of cases as a very accurate, good and versatile tool for predicting changes on water resources element over any
basin, whether such changes are induced by changing water or soil management practices or, may be caused by climate change. It may be a good practice to compare the outputs of SWAT by using another comparable simulation technique. In our case the results given by SWAT for the basins under consideration are so drastic and negative that it is worthwhile to repeat the studies using the Hydrologic Simulation Program- FORTRAN (HSPF) to verify or at least modify some of the indicated outputs.
5. In the five studies, all the presented results indicated that surface water and ground water will decrease drastically as a result of rising temperature, reduced precipitation, increased evapotranspiration and reduced ground water recharge. These studies failed however to carry this matter a step further to estimate the expected reduction in the stream flow of each tributary representing the artery to each of these basins. The total reduction of the stream flow of the five tributaries means the aggregate reduction in the Tigris River stream flow originating from these tributaries as it acts as the collector of them. This total reduction needs to be quantified in further studies to assess the additional damage which will be reflected in the middle and south of Iraq. This matter is very important since that the Tigris River will suffer from additional decrease in its flow before entering Iraq due to additional consumption of water in Turkey in addition to climate change there.
References
[1] Adamo , N., Al-Ansari, N.A.; Sissakian, V.; Knutsson, S. and Laue, J.,2018a, The Future of the Tigris and Euphrates Water Resources in view of Climate Change, in press.
[2] Kilot N. “Water Resources and Conflicts in the Middle East”. Routledge 1993 ISBN- 10: 0415097529, ISBN-13: 978-0415097529
[3] Shahin, M., 2007, Water Resources and Hydrometorology of the Arab Region, Springer, The Netherlands, Dordrecht. ISBN-13 978-1-4020-4577-6
[4] Isaev, V.A.; Mikhailova, M.V. (2009), "The hydrology, evolution, and hydrological regime of the mouth area of the Shatt al-Arab River", Water Resources, 36 (4): 380–395, doi:10.1134/S0097807809040022, ISSN 0097-8078
[5] Abbas N. Wassimia S, Al-Ansari N. 2016a. “Assessment of Climate Change Impacts on Water Resources of Khabour River in Kurdistan, Iraq using SWAT model”. Journal of Environmental Hydrology, Volume 24, P.10, October 2016
[6] Abbas N, Wassimia S, Al-Ansari N., 2016 b“Climate Change Impacts on Water Resources of Greater Zab River”. Journal of Civil Engineering and
[7] Abbas N, Wassimia S, Al-Ansari N., 2016 c. “Assessment of Climate Change Impacts on Water Resources of Lesser Zab. Kurdistan Iraq using SWAT model”. Scientific Research Publishing. Engineering 8, PP.697-715. 2016. [8] Abbas N, Wassimia S, Al-Ansari N., 2016 d “Impacts of Climate Change of
Al-Adhaim Iraq Using SWAT Model”. Scientific Research Publishing. Engineering, 8, PP.716-732. 2016.
[9] Abbas N, Wassimia S, Al-Ansari N., 2016 e “Impacts of Climate Change on Water Resources in Diyala River basin, Iraq”. Journal of Civil Engineering and Architecture. 10, PP 1059-1074.2016.
[10] Kibaroglu A. “Euphrates- Tigris River Basin Presentation”. HARC Publications 2014.
http://www.harcresearch.org/sites/default/files/Project_Documents/Euphrates -Tigris%20River%20Basin.pdf
[11] Neitsch S.L, Arnold J.G, Kiniry J.R, Williams J.R. King K.w “Soil and Water Assessment Tool Theoretical Documentation Version 2000”. Texas Water Resources Institute, College Station. Texas TWRI Report TR- 191. 2002 http://swat.tamu.edu/media/1290/swat2000theory.pdf
[12] IPCC, Fourth Assessment Report. “Climate Change 2007 Impacts, Adaptation, and Vulnerability”. Cambridge University Press, ISBN: 978 0521 88010-7 https://www.ipcc.ch/pdf/assessment-report/ar4/wg2/ar4_wg2_full_report.pdf [13] IPCC Working Group III. “Summary for Policy Makers - Emission Scenarios”.
2000 WHO- UNEP .ISBN: 92-9169-113-5
https://www.ipcc.ch/pdf/special-reports/spm/sres-en.pdf
[14] Arnold J.G, Moriasis D. N, Gassman M. J, Abbaspur K.C, White M.J, Srinivasan R, Harmel R.D, van Griensven A, Van Liew M.W, Kanan N, Jha M.K.“SWAT: Mode Use Calibration and Validation”. Transactions of the American Society of Agricultural and Biological Engineers, Vol. 55(4) 1491- 1508. 2012, ISSN; 2151- 0032