A Survey on Developers’ Preferences in
Integrated Development Environments
Bachelor Thesis in Computer science (DVA 331)
Mälardalen University
Academy of Innovation, Design and Engineering Author: Albert Bergström
Abm13007@student.mdh.se
Date: 2018-01-10 Examiner: Radu Dobrin Supervisor: Federico Ciccozzi
1
Abstract
Software development is a demanding task where developers face great challenges. Development tools are expected to be user-friendly. However, little research has been done to understand developers’ needs and priorities when it comes to such tools, so called Integrated Development Environments (IDEs). It is important to gain a better insight into developers’ prioritization of IDE qualities, in order to be able to make such tools more efficient and better tailored to their users’ real needs.
The objective of this thesis is to gain a deeper understanding of software developers’ perspective regarding IDEs with the goal of facilitating further improvements of these tools. This thesis report presents the results of a quantitative survey, responded by twenty professional software developers, which focuses on developers’ prioritization of qualities in adopted IDEs and their perceived satisfaction with the qualities themselves and the IDEs overall. Moreover, we investigate whether limiting developers’ choice of IDE also affects their overall satisfaction of chosen IDEs.
By analyzing the results, we conclude that developers perceive reliability, ease of use and efficiency as, on one hand the most important qualities of IDEs, and on the other hand those most in need of improvements. The results also suggest that developers’ satisfaction with their IDEs is not significantly affected by limiting their choice of development tools.
2
Table of contents
Abstract ... 1 Table of contents ... 2 1. Introduction ... 3 2. Background... 3 2.1. User experience ... 3 2.2. Developer experience ... 42.3. Motivation in software development ... 4
3. Related work ... 4 4. Problem formulation ... 5 5. Research method ... 5 6. Survey setup ... 7 6.1. Overall preparation ... 7 6.2. Questionnaire structure ... 7 6.3. Responses ... 8 7. Results ... 8 7.1. Demographic ... 8 7.2. IDE qualities ... 10
7.3. Satisfaction with IDE and needed improvements ... 11
7.4. Additional analysis ... 13
8. Discussion ... 14
8.1. RQ1 – What do software developers perceive as the most important qualities of an IDE and how do they prioritize them? ... 14
8.2. RQ2 – Does limiting developers’ choice of IDE affect their overall satisfaction with the IDE? ... 15
8.3. RQ3 – Which qualities of IDEs do software developers perceive as in need of improvements? ... 15 8.4. Limitations ... 15 9. Threats to validity ... 16 10. Conclusions ... 16 11. Future work ... 17 References ... 18 Appendix A. ... 19
3
1.
Introduction
An Integrated Development Environment (IDE) is a software application that offer programmers a place to write and edit their code, compile it into functional software and debug it to find unexpected behaviors. IDEs are essential for software developers, working in large as well as small development projects. Today, software developers have a wide selection of different IDEs to choose from when developing software. Some IDEs are free and open source like Eclipse [1] and Code::Blocks [2], while other are commercial and proprietary, like Microsoft Visual Studio [3].
In software engineering it is important that the user requirements are kept in mind throughout the development [4]. IDEs are the most important tools for developers, as most of their daily work is done through them. However, little research has been done to understand the needs of developers as users of software tools such as IDEs [5]. There is a lack of understanding of what developers require from their IDEs as users. This represents an issue since several studies [6] [7] have shown that the most significant factors for IDEs in software development are human related. This leads to the question: what makes a developer choose a specific IDE?
There can be many different factors to consider when deciding which IDE to use, such as license cost, range of supported languages, user-friendliness and capabilities for collaborative development. The purpose of this study is to map out the needs of developers as users and which IDE characteristics they prioritize to better understand how IDEs can be improved. Moreover, since developers are not always free to choose IDEs, we analyze how choice limitation can affect developers’ satisfaction with their IDEs.
The reason why it is important to increase the understanding of how developers perceive their IDEs is that it can make software development tools to be more user-oriented. A direct improvement of user experience (UX) for developers can consequently lead to improved productivity [8].
2.
Background
In this chapter, we will present some of the key concepts that will be discussed in this thesis. The concepts are explained briefly to help understanding the thesis work and the motivation behind it.
2.1. User experience
UX is a term that is meant to broadly describe everything that the user is going to experience with a software system, how it feels to use as well as how practical and functional it is. One of the first to introduce the term was Donald Norman in the 90's [9] and it has since become widely adopted by both researchers and practitioners. However, despite UX being widely addressed there is a lack of consensus on a precise definition and what it does and does not cover [10] [11]. What is generally agreed is that “UX is dynamic, context-dependent, and subjective. “[11].
4 There exists a model for describing UX called the hedonic-pragmatic model [12]. This model splits the UX of a product into two parts: hedonic and pragmatic attributes. Pragmatic attributes refer to the perceived usability of the product, how much the product can do and how easy it is to perform tasks. Hedonic attributes refer to the beauty of the product, how the product looks and how stimulating it is to use. The hedonic-pragmatic model will be used in this thesis to discuss the qualities of IDEs and the developers view on them.
2.2. Developer experience
Previous research on UX has mainly focused on consumers [13]. Developers are users of software themselves and as such, the previous research on UX should also apply to developer experience. However, developer experience is different from UX since it covers more than just the “use” of software. Developer experience is a relatively new concept and refers to how the developer perceives and feel about her own activities in the development environment, as defined by Fagerholm and Münch: “a means for capturing how developers think and feel about their activities within their working environments” [14]. With UX the perceived end goal is to use an application or service, while developers perceived end goal is to create an application or service. The concept of developer experience was introduced to better understand developers’ perceptions and feelings with the assumption that an improved developer experience would have a positive effect on the development itself. We will use the concept of developer experience to elaborate on the outcomes of our study.
2.3. Motivation in software development
There has been an increased interest in studying motivation among software developers over the last couple of years [15] [16]. In software development, human resources often constitute the biggest expenditure. Since human resources are such a big expense, companies expect efficiency from them. This makes human motivation a very important factor in the software industry, apart from employees’ wellness, for productivity and software development success rate. However, one of the problems with human motivation is that it is hard to quantify. Furthermore, despite an increase in number of studies on this specific subject, overall understanding of what motivates software developers has not changed much in the latest years [16]. Further studies are needed to more clearly define the relation between motivation and outcome, and this thesis is among them.
3.
Related work
Two notable survey studies have been performed by Kuusinen et al. by considering developers’ perception of their IDEs [5] [17]. In [17], Kuusinen surveyed software developer opinions related to one specific IDE, what they considered to be the best qualities of the IDE in question and how developers could be further supported by the IDE. The result of the study showed that some of the most desirable qualities of the IDE were “efficient to use, flexible, informative, intuitive, and reliable.” [17]. In [5], the authors focused on measuring developer’s immersion in their work with a specific IDE (the flow), the IDE’s ability to fulfill intrinsic motivation and developers’ experience with the IDE. The study measured how rewarding the work felt, how enjoyable and satisfying it was to perform tasks with the IDE. With this information, the study aimed to highlight how development tools could deliver a deeper, more focused developer experience. The study hypothesized that providing deeper immersion would increase productivity since the work would be more enjoyable.
A weakness of these studies is that they both only survey one specific IDE’s user base, which limits the generalizability of the results. In this thesis, we survey developers who use different
5 IDEs and aim to provide a more general result of developers’ perception, with the goal of understanding how IDEs could better support developers’ work.
4.
Problem formulation
The purpose of this thesis is to increase understanding of developers’ needs and perceptions as users of IDEs. The aim is to clarify what developers prioritize, which factors and features are the most important and which qualities need to be improved to deliver a better developer experience.
This study answers to the following research questions (RQs):
• RQ1: What do software developers perceive as the most important qualities of an IDE and how do they prioritize them?
• RQ2: Does limiting developers’ choice of IDE affect their overall satisfaction with the IDE?
• RQ3: Which qualities of their IDEs do software developers perceive as in need of improvements?
Improving the developer experience is beneficial for both developers and companies. With a better understanding of developers as users, development tools can be improved by making them more oriented to developers’ priorities and needs. Improved developer experience can lead to increased motivation and thereby better development results, as suggested in [8] and [15].
The expected outcome of this thesis is an increased understanding of the values that developers put on different qualities of an IDE based on the analysis of the survey results. The results will also offer insights on how limiting the choice of IDE can affect developer experience.
5.
Research method
The study was conducted as a quantitative survey following the guidelines given in [18] to collect the data needed to answer the research questions. The survey consisted of a questionnaire about adopted IDEs, the reasons for their adoption and the assignment of weights to a set of relevant IDE qualities. The research method performed in this thesis can be seen in Figure 1. As a first step, we performed a literature review as a basis for the research. Next, an initial questionnaire for conducting a pilot survey was defined building on the findings from the literature review. The questionnaire was first reviewed by an expert1. Then, after being improved according to the expert’s suggestions, the questionnaire was sent to three respondents for a pilot survey to assess the survey’s understandability, clarity, and relevance. Feedback from the pilot survey was used to improve the questionnaire which was then sent to software engineers in the industrial consortia PapyrusIC2 and Software Center3. Twenty complete answers to the questionnaire were gatheredand analyzed by the author. The results, synthesized and examined by the author, are presented and discussed in the remainder of this thesis.
1 The expert who reviewed the questionnaire for the pilot survey is a senior researcher with experience
in systematic empirical studies. 2 https://wiki.polarsys.org/Papyrus_IC 3 https://www.software-center.se/
6 Fig 1. Study process
Since this survey asks respondents about specifics that could be considered private or trade secret such as development tools used, practice or motivation behind choices, the results are described in a way that will not disclose any information that might trace back to the respondents.
7
6.
Survey setup
In this chapter, we describe the process of preparing the questionnaire and the tool used. Then, we describe how we designed the survey.
6.1. Overall preparation
The topic and questions to be answered by the survey were formulated based on the literature study (e.g., [5] [17]) and discussions with the thesis supervisor. After formulating a set of suitable questions, a preliminary questionnaire was prepared and sent to an expert who provided feedback in terms of missing IDE qualities and needed clarifications. After improving the questionnaire according to the feedback, a pilot survey was run with three of the participants. The feedback from the pilot survey suggested some improvements in the layout.
The survey was performed online using Google Forms4, a free survey tool provided by Google. The reasoning behind using Google Forms is that it is easy to setup, the questionnaire is accessible online and participants can reply directly through the web anonymously. Questions can easily be added or modified and the results are clearly presented and summarized.
The questionnaire is composed of 27 close-ended questions and 6 open-ended questions. We chose to mainly use ended question in the questionnaire for two reasons. Firstly, close-ended questions are more focused and in general easier to answer, making it more likely for the question to be answered. Secondly, close-ended questions are simpler to analyze and synthesize with little room for misinterpretation.
6.2. Questionnaire structure
The questionnaire consists of five parts5.
Part 1: Introduction. The questionnaire begins with a brief explanation about the survey study and its purpose. The participant is also informed about the ethical and societal considerations, asserting that we take the responsibility for all gathered data and that no information that can be linked back to the participants is disclosed.
Part 2: Demographics. The questionnaire asks a set of questions about the demographics of the participant such as: years of work experience in software development, the type of development work she usually performs, the size of the company she work for, her primary choice of IDE as well as any additional IDEs she uses. The open-ended question concerning the type of development work she usually performs is formulated as “What type of software products do
you develop (e.g. web application, control software, etc)?”. The questionnaire also asks whether
the choice of IDE was made by the participant or her employer, using the close-ended question
“Was the choice of IDE yours or your employer's?”. The rationality for the questions in this part
is to gain a better understanding of the participant and her background.
Part 3: IDE qualities. The questionnaire focuses on the participant’s preferences regarding IDE qualities through questions about the importance of qualities such as reliability, ease of use, versatility, stability and customizability. For close-ended questions, we use a five-point Likert scale (1-5) for rating their preference with the following labels (ordered from 1 to 5): “Not at all important”, “Not so important”, “Somewhat important”, “Very important” and “Extremely important”. In addition to the rating, the participant is also asked about her rationale behind the choice of IDE, which is formulated as the open-ended question “Describe shortly the reasons for
4https://www.google.com/intl/sv/forms/about/ 5The complete questionnaire is shown in Appendix A.
8
adopting it”. The rationality for the questions in this part is to gain a deeper understanding of
the participant’s priorities in terms of IDE qualities.
Part 4: Satisfaction with IDE and needed improvements. The questionnaire focuses on how satisfied the participants are with the IDE they use and choose to rate in the questionnaire. We use a five-point Likert scale (1-5) like the previous part for rating their satisfaction with different qualities pertaining to her IDE with the following labels (ordered from 1 to 5): “Very dissatisfied”, “Somewhat dissatisfied”, “Somewhat satisfied”, “Very satisfied” and “Completely satisfied”. The participant is asked to describe how satisfied she feels with the IDE overall using the close ended-question “How satisfied are you with your IDE overall?”, and what she feels needs improvements with the open-ended question “Are there any qualities that you feel needs improvement and
that weren’t mentioned?”. The rationality for the questions in this part is to gain a deeper
understanding of the participant’s satisfaction in terms of IDE qualities.
Part 5: Feedback The final part of the questionnaire asks the participant for feedback on the survey’s clarity and understandability with the open-ended question “Was something unclear or
poorly explained in the survey?”. The participant is also asked whether she agrees with the
motivation behind this study using the close-ended question “Do you agree with the motivation
behind this survey?”, which participant can choice to answer using labels (ordered from 1 to 5)
between “Completely disagree” and “Completely agree”. The rationality behind these questions is to acquire information surrounding IDE-research for future studies on this subject as well as assess the understandability of the questions included in this questionnaire.
6.3. Responses
After sending out the questionnaire to participants who had agreed to participate in the survey, the survey was run for three weeks. The questionnaire received twenty complete responses out of twenty-three invitations sent. The results from the survey were preliminarily presented in Google Forms and then transferred into Microsoft Excel for further processing and visualization.
7.
Results
This chapter presents the key results from the data that was gathered from the survey, analyzed and synthesized. Results are presented following the structure of the questionnaire (as described in Chapter 6.2).
7.1. Demographic
The participants of this survey are twenty software developers with at least one year of work experience in software development projects. Eleven of the participants have an experience of over seven years, while the remaining participants have on average four years of experience working professionally with software development. This means that we can assume that participants in this study have a great deal of experience working with IDEs in a professional environment. By having experienced users of IDEs as participants, we can be reasonably certain that the provided answers are not affected by inexperienced users.
Furthermore, the type of software developed by the participants have been divided into three categories: “systems”, referring to embedded systems and software, “tools”, referring to software tools developed to be used by other users, and “applications”, referring to other kinds of software applications.
9 The type of development work done by the participants varied, with eight of the participants (about 37%) working with software applications, six (about 27%) working on software systems and four (about 18%) focusing on software tools. The remaining four (about 18 %) did not specify the nature of their work, as seen in Figure 2.
Fig 2. Types of software developed by the participants
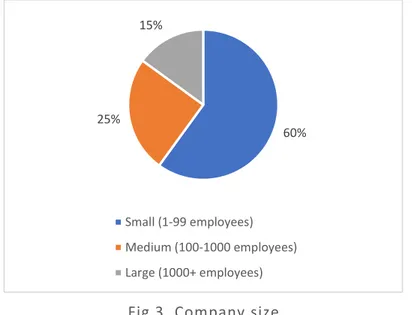
Regarding the size of the company the participants work at, twelve of the participants (about 60%) work in a small company (1-99 employees), five (about 25%) in a medium sized company (100-1000 employees), and three (about 15%) in a large company (1000+ employees).
Fig 3. Company size
Regarding the used and rated IDE, it is interesting to notice that only two primary IDEs were mentioned: Eclipse and Microsoft Visual Studio. Table 1 shows the result provided by participants. The amount of Eclipse users (14 of 20) were more than double the amount of Microsoft Visual Studio users (6 of 20).
In addition to the participants primary IDE, twelve participants also mentioned using other IDEs such as: IntelliJ, XCode, BBedit, PyCharm, Visual Studio Code, Rubus-ICE, Notepad++ and Atom.
18%
37% 27%
18%
Tools Applications System Not specified
60% 25% 15% Small (1-99 employees) Medium (100-1000 employees) Large (1000+ employees)
10
IDE Small Medium Large
Eclipse 12 1 1
Visual Studio 0 4 2
Table 1. Company size and IDE used
Every respondent that worked in a small company primarily used Eclipse (see Table 1). When asked about whether the choice of IDE had been made by the participant or the employer, thirteen participants (about 65%) answered that they had chosen their own IDE (see Table 2).
Choice of IDE Small Medium Large
Developer 7 3 3
Employer 5 2 0
Table 2. Company size and who made the choice
7.2. IDE qualities
In this part of the questionnaire, participants were asked to rate the importance of the following ten IDE qualities: reliability, ease of use, versatility, aesthetic design, efficiency, customizability, update rate, support for different operating systems, support for integration with other tools, support for collaborative development.
“Reliability” refers to the ability of an IDE to function correctly under an extended time without losing or altering files. “Ease of use” refers to how intuitive the IDE is to use and navigate without explanation. “Versatility” refers to the range of programming languages, additional components (plug-ins) and platforms supported by the IDE. “Aesthetic design” is the perceived appeal of the layout, icons and other visual elements of the IDE. “Efficiency” represents the speed of an IDE, as well as how efficient the IDE is to use (number of steps required to access different elements etc.). “Customizability” is the ease of customizing the IDE. “Update rate” refers to the frequency of software updates to an IDE. “Support for different operating systems” is the ability to use the IDE on different operating systems. “Support for integration with other tools” addresses the IDEs support for using different tools together with the IDE. “Support for collaborative development” refers to the tools and support that an IDE provides to ease sharing and participating in software development collaborative work with other users.
11 Fig 4. Average rating of importance of qualities
The highest rated quality of an IDE on average according to the participants was “reliability” (4,45 of 5), followed by “efficiency” and “ease of use”. On the other hand, “aesthetic design”, “update rate” and “support for collaborative development” were the least prioritized qualities. In addition to the rating, participants who had chosen their IDE themselves were also asked about the rationale for adopting it. Six out of the fourteen participants asked answered this question. Four, who chose Eclipse themselves, mentioned “customizability”, “versatility” and “reliability” as the primary reasons. The remaining two participants mentioned that they were somewhat limited in their choice of IDE due to the specific platform they were working with.
7.3. Satisfaction with IDE and needed improvements
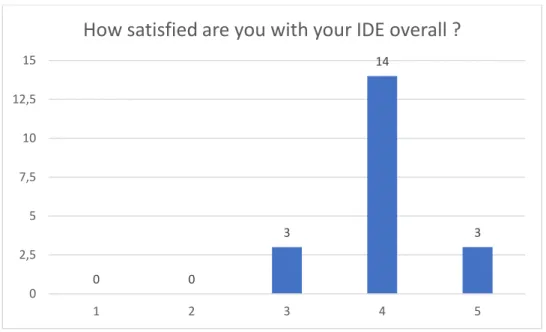
In this part of the questionnaire, participants were asked to rate their overall satisfaction with the chosen IDE. Figure 5 shows the distribution of the provided answers. The results are clear, with most participants (about 70%) being “very satisfied” about their IDE.
2,85 3,05 3,30 3,35 3,37 3,40 3,45 3,90 4,30 4,45 1 1,5 2 2,5 3 3,5 4 4,5 5 Aesthetic design Update rate Support for collaborative development Support for integration with other tools Support for different operating systems Versatility Customizability Ease of use Efficiency Reliability
12 Fig 5. Overall satisfaction with IDE
Additionally, the participants were asked to rate how well their IDE satisfied the ten IDE qualities mentioned before. Figure 6 shows a synthesized view on how satisfied participants were about the different qualities in their chosen IDE.
Fig 6. Average rating of satisfaction with IDE qualities
The most satisfactory quality overall according to the participants was “customizability” (4.11 of 5), followed by “support for different operating system” and “versatility”. On the other hand, qualities such as “ease of use”, “efficiency” and “aesthetic design” were perceived as least satisfactory. 0 0 3 14 3 0 2,5 5 7,5 10 12,5 15 1 2 3 4 5
How satisfied are you with your IDE overall ?
3,20 3,30 3,40 3,45 3,58 3,65 3,68 3,70 3,94 4,11 1 1,5 2 2,5 3 3,5 4 4,5 5 Ease of use Efficiency Aesthetic design Reliability Support for collaborative development Support for integration with other tools Update rate Versatility Supporting different operating systems Customizability
13
7.4. Additional analysis
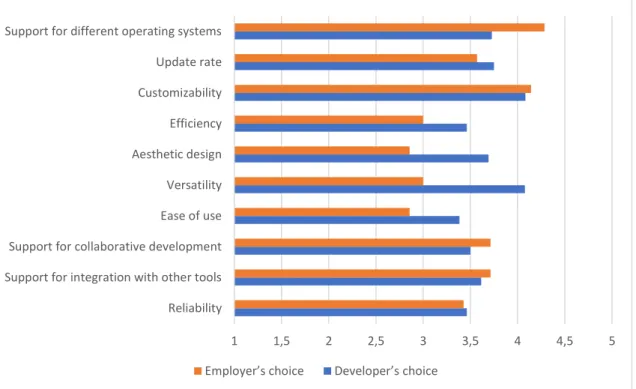
First, to better understand how developers are affected when they are limited in their choice of IDE, we analyzed the satisfaction between participants who could choose their IDE themselves and those who could not. The results did quite surprisingly not show any remarkable variation in overall satisfaction between the two groups. Moreover, the average ratings of satisfaction for each of the IDE qualities (see Figure 7) were very similar between the two groups too: participants who had chosen the IDE themselves rated their satisfaction with IDE qualities 6% higher than the other group on average. The only major differences were found when comparing “aesthetic design” and “versatility”, which participants who had chosen their IDE rated on average 29% and 36% higher than the other group, respectively.
Fig 7. Limitation of choice effect Vs overall satisfaction
Comparing between the two most popular IDEs in the survey (Eclipse and Microsoft Visual Studio) shows that users feel the same satisfaction in general towards their respective IDE. However, users of Eclipse rate their satisfaction with the “efficiency” on average 20% lower compared to those using Visual Studio. On the other hand, Eclipse users felt on average 40% more satisfied with the “support for different operating systems” compared to those using Visual Studio.
The survey results show that users of Eclipse and Visual Studio weigh the same IDE qualities in different ways. Eclipse users placed more importance on “support for collaborative development” (59% higher rating on average) and “integration with other tools” (37% higher rating on average). On the other hand, Visual Studio users felt that the “support for different operating systems” was more important than for Eclipse users. This result could be a consequence of the intrinsically low capability of Visual Studio in that specific matter. This is somewhat confirmed by the fact that Visual Studio users did not show high satisfaction with how the IDE provides that kind of support.
1 1,5 2 2,5 3 3,5 4 4,5 5
Reliability Support for integration with other tools Support for collaborative development Ease of use Versatility Aesthetic design Efficiency Customizability Update rate Support for different operating systems
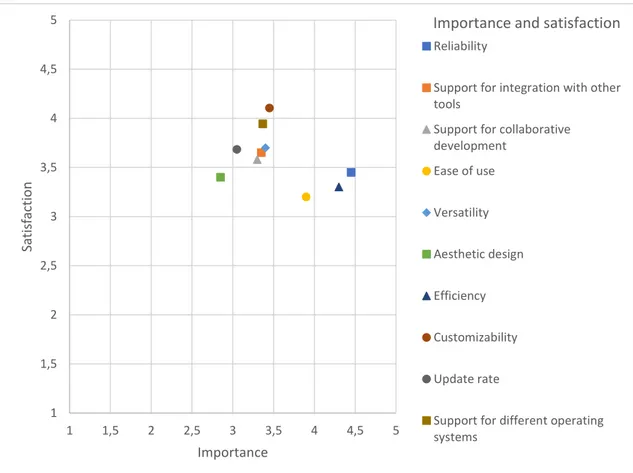
14 On the one hand, three of the highest prioritized qualities among all participants were “reliability”, “efficiency” and “ease of use”. On the other hand, most participants did not feel particularly satisfied with how their IDE satisfies these three qualities. Figure 8 graphically shows the difference between the participants’ prioritization and the perceived satisfaction of the qualities.
Fig 8. Comparing importance and satisfaction
8.
Discussion
In this chapter, we will discuss the study results, how they reflect on the initial problem formulation and answer our research questions, and the validity of the findings.
8.1. RQ1 – What do software developers perceive as the most important
qualities of an IDE and how do they prioritize them?
The result of this study showed that reliability, ease of use and efficiency were the most highly valued IDE qualities by software developers. This result mostly confirms the results of previous studies [5] [17]. However, one significant difference between the results from this study and the previous ones was the importance that developers placed on reliability. In both [5] and [17], reliability was rated second lowest among the best qualities of an IDE. This difference could be explained by the type of questions asked in the questionnaire. Both previous studies used open-ended questions in the questionnaire to survey the best IDE qualities. Differently, in our study we used primarily closed-ended questions. Since participants were asked to describe the best qualities rather than rate a set of predefined ones, it is possible that some qualities, such reliability, although highly valued by software developers, went lost in the answering phase.
1 1,5 2 2,5 3 3,5 4 4,5 5 1 1,5 2 2,5 3 3,5 4 4,5 5 Satis faction Importance
Importance and satisfaction
Reliability
Support for integration with other tools
Support for collaborative development Ease of use Versatility Aesthetic design Efficiency Customizability Update rate
Support for different operating systems
15 Anyhow, as any development tool should provide these qualities, it is not surprising that reliability, ease of use and efficiency are those mostly desired by professional software developers.
8.2. RQ2 – Does limiting developers’ choice of IDE affect their overall
satisfaction with the IDE?
Comparing the answers regarding satisfaction given by participants who could choose their IDE and those who could not, we noticed that limiting the choice of IDE does not affect the perceived satisfaction of the IDE itself. This can be motivated by a certain maturity that software development has achieved in the industry and the fact that software developing companies have well-established tool-sets, which often fit very good in the specific company ecosystem. However, since over 70% of the participants rated their overall IDE satisfaction with a 4, we individually examined the ratings given to each of the IDEs’ qualities to uncover possible hidden discrepancies not visible in the overall satisfaction. We noted that satisfaction regarding individual IDE qualities were also mostly unaffected by the limitation of choice. Therefore, with no clear difference in satisfaction due to limiting developers’ choice of IDE, we can conclude that developers’ satisfaction with their IDE is in general not affected by that limitation.
8.3. RQ3 – Which qualities of IDEs do software developers perceive as in
need of improvements?
As mentioned previously, software developers perceive ease of use, efficiency and reliability as the best qualities of IDEs. On the other hand, the results of this study show that software developers are less satisfied with ease of use, efficiency, aesthetic design and reliability offer by their IDE. Aesthetic design was perceived as among the least satisfactory qualities; however, aesthetic design was also the lowest prioritized quality. This result indicates that software developers are affected by the aesthetic design, but that they do not perceive it as something crucial for their work. This could be a consequence of the participants’ years of experience with the same IDE. By having a great number of years with work experience with a specific IDE, developers get used with the aesthetic design of the IDE and are not concerned about it, even though it could need improvements. Therefore, we can conclude that developers only perceive ease of use, efficiency and reliability as in most need of improvement.
Furthermore, as mentioned in [14], the end goal for developers is to develop software and not to use software; therefore, pragmatic qualities, such as efficiency and reliability, are more crucial for them than for ordinary software users, who might be more concerned with interface design and aesthetics. This stems from the fact that efficiency and reliability of IDEs can make development more productive.
8.4. Limitations
The participants seem very satisfied with their IDEs, where users of Visual Studio rated their overall satisfaction on average slightly higher than Eclipse users. The survey also allowed for the question to be answered in a scale from 1 to 5, and it is unlikely that the participants would feel completely satisfied in all aspects of their IDE with no room for improvement. On the other hand, an overall rating of 4 on a 1-5 scale shows very good satisfaction level with some room for improvement.
Amongst the survey responses, the ability to use the IDE on different operating systems had a very high standard deviation. One possible reason why there is such a big dispersion among the answers could be that this quality is very dependent on the individual needs of developers. The
16 quality is also binary in nature, since a IDE can either have support for different operating systems or not.
The survey could have been improved by using ranking questions. The results show that most participants tend to rate each quality as at least “very important” since it is common to think that most qualities are necessary, but only a few could be considered “extremely important”. As a result, most qualities were valued similarly with only a few deviations. This trend could have been mitigated by structuring the questionnaire in a way that the potential differences could have been more evident. For instance, instead of asking the participants to rate each quality from “not at all important” to “extremely important”, the participants could have ranked the qualities from lowest priority to highest. By asking the participants to place each quality in order after their priorities, they would have been required to reflect more on how they prioritize qualities, thus making answers better reflect their actual thoughts.
9.
Threats to validity
Regarding internal validity, the only method used for gathering data was the online questionnaire. This method was chosen as it allowed potential participants to be contacted by email and then answer anonymously at any time. However, since the questionnaire was performed online and anonymously, follow-up questions and clarification on the given answers given were not possible. Because of this, it is possible that the participants could misunderstand the content of the questionnaire or that we did not have sufficient insight in thedevelopers’ perspectives to formulate relevant questions. To mitigate this risk, we first performed a literature review to better understand developers’ needs. Then, we made an external reviewer review the questionnaire and then run a pilot survey with three participants. When running the actual survey, participants were provided with a short explanation of each quality in the questionnaire to minimize misinterpretation. Additionally, the questionnaire ended with two open-ended questions. The first question asked if the participant found any unclear or poorly explained part, while the second question asked for comments on the questionnaire and on the survey topic. Examining the replies to those questions, we can be confident in the internal validity of the study.
Regarding external validity, the survey received responses from twenty participants, which, although significant, is not extensive enough to completely generalize the obtained results. A larger population and data set would have allowed for more data on additional comparisons of various aspects such as company size, years of experience and different kinds of development projects. For instance, with most participants working for small companies, it is hard to make any deep comparison between developers from different sized companies with statistical significance. We mitigated this threat by focusing on the universal inclinations across the entire data set rather than focusing on narrow comparisons.
10.
Conclusions
This thesis performed a survey on developers’ preferences in IDEs. The perspective presented in the results was gathered from software developers with an average of eight years of work experience in software development. Our main goal was to give a better understanding on how software developers perceive their IDEs. Such an understanding could be useful to facilitate further improvements of software development tools (IDEs), in order to make them better support the needs and priorities of software developers.
17 The results from the survey show that software developers place reliability, ease of use and efficiency as the most important qualities in an IDE. We performed an analysis on the data set to find out whether limiting developers’ choice of IDE has any effect on their overall satisfaction with the IDE. Once it could be reasonable to expect that software developers would feel less satisfied with an IDE that they did not choose themselves, the analysis results did not show any relevant deviation in satisfaction level between them and those developers who could choose their IDE themselves.
Lastly, we compared how developers prioritize and perceive each IDE quality to better understand which ones need improvements. We found out that developers perceived reliability, ease of use and efficiency as not satisfactory enough, while simultaneously being the most important qualities for them. That is to say, reliability, ease of use and efficiency are IDE qualities in need of improvement.
11.
Future work
One of the limitations of this study was the used rating system. By allowing each quality to be rated the same, participants were not required to carefully consider their priorities. An interesting addition to this study would be to propose open-ended questions about the qualities and ask participants to rank the qualities in order from most to least important. Moreover, the participants of this study mainly used one out of two IDEs (i.e., Microsoft Visual Studio and Eclipse), since we did not actively define any specific strategy for selecting the target population. Future studies could focus on targeting a more heterogeneous population leading to a more comprehensive survey with a greater diversity when it comes to rated IDEs; it would help in providing more generalizable results.
This study aimed to offer insights in the view that software developers have in general towards their development tools. Future work could explore developer experience in specific types of software development projects. For instance, the motivation and priorities behind mobile application developers’ choice of tools and whether there are any differences with developers of desktop applications. Another direction could be studying how developers perceive hedonic qualities compared to pragmatic qualities in their software development tools and how the different qualities affect the developer. Since developers have the goal of developing software rather than just using software, it could be assumed that developers would prioritize pragmatic qualities over hedonic. Indeed, aesthetic design was shown to be the lowest prioritized quality in our study. However, our questionnaire primarily focused on pragmatic qualities and as such, several different aspects are open for possible future exploration and investigation.
18
References
[1] E. Foundation, "Eclipse Oxygen", Eclipse.org, 2018. [Online]. Available: http://www.eclipse.org/. [Accessed: 04- Jan- 2018].
[2] "Code::Blocks", Codeblocks.org, 2018. [Online]. Available: http://www.codeblocks.org/. [Accessed: 04- Jan- 2018].
[3] D. Stroud, "Visual Studio IDE, Code Editor, VSTS, & App Center", Visual Studio, 2018. [Online]. Available: https://www.visualstudio.com/. [Accessed: 04- Jan- 2018].
[4] I. Sommerville, Software engineering. Boston: Addison-Wesley, 2011.
[5] K. Kuusinen, H. Petrie, F. Fagerholm and T. Mikkonen, "Flow, Intrinsic Motivation, and Developer Experience in Software Engineering", Agile Processes, in Software Engineering, and Extreme Programming, pp. 104-117, 2016.
[6] T. DeMarco and T. Lister, “Programmer performance and the effects of the workplace,” in Proceedings of the 8th international conference on Software engineering, ser. ICSE ’85. Los Alamitos, CA, USA: IEEE Computer Society Press, 1985, pp. 268–272.
[7] A. Mockus, “Organizational volatility and its effects on software defects,” in Proceedings of the eighteenth ACM SIGSOFT international symposium on Foundations of software engineering, ser. FSE ’10. New York, NY, USA: ACM, 2010, pp. 117–126
[8] D. Graziotin, X. Wang and P. Abrahamsson, "Happy software developers solve problems better: psychological measurements in empirical software engineering", PeerJ, vol. 2, p. e289, 2014.
[9] D. Norman, J. Miller and A. Henderson, "What you see, some of what's in the future, and how we go about doing it", Conference companion on Human factors in computing systems - CHI '95, 1995. [10] C. Lallemand, G. Gronier and V. Koenig, "User experience: A concept without consensus? Exploring
practitioners’ perspectives through an international survey", Computers in Human Behavior, vol. 43, pp. 35-48, 2015.
[11] E. Law, V. Roto, M. Hassenzahl, A. Vermeeren and J. Kort, "Understanding, scoping and defining user experience", Proceedings of the 27th international conference on Human factors in computing systems - CHI 09, 2009.
[12] M. Hassenzahl, "The Interplay of Beauty, Goodness, and Usability in Interactive Products", Human-Computer Interaction, vol. 19, no. 4, pp. 319-349, 2004.
[13] S. Diefenbach, N. Kolb and M. Hassenzahl, "The 'hedonic' in human-computer interaction", Proceedings of the 2014 conference on Designing interactive systems - DIS '14, 2014. [14] F. Fagerholm and J. Munch, "Developer experience: Concept and definition", 2012 International
Conference on Software and System Process (ICSSP), 2012.
[15] S. Beecham, N. Baddoo, T. Hall, H. Robinson and H. Sharp, "Motivation in Software Engineering: A systematic literature review", Information and Software Technology, vol. 50, no. 9-10, pp. 860-878, 2008.
[16] A. Franca, T. Gouveia, P. Santos, C. Santana and F. da Silva, "Motivation in software engineering: a systematic review update", 15th Annual Conference on Evaluation & Assessment in Software Engineering (EASE 2011), 2011.
[17] K. Kuusinen, "Software Developers as Users: Developer Experience of a Cross-Platform Integrated Development Environment", Product-Focused Software Process Improvement, pp. 546-552, 2015. [18] C. Wohlin, Experimentation in software engineering. Boston [u.a.]: Kluwer, 2002.
19
Appendix A.
This appendix contains the complete questionnaire used for the survey.
20 Part 2: Demographics
21 Part 3: IDE qualities (1/2)
22 Part 3: IDE qualities (page 2/2)
23 Part 4: Satisfaction with IDE and needed improvements
24 Part 5: Feedback