Destination Branding and
Demand
Formulating Expectations Through Perceptions
Master thesis within ECONOMICS and MANAGEMENT
Author: Chen-Yu Liu
Jessica Virta
Tutor: Daniel Wiberg
Master Thesis within Economics and Management of
Arts and Entertainment Industries
Title: Branding and Demand:
Formulating Expectations Through Perception
Author: Chen-Yu Liu
Jessica Virta
Tutor: Daniel Wiberg, PhD
Johanna Palmberg, PhD candidate in Economics
Date: June 2010
Subject terms: City branding, Expectations, Experience, Jönköping, Las Vegas
Abstract
This paper looks at the perceptions of people within and outside of Jönköping, regard-ing the main attractions/attributes within the Jönköpregard-ing region and how they are beregard-ing branded by the municipality. A model was formed to explain how consumer expecta-tions affect demand, and based on that a survey was handed out to find out consumers travelling habits, general perceptions about Jönköping and its branding. The results show that promotion has not been as successful as hoped and that Jönköping is still seen as a religious city among the respondents. A Las Vegas Entertainment Concept was formed to find out whether people would be willing to visit Jönköping more often if something „new‟ was presented. In conclusion, for consumers to visit more often new experiences have to be provided. It is all about the way Jönköping city is marketed in the future and what it will be able to offer to the different consumer segments visiting.
Table of Contents
1
Introduction ... 1
2
City Backgrounds ... 3
2.1 Jönköping ... 3 2.2 Las Vegas ... 53
Theoretical Framework ... 8
3.1 Destination Branding ... 83.2 Supply of Experience Goods ... 10
3.3 Demand of Experience Goods ... 10
3.3.1 Demand and Expectations ... 11
3.3.2 Demand and Constraints ... 12
4
Empirical Studies: Methodology ... 15
4.1 Model Description ... 15
4.2 Research Questions ... 17
4.3 Survey Design ... 17
4.4 Data Collecting Method ... 18
5
Empirical Findings and Discussion ... 19
5.1 Sample Description Travelling Preferences ... 19
5.2 Travelling Preferences ... 19
5.3 The Perception of Jönköping ... 21
5.4 Las Vegas Entertainment Concept ... 25
6
Conclusion ... 28
Figures
Figure 2-1 Access Scandinavia (Photo Source: Jönköping Airport, 2010;
adjusted from Mellander, 2006) ... 3
Figure 2-2 Access Las Vegas (Source: Coutsoukis, 2000) ... 6
Figure 4-1 Consumer’s demand and expectation model, based on Middleton and Clarke (2001, p.77) ... 16
Figure 5-1 Main purpose(s) for travelling ... 20
Figure 5-2 Main purpose(s) of travelling in Sweden (Source: Nutek, 2007) . 20 Figure 5-3 Ideal vacation types ... 21
Figure 5-4 Distribution of respondent’s first three perceptions about Jönköping ... 21
Figure 5-5 Distribution of preferred Las Vegas Entertainment Concept factors26
Tables
Table 2-1 Consumer’s traveling habits within different regions in Sweden for leisure purposes ... 4Table 3-1 The four destination product dimensions from supplier’s point of view ... 9
Table 3-2 Percentage of recreation consumption (arts and entertainment) to total expenditures in developed market economies in 1975 and 200213 Table 5-1 Age distribution ... 19
Table 5-2 Ideal Region for leisure in Sweden; based on 131 respondents .. 19
Table 5-3 Level of recognition concerning Jönköping’s branding factors from a scale of 1-4 ... 22
Table 5-4 Percentage of respondents associating religious with willingness to visit Jönköping ... 23
Table 5-5 Awareness of existing attractions ... 23
Table 5-6 Interest in packaged deals ... 24
Table 5-7 Social media where information regarding Jönköping has been seen ... 25
Table 5-8 Successfulness of Jönköping Promotion ... 25
Table 5-9 Significance of Pearson Chi-square Correlation between demographic factors and willingness to see and pay for Las Vegas Entertainment Concept ... 26
Table 5-10 Percentage distribution between place of residence and top five Las Vegas Entertainment Concept attributes ... 27
Appendixes
Appendix 1 The stimulus response model for buyer behaviour (Middleton and Clarke, 2001, pg.77) ... 32Appendix 2 The basis for the 12 branding factors chosen ... 33
Appendix 3 Questionnaire ... 34
Appendix 4 First three perceptions when thinking of Jönköping (full list) ... 38
Appendix 5 Significance of Pearson Chi-square Correlation between possibility of becoming most attractive Scandinavian town centre and branding factors perception level ... 39
Appendix 6 Significance of Pearson Chi-square Correlation of demographic
factors and preference regarding package deals ... 40
Appendix 7 Significance of Pearson Chi-square Correlation of gender, age,
place of residence with social media usage in obtaining information regarding Jönköping ... 41
Appendix 8 Distribution of age and willingness to see and pay for the Las
Vegas Entertainment Concept (percentages shown indicate the percentage of the total sample within that age group) ... 42
1
Introduction
In the summer, as students leave, Jönköping city faces the problem of “quietens down”. Students are returning to their home cities and many locals leave for the summer holi-days. Tourism could be the answer for increasing revenues during the summers and throughout the year. In return, one has to ask what could be done to sustain the amount of local consumers and increase the amount of visitors instead of focusing on why sumers are leaving. The purpose of this paper is to find out how expectations affect con-sumer‟s demand on travelling to Jönköping and how city branding can be linked to this demand and expected city revenues. The aim is to understand the factors which people most associate Jönköping with and how those can be enhanced through methods of branding.
This paper focuses on finding a solution which best suits Jönköping to sustain a con-stant amount of people visiting throughout the year, with or without the help of students being present. In order to build an accurate model questionnaires were handed out to three different sample groups, consisting of 131 respondents in total, to find out which kinds of factors affect the tourism in Jönköping.
The paper will also look at the major threats which Jönköping city faces, including the main competitors, such as other holiday destinations, and how consumer‟s travelling preferences and expectations affect their decision making whether to travel to Jönköping or not. In order to determine how Jönköping municipality markets the city it was necessary to take a look at the factors which were mentioned in different guides and the city‟s own website.
This study compares the different factors which influence the branding of Jönköping. HV71, the local ice hockey team, for example, can be assumed to bring in cash flow due to people coming from outside and perhaps spending more time in the city instead of just going to the game itself; it may also attract new financial investors. Jönköping pos-sesses several different public goods which can be experienced at different prices. This implies, that when branding Jönköping, one should consider which tourists to attract and how to attract them; whether it is consumers with high incomes and interested in high cultural arts, or students interested in broadening their horizons with a lower budget. There are two main types of visitors who come to Jönköping: The „newcomers‟ and those who have already been there before. According to Grönroos (2007) the visi-tors‟ experiences are important, however, it could be assumed that fulfilled expectations and attitudes determine whether the consumer will come back or not. In other words, if expectations are not fully met, it is more likely that the consumer will not want to re-turn. This could lead to a decrease in future returns in terms of tourism.
Hovaljec (2003, p.130) mentions tourism as being „the most important industry in the world in terms of numbers of employees and its effect on the social and economical de-velopment of a region or country‟. Tourism is important not only due to economic ad-vantages it brings, but also due to creating new demands in the future. With companies, the idea of „innovate or die‟ has been a concept surrounding them since the industrial revolution (Hall and Williams, 2008, p. 24). One should not only limit the idea to com-panies, but also cities. Without the city planners will and ability to innovate and create new demands, it may begin to parish and eventually „die‟.
Therefore, the respondents were also questioned whether there is room for new demand in the entertainment industry within the Swedish market. Las Vegas has been chosen as a supportive example for creating new demand in Jönköping. The city keeps on expand-ing and evolvexpand-ing through new technology and is available to offer new forms of enter-tainment which, in return, has increased its revenues. Las Vegas has been viewed as one of the biggest tourist destinations in the world (Firat, 2001). Due to that, it was tested whether some of the ideas which make Las Vegas what it is today, could be imple-mented in Jönköping.
The paper has been divided into six sections. Section two focuses on the background of the two cities discussed in this paper: Jönköping and Las Vegas. The following section discusses the theoretical background for the thesis. Section four begins by presenting a constructed model of consumer demand and expectations, and to support it, quantitative research was carried out by surveying 131 respondents. The fifth section looks at how consumers perceive Jönköping and which Las Vegas entertainment factors were rele-vant and the last section discusses the conclusions of the study as a whole.
2
City Backgrounds
This following section looks at the two main cities discussed in the paper: Jönköping being the main focus of the study and examples taken from Las Vegas being the main focus on forming new demand within Sweden, preferably in Jönköping.
2.1
Jönköping
Jönköping is one of the oldest cities in Sweden. Being surrounded by water and natural beauty, Jönköping city marketers have always seen it as one of its great strengths com-paring to other cities in Sweden. Throughout time, Jönköping has been associated with religiousness and is known as „Småland‟s Jerusalem‟ (Larsson and Wahlqvist, 2006). In 1971 Jönköping was combined together with Huskvarna and Gränna, including Norra-hammar, seven rural districts and one parish, to become the „modern municipality of Jönköping‟. Together with these towns, Jönköping was culturally enriched. Gränna be-ing known for its sweets, „polkagris‟ and Huskvarna for Husqvarna AB, when again Norrahammar and the smaller districts strengthened the vision of Jönköping as an in-dustrial city (Jönköping Municipality, 2009b). At the end of 2009 the population of Jönköping was 126,331. The county itself included of 336,044 inhabitants, which makes it the 6th largest county in Sweden (Statistics Sweden, 2010).
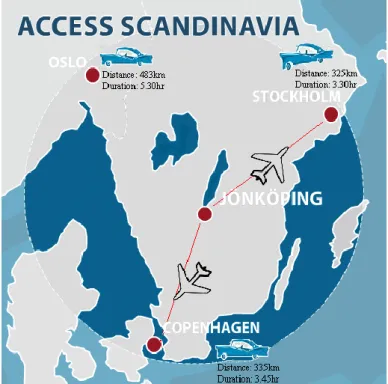
Figure 2-1 Access Scandinavia (Photo Source: Jönköping Airport, 2010; adjusted from Mellander, 2006) Jönköping city is situated in southern Sweden, at the South coast of Lake Vättern, and is part of Småland‟s province. From the Scandinavian capitals, Jönköping can be seen as situated in the centre of them. As can be seen from Figure 2-1, Copenhagen is less than a 4 hour drive away, while Stockholm is about 3½ hours away, along the E4 highway. Flights are available daily to these destinations from Jönköping Airport, Axamo. Oslo is at a longer distance, but accessible by car, bus or train. According to Prideaux (2000) accessibility is crucial for the development of a destination in terms of tourism. The bet-ter the mobility possibilities, the easier it is for the consumer to visit.
As the new „Destination Jönköping‟1
carried out by the city planners, has gotten to the implementation stage, changes have started to take place. By improving the city attrac-tiveness and city structure Jönköping has enabled itself to compete for the title of „most attractive city centre in Scandinavia‟(Olow, N.A). In order to achieve this Stads-byggnadsvision 2.02 was developed to improve the city image and infrastructure. At the time, Smålands Teater och Music hall is being built by Munksjön, and should be ready in 2011. It is meant to act as a national Landmark for Jönköping and will hopefully in-volve more and more people in and outside the community, and eventually increase the amount of visitors throughout the year (Sundin, 2010).
According to research carried out by Mellander (2006) to find out Jönköping‟s status concerning tourism in Sweden, when it comes to leisure, Gothenburg is the most popu-lar destination for traveling, both for overnight and day trips (see Table 2-1). Both stud-ies made by Mellander (2006) and data collected by authors (2010), show that the order has not changed. It should be noted that in the studies made in 2004, the results for Gothenburg Region consists of Gothenburg City and Västra Götaland province. The re-sults for Småland have been added from the total of three provinces: Jönköping, Krono-berg and Kalmar (Småland Tourism, 2010). The studies made in 2010 are measuring the ideal region for leisure in Sweden, and can therefore only be seen as an estimated con-sumption. According to studies made by Mellander (2006) Jönköping province is the most popular within Småland and obtain a hotel room capacity of 1736, which ranks Jönköping number five on the list of hotel room capacity per city. Stockholm was first with over 11000 rooms available per night and Gothenburg with over 6000 rooms. Table 2-1 Consumer’s traveling habits within different regions in Sweden for leisure purposes
Rank
2004 Region Traveling Habits
Total Per-centage Ideal Region in 2010 Percentage Leisure; in-cluding Over-night stay Leisure; Day Trip 1 Gothenburg 17.29 18.22 35.51 1 33.6 2 Greater Stockholm 16.47 14.23 30.7 2 22.1 3 Skåne 8.97 10.88 19.85 3 8.4 4 Småland 7.95 9.42 17.37 4 7.6 5 Dalarna 5.53 4.65 10.18 - - 6 Östergötland 4.61 4.81 9.42 - - 7 Halland 4.23 4.90 9.13 8 4.6 8 Södermanland 3.96 3.41 7.37 - - 9 Västernorrland 3.13 3.17 6.3 - - 10 Gävleborg 2.90 3.09 5.99 - -
(Source: Mellander, 2006; data collected by authors, 2010)
1 A concept developed by the city marketers of Jönköping. Destination Jönköping focuses on the city‟s image and aim to market Jönköping as a more attractive destianation for industries, tourists and inhabi-tants (Destination Jönköping, 2010).
2 Stadsbyggnads vision 2.0 was designed by the city planners to improve Jönköping city‟s infrastructure, and to make Jönköping city centre more vibrant and attractive for local inhabitants and tourists. The goal is to make Jönköping city the most attractive city centre in Scandinavia ( Jönköping Municipality, 2009a)
In the following section, the paper discusses the major changes that have taken place in Las Vegas and how the city has become what it is today. Las Vegas plays an important role in this paper, since it is one of the top tourist destinations in the world. Now that Jönköping city planners are trying to make Jönköping the most attractive city centre in Scandinavia, we are interested to find out if there is something which could be learned from the way Las Vegas has been marketed and branded throughout history.
2.2
Las Vegas
The history of Las Vegas extends to the 1800s when the Mormons settled in. Since then many reforms have taken place. In the early 1900s the first railroad stop was built in Las Vegas which made it convenient for the business men to stay overnight, while travelling between Los Angeles and Salt Lake City (Moehring, 2000; Douglass and Raento, 2004). As the Hoover Dam was constructed to supply energy and water to the west, em-ployment rates increased. The construction of railroads, as well as, the mining possibili-ties nearby, more people were coming in to the city from other regions. This in return enabled the city to concentrate on the infrastructure. A lot of investment was needed to support such growth and rapid development within Las Vegas. Today, the Strip is the main street with all different attractions and grand casinos.
Geographically Las Vegas is situated in the Mohave Desert, with the closest big cities being over 200 miles away (Google, 2010). Despite of tourists having no other cities to visit, the Grand Canyon and the Hoover Dam are situated nearby. Different packages are offered for tourists to be able to get the most out of their visits in Las Vegas and therefore one can sit in the helicopter and view the Grand Canyon and Hoover Dam from the air, or then take a car and experience it independently (Bananie, 2010). Several other packaged deals, including various recreational activities are also offered within Las Vegas for visitors (LVCVA, 2010); (VEGAS.com, LLC and Stephens Media Intel-lectual Property, LLC., 2010).
Figure 2-2 shows how accessible Las Vegas is today by aviation. Only a fraction of the
cities are displayed in the graph. It should be noted that, within Las Vegas both national and international flights arrive and depart daily, and between the bigger cities, several flights are flown during the day (Clark County Department of Aviation, 2010). It could be argued that accessibility has a positive impact on consumers willingness to travel to Las Vegas.
Figure 2-2 Access Las Vegas (Source: Coutsoukis, 2000)
Las Vegas has become the world‟s number 1 tourist place in the world. With an increase of over 450% people visiting in the last 30 years (City of Las Vegas, 2010), it has been expanding constantly. It is no surprise that other city planners use Las Vegas as a role model when trying to increase their own tourism (Douglass and Raento, 2004). In 2000 it was noted that 37 million tourists visited Las Vegas, bringing in gaming revenues reaching $5 billion dollars within the Strip alone. Calculations show that every visitor spent around $135 on gambling (2004). Gambling is not the only source of revenue Las Vegas has. One could calculate the hotel capacity in Las Vegas. In 2000, 92.5% of their rooms were occupied, making Las Vegas the number one in the US for filling their ho-tel rooms (2004). Conventions and conferences act as good sources of revenue as well, already in 1999, 3.7 million visitors alone took part in conventions and impacted the economy by more than $4.1 billion (Las Vegas Convention & Visitors Authority, 2000; cited by Baloglu and Love, 2004).
Las Vegas is not only about Casino‟s and gambling, or getting married at a Chapel with Elvis Presley as the priest, but it is also about the entertainment and experience which one gains by walking down the Las Vegas Strip. On one side one will be able to enter Venice and its romantic atmosphere, when again on the other side one can enter New York and stand right under the statue of Liberty. Not only will one be able to visit the grand Bellagio with the musical fountain but also see the Eiffel Tower standing proudly in the middle of everything. Consumers are always looking for new experiences, and in today‟s economy as working hours have decreased and there is more time for leisure (Vogel, 2007; Andersson and Andersson, 2006; Caves, 2000), Las Vegas offers some-thing which cannot be seen in every city (Firat, 2001). Instead of having to travel to
New York or Paris to experience different forms of entertainment, they can all be ac-cessed at one place: „Destination‟ Las Vegas.
It should be noted that this paper takes a closer look at Las Vegas as a model (Las Ve-gas Entertainment Concept) rather than a city when looking at how Jönköping has branded itself and built an image within Sweden. Although, it should be taken into con-sideration that no real connection can be built from two such different cities and, there-fore, this paper has taken a different approach. Instead of trying to make Jönköping the new Las Vegas, the concentration is on the way Las Vegas has been branded and mar-keted and how those methods could be applied to Jönköping.
3
Theoretical Framework
This section discusses the definition of branding and how it is associated to experience goods. Followed by looking into both demand and supply of experience goods and ser-vices. In the later sections, previous studies indicate that expectations play an important role in both demand and supply when determining the consumption of experiential goods.
3.1
Destination Branding
According to Kolb (2006, p.219)
„branding is the process of creating a slogan from a message and then designing a symbol or logo that together with the slogan will communicate to potential visitors the image of the city along with the features, benefits and values it has to offer.‟
It is essential that the displayed logo or symbol is consistently presented through various communication channels so that consumers can easily associate them with the city. Kolb (2006) also indicates that the consumers self identity and travelling preferences are linked. Consumers tend to choose destinations which reflect themselves the most. City image and atmosphere is something which can be channelled through successful branding. There are both long-term and short-term implications. Short-term branding can be used for some specific campaign or happening, such as Lake Vättern Festival, an event/concert which takes place by the lake before the schools start. Long-term implica-tions could be concentrating on the city‟s attracimplica-tions which are constant, such as John Bauer Museum, HV71 or A6 Centre and upcoming Scenkonst hus (Hankinson, 2005). The supply of experiential and cultural goods in this study fall under 4 different catego-ries introduced by Peter, Weiermair & Katawandee (2006) in their „Destination Product Dimension‟ (p. 66-67): Destination-oriented dimensions and atmosphere (A), Service-infrastructure and service-oriented dimension (B), Social and cultural attrac-tion/characteristics/factors (C) and Symbolic Associations (D). In Table 3-1, one can see the distribution of variables within each category which can later on be adapted to any destinations‟ experiential product development. Within this study, the following variables act as input (supply) for city‟s capacity and resources in the model based on Middleton and Clarkes (2001, p.77) Stimulus response model for buyer behaviour. The model looks at how consumers make their decisions and the consumption process as a whole. (See Appendix 1)
Table 3-1 The four destination product dimensions from supplier’s point of view A: Destination-oriented dimension and atmosphere -Landscape and natural resources
*Sand and sea
*Experience of nature *Walking and hiking paths -Climate
-Peace and quiet/Relaxation/Seclusion -Geographical vicinity and accessibility -Place atmosphere: small town
-Safety
-Cultural attractions: historical buildings, Museums, religious sites -Live performances/Event
B: Service Infrastructure and service-oriented dimension -Accommodation/Facilities (Pleasantness and atmosphere)
-Service in accommodation (Offer individualized attention, anticipating needs) -Friendliness of staff in restaurants, shops
-Offers for families with children -Provision of food
-Entertainment (Night life)
-Shopping opportunities: handicraft, arts, souvenirs -Sports: water-sport and land sport
-Business-related: meeting facilities -Transport/Guide
C: Social and cultural attraction/characteristics/factors -Language
-Traditions and values -Art, handcrafts and music -History of the region
-Types of work and technology used -Architecture
-Religion
-Educational system -Leisure activities
-Way of life (i.e. laid-back) -Friendliness of the local people -Social encounters -People -Diversity D: Symbolic Associations -Escape, holiday -Freedom/independence
-Family life /a full or complete life -Extension of life, carefree
-Romance and intimacy, strengthening bonds -Daydreams and fantasies, nostalgia
-Indulgence, contentment, fulfilment
3.2
Supply of Experience Goods
It is often implied that supply is related with demand. And as the law of supply states: „the quantity of a well-defined good or service that producers are willing and able to offer for sale during a particular period of time increases as the price of the good or service increases and decreases as the price decreases, everything else held constant.‟ (Boyes and Melvin, 2005, p. 51)
According to Butler (2006) supply creates demand instead of vice versa. He uses the example of cheap airlines such as Easyjet and RyanAir which have enable the consumer to visit destinations which they did not know was possible before. Due to increase in mobility within cities and countries, more disposable income is used for travelling and consuming experiential goods. Therefore, this implies that due to new supply, demand has followed. This same idea can be applied to the modern theatrical show, Cirque du
Soleil. Before this new form of entertainment theatre, acrobatics, circus shows, and
mu-sicals were separate art forms. Now all these different forms have been combined to create new demand in the entertainment sector (Kim and Mauborgne, 2004). Caves (2000) indicates that consumers‟ willingness to pay, in this case new demand created, is essential for the innovation process for the creative industry.
One should not neglect that the supply of entertainment and similar recreational goods and services are constrained by the following barriers: capital, know-how, regulations and price competition (Vogel, 2007). In order to compete effectively, the supplier need to invest capital and time to obtain additional competitive edge and technical knowl-edge. In the film industry, based on the increase in the amount of released 3D movies, one can assume that improved technology has raised the interests of movie-goers and increased their willingness to consume a 3D movie. As Caves (2000) suggests, consum-ers are more likely to pay more for new experiences. Lack of technology, know-how, may therefore act as a constraint for suppliers attempting to maximise revenues. Gov-ernment regulations on certain experience industries such as broadcasting, cable, and casino constrict the entry of new suppliers even though demand may be drastic. Price competition of current suppliers may hinder new entrants of experience goods, and ser-vice providers entering the market, due to the existing suppliers tendency to protect their market shares. New entrants of experience goods may therefore have little room for profit and survival (Vogel, 2007).
Due to the uncertain and intangible features of experience goods as mentioned in the later section (3.3.1), a supplier of experience goods attempt to maximize the expectation of consumers in order to increase return. Expectation comes from the quality of the product (Andersson and Andersson, 2006). In the example of film making, a producer tends to choose A-list creative inputs to secure the possible outcome of the movie. Al-though recent research shows that choosing an actor who has won an Oscar is more likely to have a negative impact on the success of their next movie (Eriksson, 2008).
3.3
Demand of Experience Goods
Demand of experience goods can be further divided into two parts: demand and expec-tations and demand and constraints. Previous studies suggest that these two aspects are interlinked with each other before and during consumption of experience goods (Andersson and Andersson, 2006).
3.3.1 Demand and Expectations
The formation of expectations depends on the characteristics of a specific market within a certain economy. These characteristics can serve as predictions for the success of that particular market (Muth, 1961). In order to understand the perception and expectation of branding city image in the consumers‟ mind, an interrogation of the market of experi-ence goods and its production has to be defined. Andersson and Andersson (2006) de-scribed that experience goods have four distinguishable characteristics: Intangibility,
In-separability, Heterogeneity and Perishability.
The most important and fundamental characteristic of experience goods is Intangibility. Unlike tangible goods such as cars, clothes and food which consumers can test, touch, taste and smell before purchasing, experiential goods such concerts, tours, and books cannot fully be perceived before making the decision of purchasing. It is generally im-possible to evaluate one‟s perception of a book before actually reading it; same condi-tion applies to other experience goods. However, the consumpcondi-tion plan of purchasing an experience good is based on positive expectations of consumers even though they are facing uncertain results. This expectation of the future output when consuming experi-ence goods can be regarded as part of the process of experiexperi-ence goods‟ consumption and production (Andersson and Andersson, 2006).
Cities in this way act as intangible goods, because they cannot be consumed without be-ing present. Even though one does not know the outcome until they have visited, the messages set forward through branding may enhance the expectations consumers make before visiting the city. Therefore, in the hope of increasing demand, enhancing the city‟s image plays an important role; the consumers base a lot of their decisions on what is marketed. Caves (2000) mentions that creative suppliers tend to “puff” or over exag-gerate the products, to raise the consumers‟ expectations and willingness to consume. The process of consuming experience goods and cultural products are inseparable from the production process (Inseparability) (Andersson and Andersson, 2006). An opera goer enjoys the product they buy during the production of the opera, together with all the other opera goers and the whole setting (ambiance) of the opera. In some particular cases, other social contexts and the surroundings are parcels of the cultural consump-tion. Rainforest Café, Hard Rock Café, Planet Hollywood and Starbucks are restaurants and cafés which are not just for food and drink, but for the experience of atmosphere and environment, as well as the interaction with other customers and employees; it is the experience which is weighted in this case. The experience of taking part in Lake Vättern Festival in Jönköping where people gather at Lake Vättern to enjoy music and take part in other activities cannot be participated in a different time and place.
Heterogeneity of the product is the third distinguished characteristic of experience
goods. Efficiency in production and consumption in creative and cultural goods is corre-lated with the suitability of the characteristics and personalities of its consumers (Andersson and Andersson, 2006). The experience one gets from consuming creative and cultural goods is unique and special to every consumer. When it comes to cities, heterogeneity could be present by suppliers offering different levels and depths of cul-tural and experiential goods and services for its various consumers, and by interacting with them before, during and after consumption (Grönroos, 2007).
Perishability is the fourth characteristic of experience goods. Taken together with
product would be expired after the frame of time promised for consumers to enjoy it. This can explain why last minute musical tickets on Broadway are usually cheaper than normal price. To maximize profit, companies usually use price discrimination to capture consumer surplus (Courty, 2000; Vogel, 2007).
Because of the four characteristics described above, the problem a consumer faces when purchasing an experience is like investing in the stock market, “nobody knows” how the outcome is going to be (Caves, 2000). The uncertain nature of experience goods and causes consumers to rely on previous experiences shared by social contexts together with credible certifiers, such as critics or achieved awards. With the development of internet information can be shared worldwide and thus make the market of experience goods more available to consumers. The internet enhances knowledge which could not be reached before and, therefore, it acts as an important source during the „pre-evaluation process‟ (Andersson and Andersson, 2006, p. 108). One can now make price comparisons on a certain good or service and check the changing prices of the comple-mentary and substitute goods (Butler, 2006). Travel tips and experiences can now also be shared through various websites which can influence the consumers‟ decision to pur-chase.
3.3.2 Demand and Constraints
The demand for cultural goods can be influenced and constrained by price of the prod-ucts, level of income, demographic factors, time limitation, level of education, health and etc. (Andersson and Andersson, 2006). The general concept is that the higher a product price is, the lower the demand is for that product. In the case of live performing arts, if the ticket price for the concert of Pavarotti increases, the willingness to pay and to attend the concert will decrease, causing a decrease in demand for that certain con-cert. One should not neglect the price of complimentary goods (goods which are associ-ated to each other) or the price of substitute goods (goods which are similar to each other and can be replaced) (Boyes and Melvin, 2005), since they both have an effect on the demand of experiential products. An increase in the cost for transportation (e.g. price of fuel) from point A to Pavarotti‟s concert (complimentary goods) will have a negative impact on demand for the concert tickets, due to people not willing to pay as much for the travelling. A decrease of price for other performing arts like ballet or opera (substitute goods) would also have the same effect on the demand of Pavarotti‟s concert tickets. These two factors of the performing arts suggest that the facilities for perform-ing arts need to be supported with convenient transportation and accessibility. This could explain why most cultural centres are clustered in big cities all over the world (Florida, 2002; Andersson and Andersson, 2006).
Besides the general concept of relative prices, individual characteristics such as level of education has a substantial effect on the demand for experiential goods; this effect is proved to be stronger than income factor (Caves, 2000). Empirical data shows that teachers and students are the most frequent attendees to arts and entertainment activities such as performing arts, jazz, folk music and cinema. Formal (academic) and informal (self-learning) ways of education serve as the „stock of information‟ for the consumer. This stock of information will enhance the searching and appreciation process of cul-tural goods. Caves (2000) also argues that the more time and knowledge one has when experiencing music, the higher satisfaction one would achieve from a given hour of
lis-tening to music. As a result, this pushes one to consume more music related goods than other cultural products.
Opportunity cost of time and time constraint of individuals has a significant impact on demand. According to Caves (2000) young people are more likely to spend more time listening to music due to free time and lower wages. Opportunity cost of listening to music is therefore lower now than comparing to their later age assuming that their working hours and wages have increased. However, this amount of time spent on music in the younger age builds up the tastes of what music will be consumed later on in their lifetime (2000). Andersson and Andersson (2006) mention with regards to time con-straint of an individual, there is limited time which can be allocated to leisure (including sleeping) and working hours during a given lifetime. Due to development in technology and improvement in productivity, the working time of developed economies has been decreasing, thus we can say that people nowadays have more leisure time to consume experiential products (Vogel, 2007).
Disposable income acts as a constraint for the demand of experiential goods. Tradition-ally economists split consumer goods into necessary goods, normal goods and luxury goods (Andersson and Andersson, 2006; Vogel, 2007). An increase in disposable in-come is positively correlated with demand and supply of experiential goods. National per capita income growth is an important factor for observing the increasing expenses on cultural goods and recreational activities of individuals and of households (2006). Empirical data (see Table 3-2) suggest that the percentage of disposable income dedi-cated to arts, entertainment and other cultural goods has been growing in many eco-nomically advanced countries (2006).
Table 3-2 Percentage of recreation consumption (arts and entertainment) to total expenditures in
devel-oped market economies in 1975 and 2002
Country 1975 2002 Increased Expenditure between 1975 and 2002
UK 5.9 13.2 7.3% France 3.2 9.3 6.1% Norway 8.9 13.2 4.3% Denmark 8.1 10.3 2.2% Finland 9.6 11.3 1.7% Sweden .. 12.5 ..
(Source: Andersson and Andersson, 2006, p. 42)
Changes in the demographic structures influence the demand for arts, entertainment and other leisure activities and, in the long run, distinct trends can be observed throughout the history of the cultural industry. According to Andersson and Andersson (2006) the decline in family members per household suggests that households can now afford much higher quality of leisure goods and services. The increase of “double incomes, no children” households leave great room for consuming art and entertainment in metro-politan areas, and even for travelling around the world in monetary terms. The increase in average lifetime and the reduction of working hours indicate more time is being dis-tributed to the consumption of leisure and recreational activities. The implication of in-creased leisure time and income has given a great opportunity to consume arts and en-tertainment and other recreational products more than ever before (Andersson and Andersson, 2006).
Appreciation and gratification from consuming an experiential good or service is differ-ent for each and every individual. Therefore, it is challenging to measure the satisfaction degree of general consumer goods, let alone to measure the satisfaction of an experience good that cannot be enjoyed before purchasing. Economists use utility to facilitate measurability in satisfaction (Vogel, 2007; Andersson and Andersson, 2006; Heilbrun and Gray, 2001). It is well accepted that rational individuals attempt to maximize utility, despite of constraints (time, income, etc.) to find a solution or a decision which offers the most pleasure to them in the given situation. Because of the uncertain nature of ex-perience goods mentioned in the previous section, individuals tend to maximize their expected utility instead of utility described above when considering purchasing an expe-riential good. This concept of expected utility could explain the willingness to pay for a certain creative and experiential good (Vogel, 2007).
When looking at the concept of branding a city, one must take into account that it has several different aspects. Branding can be used to increase the knowledge of the con-sumer, which will affect the buyers decision later. Lack of knowledge often acts as a constraint as discussed in the prior section, and therefore, through efficient ways of branding, this constraint can be minimized. Branding can also serve as a communication channel between city marketers and their potential consumers. Today we live in an „in-formation society‟ which implies that in„in-formation is in our grasp at all times (Solomon, 2009). A previous study (Solomon, 2009) shows that 30 years ago, an average adult was exposed to about 560 pieces of advertising information a day, when today it has in-creased to over 3,500. So what suppliers have to keep in mind is to differentiate them-selves from competitors, as well as, measure the effectiveness of their branding mes-sages. So for a city to be successfully branded in the eyes of consumers it needs to find a way to become unique and memorable. And remember not to make promises which cannot be kept.
4
Empirical Studies: Methodology
The purpose of this paper is to understand the perceptions of people within and outside of Jönköping regarding Jönköping‟s branding factors and city image. A model was de-veloped based on the previous chapter to capture the process from the construction of branding factors, formation of expectations, actual consumption to post-consumption perceptions and utility. This model will be explained in section 4.1 in detail and it serves as the foundation of this research. Followed by 4.2 which discusses the research questions. In order to find out whether the factors Jönköping lists as important when it comes to tourism and attracting new people, a questionnaire was formed. Sections 4.3 and 4.4 discuss the survey in more detail and the data collecting methods used.
4.1
Model Description
To define the main branding factors and city images the Jönköping municipality associ-ates with, approximately 40 brochures were looked at. (See Appendix 2) The branding factors were gathered from the various brochures and information present at the tourist office and municipality office. The categories for Jönköping‟s branding factors were based on these 9 subjects which were filtered through the previously mentioned
Desti-nation Product Dimension list (see Table 3-1):
b1- HV71: Jönköping‟s local ice hockey team
b2- Elmia: Internationally recognised Conference and Exhibition Centre (Jönköping munici-pality, 2009c)
b3- Nature/Lake Vättern
b4- Cultural: Architecture, cultural heritage, arts and museums, local history and diversity b5- Accessibility: Transportation system and hotel capacity
b6- Recreation: Organised events by Jönköping municipality and local inhabitants b7- University: Consists of approximately 9000 students; both national and international b8- Atmosphere: Religious, industrial and other symbolic associations
b9- Science Park: Support entrepreneurs and help in setting up new companies
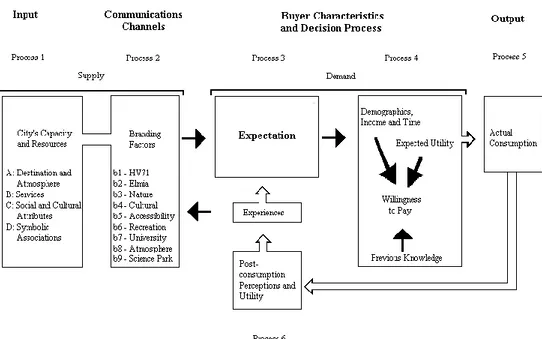
Based on the theory discussed in previous section, a new model (Figure 4-1) was con-structed to combine city branding, consumer demand and formation of expectations. In this model, the process of city branding and consuming the branded experiential prod-ucts can be divided into 6 processes: consumers perception on the supplied branding factors (Process 1 and 2) , the formulation of consumer expectations (Process 3), evaluation of consumer‟s willingness to pay according to their constraints (Process 4), actual consumption (Process 5) and post-consumption perceptions and perceived utility (Process 6).
Figure 4-1 Consumer’s demand and expectation model, based on Middleton and Clarke (2001, p.77) In Process 1, based on the four dimensions of destination products displayed in Table
3-1, suppliers can evaluate which of those resources the city possesses in terms of
tour-ism. Jönköping city‟s marketers should begin by taking a deeper look into what factors and attributes can be developed to sustain experiential goods and services throughout the year. It is important to note that at this stage promises are built and exposed to later influence the consumers‟ expectations (Middleton and Clarke, 2001; Peters, Weiermair and Katawandee, 2006).
From these four destination product dimensions, nine different branding factors for Jönköping are formed for testing (Process 2), as can be seen in the questionnaire
(Ap-pendix 3) these branding factors have also been used again to depict 22 different
asso-ciations people have regarding Jönköping. As mentioned in Process 1 promises are formulated, and the purpose of Process 2 is to carry out those promises and distribute them through various communication channels to attract as many consumers as possi-ble.
According to previous studies (Andersson and Andersson, 2006), demand for cultural goods can be determined by consumer’s expectations (Process 3) as well as consumer’s
constraints of consumption (Process 4). Consumers‟ perceptions and expectations of
branding factors promoted by regional marketers are derived from different communica-tion channels such as different promocommunica-tional media, previous experience and knowledge, information shared from friends, family and other social context. At the same time, con-sumer‟s constraints, for example, income, time, knowledge and expected utility (which has already been maximized in given situations of income, time, health, etc.) affect their willingness to pay (Andersson and Andersson, 2006; Vogel, 2007).
It is suggested that current demand is correlated with future demand, due to short-term expected demand based on perceived expectation could suddenly be increased by mass media and word-of-mouth (previous experiences) or vice versa. One of the key issues
for a successful city branding strategy is sustaining the quality of the supply of the branding factors (𝑏1-𝑏9) to meet with the changing expectations of the demand force.
Process 5 concentrates on the actual consumption. It is the foundation for the current
demand, as it is being determined during the actual purchase or use of the experiential good. During the process the consumer experiences the quality of the experience prod-uct or service, and from that links it to his or her original expectations which were made before consumption (Process 3). Process 6 focuses on the post-consumption percep-tions and utility gained. These post-consumption perceppercep-tions and utility will lead to ei-ther positive or negative experiences. A positive experience would lead to an increase in future demand and therefore resulting in growth of expected revenues, and vice versa. Expected profit of city branding derives from total expected revenue of branding minus total expected cost of branding. Expected revenue equals the sum of the price of each factor multiplied by expected quantity of demand while total expected cost of branding consists of total expected fixed costs plus total variable costs.
City marketers and experiential good and service suppliers should also keep in mind that the task is to maximize the expected profit. One way is to minimize the gap be-tween expectations and post-consumption perceptions and utility in order to increase expected revenues as mentioned in the previous paragraph. An idea is that after con-sumption of an experiential or cultural good or service (Process 5) the consumer should be encouraged to offer feedback (Process 6) which can be used to improve future prom-ises provided by the supplier. Could quality equal to quantity when determining de-mand? One effective way of gathering feedback is through customer satisfaction sur-veys and keeping in touch with the customer after the consumption (Grönroos, 2007). In the Amsterdam Dungeon, after the experience is consumed, one is able to fill in a cus-tomer satisfaction questionnaire through an interactive computer which has been situ-ated in the exit area; this could increase the willingness to answer.
4.2
Research Questions
The conducted questionnaire aims at answering four main questions. The first two focus on the current situation of Jönköping and how consumers perceive the city. The last two look at the possibility of forming new demand.
1. Does the general perception of Jönköping being a religious city have a negative impact on the consumer‟s willingness to visit Jönköping?
2. When branding „Destination Jönköping‟, should marketers focus on the core city attributes and attractions or enhancing the city image?
3. Can packaged deals increase consumer‟s willingness to visit Jönköping?
4. Could The Las Vegas Entertainment Concept increase consumer‟s willingness to visit Jönköping.
4.3
Survey Design
Quantitative research was used to get a broader picture of how people perceive Jönköping from both inside and outside of the city. Based on the constructed model, the survey was divided into four sections: general information, travelling habits, a closer look at Jönköping and recommendation. The general information (Questions 1-5) takes a closer look at possible consumer constraints such as age (health), profession (educa-tion, time and income) and other demographic factors (gender, nationality and place of
residence). The travelling habits section (Questions 6-10) take a look at consumers‟ overall expectations regarding travelling in Sweden. This could help understanding their characteristics and how the expected utility is formed. This section also gives an indica-tion as to which destinaindica-tions act as the main competitors for Jönköping city.
In the closer look at Jönköping section, the respondents perceptions on Jönköping were tested (Question 11), together with different aspects associated with the city, for in-stance various marketing channels (Questions 12-14), branding factors (Question 15), perceived quality (Questions 16-18), offerings and promises (Questions 19-27), and willingness to pay for packaged deals (Question 28).
In the recommendations, put forward in the questionnaire, we believe that instead of be-coming a centre of high-arts in the region of Småland, Jönköping should be branded and marketed as an entertainment centre. We believe that the comprehensive entertainment centre which provides various activities and recreational services would be an entrepre-neurial idea for Jönköping to maximize cash flow and to increase tourism. Therefore, as discussed earlier (section 2.2) the world‟s most popularly visited destination, Las Ve-gas, is used as an example to demonstrate and test people‟s perceptions on the idea of constructing an entertainment centre (Questions 29-34).
4.4
Data Collecting Method
In order to get an evenly distributed number of respondents within and outside of Jönköping, as well as due to financial constraint, the convenience sampling method was applied for the data collecting process. This process implies, instead of aiming at getting as many respondents as possible, one chooses a sample size which is followed through (Saunders, Lewis & Thornhill, 2009). In this case, the total number of responses were aimed at 130, with approximately half of the total respondents in all three samples were currently residents in Jönköping while the other half were not. In the survey the sample body was subdivided into 3 different clusters which include: (1) student body of Jönköping University, both international and Swedish students; (2) randomly sampled train passengers and passersby in train stations; and (3) email respondents. In the fol-lowing paragraphs, one can see the sampling process in more detail.
The student body of Jönköping University as one sample was chosen due to the wide distribution of students from all over Sweden, as well as, international students from all over the world. Having lived and studied in Jönköping for some time, those students who were from cities and countries outside of Jönköping could be seen as in-depth tour-ists, who over time have gotten a better and deeper understanding of Jönköping than general tourists and commuters (Yen, 2008). Therefore, these students are an important segment when it comes to future marketing. Besides that, local Jönköping residents were selected as well. The link to the questionnaire was spread among fellow students and local Swedish residents through mass e-mail and contact lists.
In order to find out if Jönköping‟s marketing strategy was well perceived by people out-side of Jönköping, trips were made to Stockholm and Gothenburg; the two largest cities in Sweden (Infoplease, 2007). The authors randomly asked the passengers on the train, as well as, in the train station to fill out the questionnaire in paper form. Each trip was taking place on a week day with the outgoing train after morning rush hour and incom-ing train durincom-ing rush hour. This way, the authors should have had an equal chance to capture commuters as well as passengers with other purposes.
5
Empirical Findings and Discussion
Section five is divided into four parts and it is based on the sequence of the question-naire and the flow of explanation. Section 5.1 describes the sample and 5.2 looks at the general travelling preferences of consumers. 5.3 presents the perceptions of Jönköping in terms of communication channels, current branding factors, existing attraction and other future opportunities. 5.4 analyses the perceptions and willingness to pay for the Las Vegas entertainment concept.
5.1
Sample Description Travelling Preferences
The total sample equals 131 respondents, with 56 residing in Jönköping (42.7%) and 75 in other regions (57.3%). 75 respondents were female (57.3%) and 56 were male (42.7%), within the following age groups:
Table 5-1 Age distribution
Age Frequency Percent
Under 20 12 9.2 20-29 89 67.9 30-39 10 7.6 40-49 4 3.1 50-59 8 6.1 60+ 8 6.1 Total 131 100.0
The nationalities of the respondents were categorized into 2 groups; Swedish (69, 52.7%) and Other (62, 47.3%). Within Other, European, excluding Swedish, was the biggest sample group (29, 22.1%), followed by Asian (18, 13.7%). To better understand the target groups the respondents were asked to fill in their professions. The samples were divided into two sections: Students (86, 65.6%), and Business and Other (45, 34.4%).
5.2
Travelling Preferences
To determine which regions act as the main competitors for Jönköping municipality, in terms of tourism. It turned out that Gothenburg was the number one ideal place to go, followed by Stockholm and Skåne. As could be seen from Mellander‟s (2006) research (Table 2-1) based on 22000 respondents, our survey showed the same results.
Table 5-2 Ideal Region for leisure in Sweden; based on 131 respondents Region Percent Gothenburg 33.6 Stockholm 22.1 Skåne 8.4 Småland 7.6 Gotland 7.6 Öland 6.1 Other 6.1 Halland 4.6 Lappland 3.8
Based on empirical studies (Nutek, 2007; 2008), Liseberg Theme park in Gothenburg is the number one attraction in Sweden. Therefore it could be assumed to have an impact on the research results by explaining the popularity of leisure trips made to Gothenburg in the past 6 years.
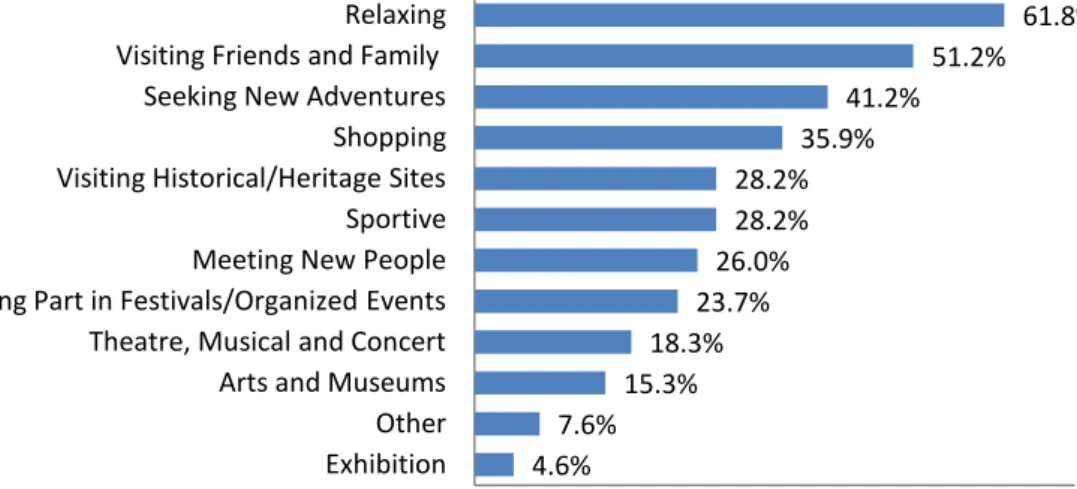
Survey results also show that relaxation and visiting friends and family are the main reasons for people to travel. However, the importance for other recreational activities and services as shown in Figure 5-1 Main purpose(s) for travellingmay imply the in-creasing demand in those markets.
Figure 5-1 Main purpose(s) for travelling
Empirical study based on Pearce (1996) suggests that 80% of tourism related commer-cial accommodation revenue in Sweden derives from domestic travellers and the desti-nations are relatively concentrated in the southern parts of the country. The study also indicates that most of the Swedish travel with the purpose of visiting friends and family (30%) and staying in second houses (36%), such as summer cottages (1996). Recent studies (Nutek, 2007) (Figure 5-2) also support this phenomenon that 57% of the main purpose of Swedish travellers goes to visiting friends and family, 15.4% accounts for stay in second houses.
Figure 5-2 Main purpose(s) of travelling in Sweden (Source: Nutek, 2007) 4.6% 7.6% 15.3% 18.3% 23.7% 26.0% 28.2% 28.2% 35.9% 41.2% 51.2% 61.8% 0,0% 10,0% 20,0% 30,0% 40,0% 50,0% 60,0% 70,0% Exhibition Other Arts and Museums Theatre, Musical and Concert Taking Part in Festivals/Organized Events Meeting New People Sportive Visiting Historical/Heritage Sites Shopping Seeking New Adventures Visiting Friends and Family Relaxing % of Respondents Tr av e lli n g Pur p o se s 9.2% 9.4% 13.7% 15.4% 17.2% 25.5% 57.7% 0,0% 10,0% 20,0% 30,0% 40,0% 50,0% 60,0% 70,0% Attending Wedding, Funeral Christening etc.
Pleasure and Entertainment Spending Time with Other People Stay in Second House Peace and Quiet/Relaxation Getting Away Visiting Friends and Family
% of Respondents Tr av e lli n g Pur p o se s
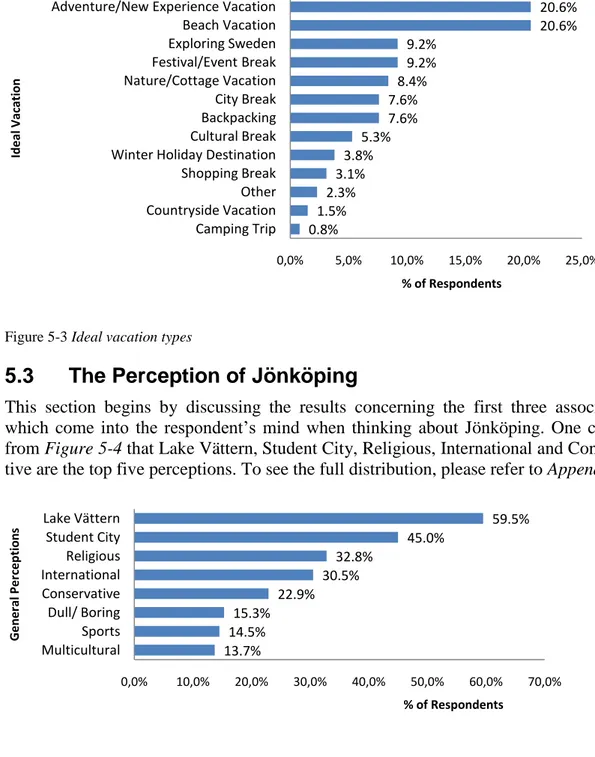
Based on both studies made by Pierce (1996) and Nutek (2007) and our survey the re-sults imply that the trends have stayed somewhat constant throughout the last 15 years. The ideal vacation type is also analysed as shown in Figure 5-3, one can see that re-spondents value adventure and new experience. This may be explained by the theory of Caves (2000) that people are generally more willing to try out new experience goods. Beach Vacations were also popular within the respondents. The assumption was thefore made that relaxation and beach vacation were correlated with each other. The re-sults show no significance between the two factors but based on crosstabs analysis, 77.8% of respondents who answered Beach vacation also valued Relaxation while trav-elling.
Figure 5-3 Ideal vacation types
5.3
The Perception of Jönköping
This section begins by discussing the results concerning the first three associations which come into the respondent‟s mind when thinking about Jönköping. One can see from Figure 5-4 that Lake Vättern, Student City, Religious, International and Conserva-tive are the top five perceptions. To see the full distribution, please refer to Appendix 4.
Figure 5-4 Distribution of respondent’s first three perceptions about Jönköping 0.8% 1.5% 2.3% 3.1% 3.8% 5.3% 7.6% 7.6% 8.4% 9.2% 9.2% 20.6% 20.6% 0,0% 5,0% 10,0% 15,0% 20,0% 25,0% Camping Trip Countryside Vacation Other Shopping Break Winter Holiday Destination Cultural Break Backpacking City Break Nature/Cottage Vacation Festival/Event Break Exploring Sweden Beach Vacation Adventure/New Experience Vacation
% of Respondents Id e al V ac ati o n 13.7% 14.5% 15.3% 22.9% 30.5% 32.8% 45.0% 59.5% 0,0% 10,0% 20,0% 30,0% 40,0% 50,0% 60,0% 70,0% Multicultural Sports Dull/ Boring Conservative International Religious Student City Lake Vättern % of Respondents G e n e ral Pe rc e p ti o n s
Branding factors are used to investigate the level of recognition on a scale of 1-4, 1:strongly disagreeing and 4:strongly agreeing, the result is presented in Table 5-3. Ac-cording to Figure 5-4,one can see that Lake Vättern, Religious and University (Student City) are seen as the main branding factors (mean bigger than 2) among respondents. This may indicate that Lake Vättern and Jönköping University are more likely to be common sense for people and recognition is therefore higher.
Table 5-3 Level of recognition concerning Jönköping’s branding factors from a scale of 1-4
Brand Lake Vättern University Religious Family
Friendly Mean 3.41 3.02 2.68 2.53 Brand Transportation Hub Industrial City Conference/Exhibition/Convention Centre Entrepreneu-rial Mean 2.44 2.35 2.27 2.19
Brand Enriched recrea-tional activities
Holiday Des-tination
Enriched theatres, musicals and mu-seums
Enriched Arts and Museums
Mean 1.93 1.79 1.71 1.68
City marketers can use those attributes as the foundation of the promotional campaigns for example Vättern Festival (organized by the municipality) and Spring Inspiration (organized by students in Jönköping University) in Elmia. The reason why consumers persistently perceive Jönköping as religious could be due to Jönköping being known as „Småland‟s Jerusalem‟ (Larsson and Wahlqvist, 2006). Based on discussions with some respondents, the negative willingness to visit Jönköping is due to perceiving the inhabi-tants as too religious and conservative. Therefore religiousness can act as a negative im-pact on city image. However, when it comes to leisure or experiential goods and ser-vices such as museums, musicals, recreational activities and holiday destination, the level of agreement of these factors suggests that there is still room for improving brand-ing within those markets.
Table 5-4suggests that people in general are less likely to want to visit Jönköping due to regarding it being religious. 72.1% of the respondents who considered promotion not being successful regarded Jönköping as religious. This means that consumers who asso-ciate religious with Jönköping tend to not want to visit the city. When looking at brand-ing and the association of bebrand-ing branded as religious and willbrand-ingness to pay, the respon-dents who strongly disagreed were more willing to visit Jönköping (58.3%). When again 71% who strongly agreed with the branding message were less willing to visit Jönköping. This implies that when the city‟s image is regarded as religious could have a negative impact on the consumers‟ willingness to visit.
Table 5-4 Percentage of respondents associating religious with willingness to visit Jönköping
Perception Willingness to visit Jönköping
Yes No Total Respondents
Religious 27.9 72.1 32.8
Branded as religious Willingness to visit Jönköping Yes No Total Respondents*
Strongly Disagree 58.3 41.7 9.2
Disagree 28 72 19.1
Agree 45.5 54.5 42.0
Strongly Agree 29 71 23.7
* 6.1% of respondents did not want to share
A Pearson Chi-square correlation test was run to see if there are any significances be-tween willingness to visit and the perception of religious (.091) and branding (.193). Due to no high significances between the two, a correlation between perception and branding corresponding to religiousness was tested. A high significance was found (.000); 89.2 % of the respondents who strongly disagreed and disagreed that Jönköping is branded as a religious city neither perceived it as one. When only 45.4% of the re-spondents who perceived Jönköping as being religious also agreed with it being branded that way. The results therefore imply that respondents who did not associate religious with Jönköping neither considered it being branded religiously.
The awareness of Jönköping‟s existing attractions are analysed and presented in Table 5-5. John Bauer, Matchstick Museum, Elmia, and HV71 are highly recognized. It can be interpreted that John Bauer and Matchstick Museum are the components of Swedish history while Elmia and HV71 are commercially promoted and broadcasted in different events throughout the country. We also interpret that the awareness and perception of a certain attraction takes time and knowledge to formulate in consumers‟ minds since both Smålands Scenkonst hus and Vättern Festival are new event and architecture in Jönköping region and they are both not well recognized yet. It can be assumed because these products are experience related, sometimes it takes time for those products to build up a common knowledge among consumers (see section 3.3.2). The perception of the possibility for Jönköping to become Scandinavian‟s most attractive town centre is relatively negative.
Table 5-5 Awareness of existing attractions Elmia HV71 John Bauer Matchstick Museum Vättern Festival Scenkonst hus Scandinavian town centre Jönköping Södra IF Yes 82.4 76.3 67.9 64.9 41.2 40.5 34.4 24.4 No 17.6 23.7 32.1 35.1 58.8 59.5 65.6 75.6
To find out if the 12 factors listed in Table 5-3were significant in Jönköping‟s process of becoming the most attractive Scandinavian town centre, a correlation test was made. The correlation table can be found in Appendix 5. Results show Entrepreneurial, Holi-day destination, Enriched arts and museums and Enriched recreational activities are re-lated. This can be interpreted as the attractiveness of a city not only comes from infra-structures but also cultural background affects consumers‟ perceptions. Also it explains that entrepreneurial spirit in terms of creating new demand of experiential products and services of the city is important for a city to foster and prosper.
Jönköping‟s marketers see Jönköping as a sportive city and are proud of its hockey team, HV71, which have just recently won the Swedish National Championships for the 4th time. According to the findings in Figure 5-4, sports account for only 14.5%, yet again 76.3% were aware of HV71. This indicates that even though HV71 is popularly known, the linkage between HV71 and perceptions of Jönköping being sportive is not as significant as marketers think. Only 24.4% of total sample shows awareness for the football team, Jönköping Södra IF, which is relatively lower than recognition for HV71. There is no significant difference between the residents of Jönköping (28.6%) and non-Jönköping residents (21.3 %). This may imply that the marketing for J-Södra IF is not so well perceived within and outside of Jönköping and the city‟s marketing strategy could be more focused on HV71 instead of multiple similar-options at the same time. Since, perception is an important factor in branding a city, when the city marketers promote too much information at a time, consumers usually tend to lose the attention and the information supplied is ignored (Solomon, 2009). It is dependent on the city marketers to realize which element should be executed and which ones should be dimin-ished (Kolb, 2006).
To test the possibility of creating new demand of experiential goods in Jönköping re-gion, some potential packaged deals consisting of various experiential goods were de-veloped and analysed as following. According to the results (Table 5-6), guided and or-ganized packaged deals are chosen more often compared to self-oror-ganized trip. Correla-tions can be found in Appendix 6.
Table 5-6 Interest in packaged deals
Offered packaged deals Yes No
A day out in Lake Vättern and camping (facilities and equipment included) 71.0 29.0 Private guided tour in museums, ice hockey game, dinner plus live performance 54.2 45.8 A guided family weekend trip to different destinations around Småland, including
transportation and accommodation
51.9 48.1
Organized pub crawl and hotel 50.4 49.6
Theatre show, dinner and hotel for two 47.3 52.7
All inclusive deal within a specific hotel 45.8 54.2 Based on the findings of Figure 5-3 Camping is the least chosen type of vacation among the respondents, yet again according to results in Table 5-6, 71% are willing to pay for a camping trip by Lake Vättern. This could imply that there is room for tourism develop-ment around the lake. Yet again, even though only 14.5% associated Jönköping with Sports, 54% were willing to pay for the packaged deal with ice hockey in it. This can be interpreted as HV71 having an impact on the consumer‟s decision regarding willingness to pay. City marketers could also try to promote different packaged deals based on those attributes which have been positively perceived.
Findings show that among the mass communication channels Internet and Newspaper are used by 42% of among all respondents followed by TV (35%), work/school (28.2%), posters (25.2%) and family/friends (21.4%). See Table 5-7 for the computed results.