PAPER WITHIN Production Systems
AUTHOR: Gustav Eriksson & Johan Isendahl
JÖNKÖPING June 2020
Conceptual Decision Support
Tool for RMS-Investments
A Three-Pronged Approach to Investments with
Focus on Performance Metrics for Reconfigurability
This exam work has been carried out at the School of Engineering in Jönköping in the subject area Production system with a specialization in production development and management. The work is a part of the Master of Science program.
The authors take full responsibility for opinions, conclusions and findings presented.
Examiner: Carin Rösiö Supervisor: Simon Boldt
Scope: 30 credits (second cycle) Date: 2020-06-14
Abstract
Abstract
Today's society is characterized by a high degree of change where the manufacturing systems are affected by both internal and external factors. To adapt to current manufac-turing requirements in the form of short lead-time, more variants, low and fluctuating volumes, in a cost-efficient manner, new approaches are needed. As the global market and its uncertainties for products and its lifecycles change, a concept called 'reconfigu-rable manufacturing system' has been developed. The idea is to design a manufacturing system for rapid structural change in both hardware and software to be responsive to capacity and functionality. A company's development towards the concept is often based on a strategy of incremental investments. In this situation, the challenges are to prioritize the right project and maximize the performance as well as the financial effi-ciency of a multi-approach problem.
The report is based on three different issues. Partly how to standardize relevant perfor-mance-based metrics to measure current conditions, how new perforperfor-mance-based met-rics can be developed in collaboration with reconfigurability characteristics and set a direction for how decision models can be used to optimize step-based investments. The study is structured as an explorative study with qualitative methods such as semi-struc-tured interviews and document study to get in-depth knowledge. Related literature ad-dresses concepts in search areas such as reconfigurable manufacturing system, key per-formance indicators, investment decisions and manufacturing readiness levels.
The findings are extracted from interviews and document studies that generate a focal company setting within the automotive industry which acts as the foundation for further analysis and decisions throughout the thesis. The analysis results in sixteen perfor-mance measurements where new measures been created for product flexibility, produc-tion volume flexibility, material handling flexibility, reconfiguraproduc-tion quality and diag-nosability using reconfigurability characteristics. A conceptual decision support model is introduced with an underlying seven-step investment process, analyzing lifecycle cost, risk triggered events in relation to cost and performance measurements.
The discussion chapter describe how different approaches are used during the project that has been revised by internal and external factors. Improvement possibilities regard-ing method choice and the aspects of credibility, transferability, dependability, and con-formability are discussed. Furthermore, the authors argue about the analysis process and how the result has been affected by circumstances and choices. The study concludes that a three-pronged approach is needed to validate the investment decision in terms of system performance changes, cost, and uncertainty. The report also helps to understand which performance-based metrics are relevant for evaluating manufacturing systems based on operational goals and manufacturing requirements.
Keywords
Reconfigurable Manufacturing System, Decision Support Tool, Investment, Key Per-formance Indicators, Investment Model.
Contents
Contents
1
Introduction ... 1
1.1 BACKGROUND ... 1
1.2 PROBLEM DESCRIPTION ... 3
1.3 PURPOSE AND RESEARCH QUESTIONS ... 4
1.4 DELIMITATIONS ... 5
1.5 OUTLINE ... 5
2
Method and Implementation ... 7
2.1 RESEARCH APPROACH ... 7 2.2 LITERATURE REVIEW ... 8 2.2.1 Literature Search ... 9 2.3 CASE STUDY ... 11 2.3.1 Case Selection ... 11 2.3.2 Data Collection ... 12
2.4 CREATION OF KEY PERFORMANCE INDICATORS ... 14
2.5 ENHANCEMENT OF THE CREDIBILITY ... 15
2.5.1 Credibility ... 15
2.5.2 Transferability ... 15
2.5.3 Dependability ... 15
2.5.4 Conformability ... 15
3
Theoretical Background ... 17
3.1 RECONFIGURABLE MANUFACTURING SYSTEMS ... 17
3.1.1 Key Performance Indicators in the Different Levels ... 19
3.1.2 Understanding Driving Forces and Strategies ... 19
3.1.3 Reconfigurable Manufacturing Systems Characteristics ... 19
3.2 KEY PERFORMANCE INDICATORS ... 21
3.2.1 Existing Key Performance Indicator Structures in Reconfigurable Manufacturing Systems ... 21
Contents
3.2.2 ISO-Standard 22400 ... 24
3.3 INVESTMENT DECISIONS ... 24
3.3.1 Financial Returns ... 26
3.3.2 Early Equipment Management ... 26
3.3.3 Cost Parameters ... 27
3.3.4 Non-Financial Returns and Parameters ... 27
3.3.5 Handling the Uncertainty ... 28
3.4 MANUFACTURING READINESS LEVEL ... 29
4
Findings ... 31
4.1 GENERAL ... 31
4.2 CALCULATIONS ... 31
4.3 PRIORITIZATIONS ... 32
4.4 RISK ASSESSMENT ... 32
4.5 MANUFACTURING READINESS LEVEL ... 32
5
Performance Indicators and Reconfigurability ... 33
5.1 GROUPING AND SELECTION OF THE KEY PERFORMANCE INDICATORS ... 33
5.1.1 System Capability ... 33 5.1.2 Productivity ... 34 5.1.3 Flexibility ... 35 5.1.4 Quality ... 35 5.1.5 People ... 37 5.1.6 Environment ... 37 5.1.7 Summary ... 37 5.2 PROCESS OF STANDARDIZING ... 39
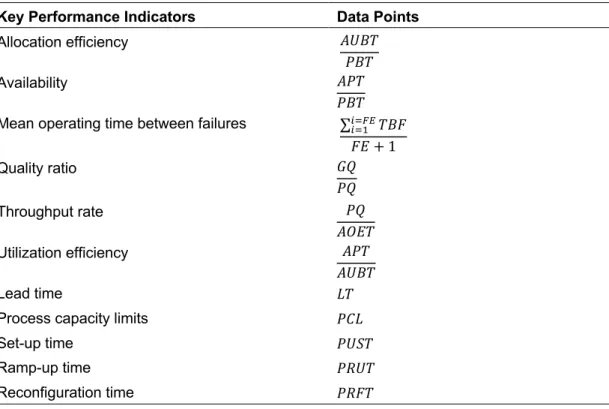
5.3 DATA POINTS AND LEVEL OF COLLECTION ... 39
6
Complementing Key Performance Indicators with new ones
based on Reconfigurability Characteristics ... 41
6.1 DEFINING THE PERFORMANCE MEASUREMENTS ... 43
Contents
7
Conceptual Decision Support Tool ... 51
7.1 COLLECTING DATA AND COMPUTATION OF CURRENT SYSTEM PERFORMANCE 52 7.2 ASUBJECTIVE JUDGMENT OF RELATIVE IMPORTANCE ... 53
7.3 IDENTIFICATIONS OF INVESTMENT ALTERNATIVES ... 53
7.4 COMPUTATION AND JUDGMENT WITH RESPECT OF UNCERTAINTY SIMULATION 54 7.5 SUMMARIZATION OF LIFECYCLE COST BY INVESTMENT ALTERNATIVES ... 56
7.6 COMBINE ANNUAL COST BENEFITS ALTERNATIVES WITH SYSTEM PERFORMANCE AND RISK PARAMETERS ... 57
8
Discussion and Conclusions ... 58
8.1 DISCUSSION OF METHOD ... 58
8.2 DISCUSSION OF FINDINGS ... 60
8.3 DISCUSSION OF ANALYSIS ... 60
8.4 CONCLUSIONS ... 63
8.5 IMPLICATIONS AND FUTURE RESEARCH ... 63
9
References ... 65
10
Appendices ... 71
APPENDIX 1 ... 72 APPENDIX 2 ... 73 APPENDIX 3 ... 74 APPENDIX 4 ... 76Contents
Figures
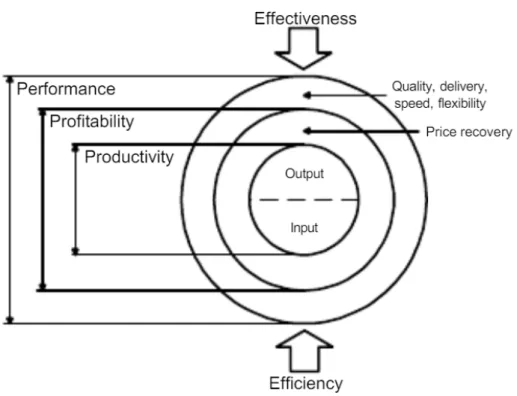
Figure 1 - Tangen’s (2002) Triple P Model ... 2
Figure 2 - Research Questions Process and Methods ... 8
Figure 3 - Process of Selecting Studies (Booth, et al., 2016) ... 9
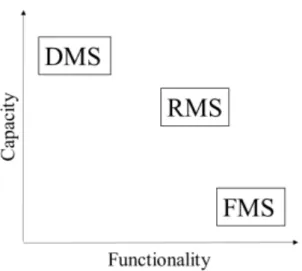
Figure 4 - Capacity and Functionality Mapping of Manufacturing Systems ... 18
Figure 5 - The System Aspect, Reconfigurability-Lingo and Product Structure (ElMaraghy & Wiendahl, 2009) ... 18
Figure 6 - Conceptual Decision Support Tool ... 52
Table
Table 1 - Outcome of Literature Search Process ... 11Table 2 – Interviews ... 13
Table 3 - Documents Received ... 13
Table 4 - Manufacturing Requirements (Bi, et al., 2008) ... 19
Table 5 - Key Performance Indicators Found in the Literature ... 23
Table 6 - ISO Standard 22400 ... 24
Table 7 – Software Investment Process (MacStravic & Boucher, 1992) ... 26
Table 8 – Capital Prioritization Techniques ... 28
Table 9 - Manufacturing Readiness Levels (Madison, et al., 2015) ... 30
Table 10 - System Capability Aspects ... 33
Table 11 - Productivity Aspects ... 34
Table 12 - Flexibility Aspects ... 35
Table 13 - Quality Aspects ... 36
Table 14 - Risk Aspects ... 37
Table 15 - Key Performance Indicators with High Relationship ... 38
Table 16 - Key Performance Indicators with Medium Relationship ... 38
Table 17 - Key Performance Indicators with Weak Relationship ... 38
Table 18 – Key Performance Indicators and Data Points ... 39
Table 19 – Non-Standardized Key Performance Indicators ... 41
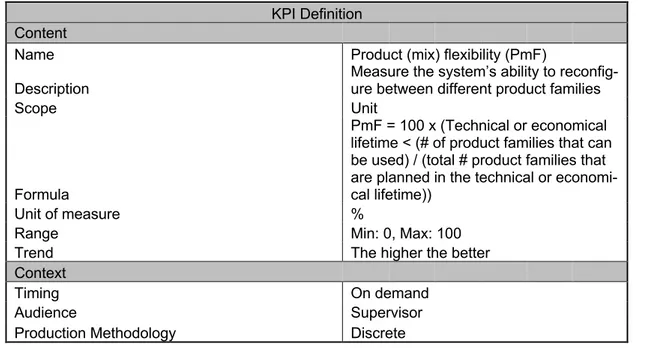
Table 20 - Product (mix) Flexibility ... 44
Table 21 - Definition of Smallest Incremental Capacity and Existing Capacity ... 44
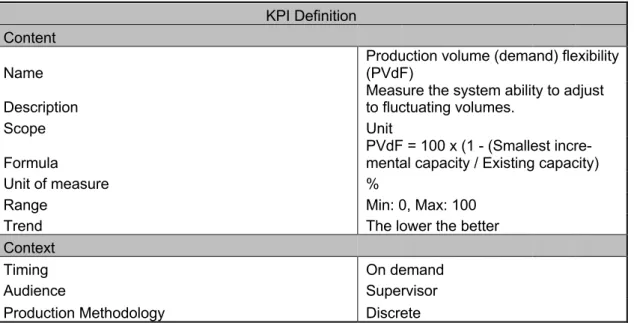
Table 22 - Production Volume (demand) Flexibility ... 45
Table 23 - Definition of Data Points within Material Handling Flexibility ... 46
Table 24 - Material Handling Flexibility ... 46
Table 25 - Reconfiguration Quality ... 47
Contents
Table 27 - Definition of Time to Repair and Mean Time between Failures (ISO, 2014)
... 49
Table 28 - Diagnosability ... 49
Table 29 - Mapping of Data Points ... 50
Table 30 – Conceptual Decision Support User Workflow Process ... 51
Table 31 – Performance Parameters ... 53
Table 32 – Example of Mix and Volume Fluctuations ... 54
Table 33 – Example of MRL Requirement Evaluation ... 55
Table 34 – Example of MRL Risk Trigger Events ... 56
Table 35 – Example of Lifecycle Cost by Investment Alternative ... 56
Equations
Equation 1 - Material Handling Flexibility ... 45Equation 2 - Reliability of Machines in Series ... 46
Equation 3 - Reliability of Machines in Parallel ... 47
Equation 4 - Utilization Efficiency ... 47
Equation 5 - Fault Identification ... 48
Equation 6 - Actual to Planned Scarp Ratio ... 48
Equation 7 - Fault Detection ... 48
Equation 8 - Optimization Formula for Investment Decisions ... 51
Equation 9 - Market Risk ... 54
Introduction
1
Introduction
This chapter intended to introduce the origins, purpose, and research questions behind this report by describing the challenges that arise in the manufacturing industry and how global competition forces companies to invest in projects that lead to both perfor-mance and profitability. The later part of the chapter contains delimitations and out-lines for the thesis.
1.1 Background
The pace of societal change is often described to be at an immense level, and the per-ception that this development will continue makes the ability of adaptation crucial (Rip-pela, et al., 2016). Manufacturing systems are always affected by external factors (cus-tomer-driven) and internal (company-related) (Van Mieghem, 1998). External changes could, for example, be products, technology, customer demand, and demands for cus-tomization. Internal factors include business strategy and volume-related challenges (Koren, 2010). With the increased amount of uncertainty, the acquisition of appropriate production equipment is difficult for upcoming product generations (Rippela, et al., 2016).
Capital budgeting involves a long-term decision-making process that determines the best investment in capital goods, such as plant, production equipment, but also other projects worth pursuing in terms of expected benefits (Fechter, et al., 2019; Rashidi-Bajgan, et al., 2010). The main purpose of investments includes generating future cash flows for the organizations (Rashidi-Bajgan, et al., 2010), and capital budgeting histor-ically prioritizes projects based on the maximizing economic utility to the firm (Nelson, 1986). However, competitive markets require multiple objective considerations while doing so (Kahraman & Tolga, 1998). Minimizing the capital cost of equipment, max-imizing productivity, minmax-imizing performance disturbance, ensuring high quality, pre-dicting future trends, and rapidly addressing market shifts are all objectives that need to be considered while investigating different options (Kahraman & Tolga, 1998). The extensive use of, and free interpretations of words like productivity and performance have led to misunderstandings. These words have thus become ambiguous terms, which need clarification (Tangen, 2002). Tangen (2002) has developed a model, which ex-plains the relationship between performance, profitability and productivity, input, out-put, effectiveness and efficiency. Productivity is the result of all products produced with the required quality (output) divided by all the resources consumed within the transfor-mation process (input). Profitability is the quotient of input and output but is influenced by price-factors (price-recovery). As an umbrella term, performance aims to involve non-cost factors, such as speed, quality, delivery, and flexibility into manufacturing excellence. Effectiveness addresses the factors that are involved with the output of the transformation process, where efficiency is related to the utility of the input resources. The model is illustrated in Figure 1.
Introduction
Figure 1 - Tangen’s (2002) Triple P Model
A company’s profitability strategies have historically been based on economies of scope or economics of scale, which have affected the manufacturing systems to be de-veloped to focus on either capacity or functionality (Koren & Shpitalni, 2010). A ded-icated manufacturing system (DMS) is built to manufacture an individual product with high capacity (Mehrabi, et al., 2000). The upside of this concept involves the potential of reaching extensive throughput cost-effectively with the high utilization of tools and machines (ElMaraghy, 2006). However, this comes at the expense of the ability to pro-duce a variety of products since most product changes require modifications of the man-ufacturing system, which, as a result, adds extra investment costs and rebuilding time (Koren, 2010). Flexible Manufacturing System handles a high level of flexibility and functionality but is restricted to its capacity. In reality, this means that the system can produce a variety of products on the same line, but the rate of production is low, and the cost of equipment acquisition is much higher (ElMaraghy, 2006).
Reconfigurable manufacturing systems (RMS) was developed to cope with foregoing challenges and to stay competitive by cost-effectively responding to quick market changes in product variety and capacity (Koren, 2014). Companies do often have com-ponents or machines that are aligned with the philosophy of RMS, but to fully utilize the concept, firms have to adopt new policies and change their mindset in order to gain system benefits (Koren, et al., 1999). However, every organization needs to adopt the appropriate manufacturing setup for their specific conditions. An assessment model should be used to ensure whether the concept is applicable for their circumstances and how to invest in these capabilities towards a sustainable future in economic and envi-ronmental terms (Bergström & Jödicke, 2019). Bergström and Jödicke (2019) have de-veloped an assessment model to ease this problem by mapping and evaluating the
Introduction
system effects of different system characteristic enablers. The usage of assessment models helps organizations to understand the current system capabilities and con-straints, which creates possibilities of setting improvement targets to be more respon-sive to internal and external changes. Even if the company decides to choose another manufacturing system, the firm can still have an open mindset and decide upon which reconfigurable level to have in a certain line or machine (Andersen, et al., 2018).
1.2 Problem Description
Electrical engines are currently acting as a disruptive innovation within the automotive industry. This forces companies to switch partly or extensively from internal combus-tion engines to plug-in hybrids and battery electrified engines (Hertzke, et al., 2018; Wu, et al., 2019; IEA, 2019). New product parts and technologies create significant disruptions and fundamentally change the way engines have been manufactured over the last century. This development creates a higher level of uncertainty for the produc-tion department to plan for future processes, machines, and equipment needs (Wu, et al., 2019). Industry consultants perceive that the demand of product mixes and produc-tion volumes are difficult to estimate in the upcoming ten years, but it is the expected lifetime of many machines and equipment that needs to be purchased today (Hertzke, et al., 2018; Wu, et al., 2019; IEA, 2019). To cope with the higher level of risks, an increased amount of flexibility is needed since it acts as a “counterbalance” to uncer-tainty (Newman, et al., 1993). Kampker, et al. (2013) claims that there are three main kinds of flexibility that need to be addressed in a manufacturing system. Product flexi-bility describes the aflexi-bility to produce a changing set of products without significant changes to the system as replacement and development of resources. Mix flexibility ex-plains the system's ability to produce a variety of products in the same system. The third mentioned type is volume flexibility, which explains the system’s ability to vary the volume of the products without a significant change in production costs (Kampker, et al., 2013).
One problem connected to the extensive focus on non-flexible equipment includes when product lifespans decrease to the point where manufacturing equipment cannot get the return on investment, in other words, some types of machinery will be outdated by its technical maturity lifetime before the economic lifetime. This implies that large machine purchases need to be depreciated in a shorter period, or accounting gets a lump sum for the remaining depreciation when the machine becomes obsolete. This will oc-cur in organizations where investment cycles are closely related to product cycles and, thus, create a short-term purchasing strategy. More uncertainty is created if the manu-facturing department cannot expect the equipment to be used in new generations of product families or different platforms since it might require a different technology. Implementing reconfigurable manufacturing system concepts generate value to the firm by its utilization of capacity with high levels of flexibility (Andersen, et al., 2018). Nevertheless, RMSs tends to have a higher purchasing cost than specially designed equipment for a sole purpose. Therefore, it is challenging to motivate a cost to handle the uncertainty of product, mix, and volume. The transition from an existing
Introduction
manufacturing system towards reconfigurability needs investments. It could differ be-tween purchases of entire systems to individual workstations and tools. Usually it is not possible to purchase a new line to apply the philosophy, instead incremental invest-ments are applied. Nevertheless, the investment procedures and techniques have not changed, which makes it difficult to value the monetary benefits of flexibility in a nor-mal discounted cash flow technique (Rippela, et al., 2016). The current state needs to be addressed to know if the investment leads to system improvement. One method of evaluating system performance involves key performance indicators that are aligned to the firm’s overall strategy and goals. The literature has investigated the economic fea-sibility of reconfigurable manufacturing systems concepts in general terms. On the other hand, no one has created a decision support tool that motivates and justifies step-wise investment decisions on equipment and machine levels with associated system performance changes generally and reconfigurability, in particular.
Scenarios with high numbers of data and multiple-objective approaches create chal-lenges for decision-makers to make a rational decision considering the difficulties in analyzing and collating all relevant data. The decision support tools can function in this environment, and the academy has proven to be an adequate method for dealing with this kind of problem as it collects information and suggests the optimal solution based on programmed prerequisites (Kalbar, et al., 2016). Since the concept is presented, de-fined and developed in the academia: information, sociolects and knowledge barriers arise to the industries. Is there a way to integrate well-known industry terms for defining performance? According to Tangens (2002) definitions, the paper aims to combine overall performance with profitability and productivity measurements within a model. This focus can enlighten the financial benefits of implementing the reconfigurable man-ufacturing system and create transparency to see how investments can refine the pro-cess. In summary, the developed model is intended to be used to invest in the right types of enablers to maximize its intended system performance for a minimal cost.
1.3 Purpose and Research Questions
The purpose of the study is to set a direction for further research of decision support tools that supposed to maximize the expected economic utility of stepwise investment towards a reconfigurable manufacturing system setting. By doing so, the first research questions address the current reconfigurable manufacturing system performance with key performance indicators:
• RQ 1 - How can standardized key performance indicators be used to display the current and expected performance of a reconfigurable manufacturing system? • RQ 2 – How can reconfigurable system characteristics support the development
of new key performance indicators where the academia lacks bearing?
The knowledge of system performance is supposed to be used to evaluate investment alternatives and their effect on performance and reconfigurability measurements. The operational terms can now be set in comparison with financial parameters and risks to feed data into decision support tools that can help firms to optimize economical utility.
Introduction
• RQ 3 – How can a conceptual decision support tool be structured to facilitate stepwise investment decisions with associated key performance indicators? 1.4 Delimitations
The paper will exclude articles from the scientific field of key performance indicators that do not interact and/or comply with the reconfigurability concept. The investment field is tilted towards understanding which methods are used for valuation in uncer-tainty since it is the counterbalance to flexibility and, therefore, excludes scientific re-search. The idea is not to develop a solid mathematical model but a direction for which aspects should be considered when developing and programming a decision model. The following list will mention the more detailed delimitations that the report assumes.
• The report will not cover uncertainty in a macro-financial perspective.
• There are many kinds of key performance indicators, and this report will not cover KPIs that do not involve the internal processor/and economic factors. • The tool will be developed for an existing factory with an associated machine
fleet that wants to calculate replacement equipment investments and will hence not prepare for new manufacturing system creation.
• The analysis will be conducted for the factory and system-level but will be pre-pared for the implementation of the workstation level.
• The report will not cover any analysis of the organizational structures but is mentioned for understanding.
• The report aims to study the relationship between system performance of dif-ferent machines with monetary values and, thus, will mention but not analyze the workers' or environmental interactions with the machines and their effects. 1.5 Outline
The report is divided into eight different chapters, where the first introduces the reader to the topic and gives a background to the problems that arise in relation to the topic. This is followed by defining the purpose, which results in three different research ques-tions. The chapter ends with setting boundaries and describing the outline. The method part, chapter two, is divided into several sections that describe the study approach and how the author has structured the work to achieve credibility. Chapter three builds a theoretical background for the subject by describing reconfigurable manufacturing sys-tems, key performance indicators, investment decisions and manufacturing readiness level. It is followed by chapter four, which gives insights about the focal company cir-cumstances. The subsequently three chapters provides the analysis methods and argu-mentation to answer each research question separately, chapter five introduces the found key performance indicators and the standardization phase used. Chapter six pre-sents the newly-composed indicators in relation to RMS core characteristics, and the next chapter helps to create a conceptual decision support tool towards reconfigurability transformation. Finally, a discussion and conclusion are made in chapter six, where
Introduction
recommendations for further research are given. Chapter six consists of references, and appendices can be found in chapter seven.
Method and implementation
2
Method and Implementation
In this chapter, it will be explained how the authors has chosen their approach to the studied problem and how they have proceeded the study. Techniques and methods will be presented and motivated throughout the chapter.
2.1 Research Approach
The phenomenon investigated in this thesis is related to how the industry motivates an investment that does not support current investment models. To understand how the industry works with key performance indicators (KPI) and investment models, the first research question (RQ) were constructed. The second RQ aims for an understanding of how academia defines reconfigurability and what key performance indicators can be combined. RQ 3 aims to understand how KPIs can be translated to fit and make a com-parable investment model for a reconfigurable manufacturing system (RMS). Com-pared to a production system (DMS/FMS) or if there are some substantial KPIs that need to be considered for an RMS.
Before the scope was set a pre-study, with initial unstructured interviews were carried out with a project manager from the focal company. This, along with several meetings with the school of engineering created a scope that should be aimed for. After the scope had been approved by all participants an initial literature search in the field was con-ducted to see what relevant theories that existed in the area. It also helped prepare for the latter literature search.
The conducted study aimed for an inductive approach with a theory generating reason-ing (Williamson, 2002). The strength of the approach is the open mindset as it helps the researchers to maintain and not disclose any alternatives. Although, constant reinter-pretation can lead to new important findings that need to be taken into consideration (Williamson, 2002). Since the maturity level of the chosen research area was low, the need for an explorative method (Booth, et al., 2016; Paul, et al., 2019), with clear con-text and rich data collection was needed. Therefore, a qualitative study was chosen. When conducting a qualitative study, the aim should not be to find a problem through the literature review instead the problem should be understood through interviews and other methods (Yin, 2016). This is supported by the approach as the problem has been identified through interviews.
A qualitative study by Booth et al., (2016) has a strength in being explorative, which supports the purpose of this study. Although it has weaknesses such as being time-con-suming and complex to carry out when gathering primary data (Paul, et al., 2019). The primary data was collected through interviews as a single case study in parallel with the literature review while the secondary data was gathered through a literature review and document study. A questionnaire was used to confirm the information by the rest of the department. Through gathering information from different methods, methods
Method and implementation
triangulation could be obtained which helped to strengthen the trustworthiness of the study and will be further described in 2.5 (Yin, 2016; Williamson, 2002).
To answer the research questions, the authors started with unstructured interviews fol-lowed by a literature review that should form the base of our knowledge within the research area. The following methods were used to answer the research questions and can be seen in Figure 2.
2.2 Literature Review
Through the literature review, the main goal was to identify, locate and analyze the current field of the chosen areas (Yin, 2016; Williamson, 2002). As the literature review brings a deeper understanding according to Marshall & Rossman (1995) as well as the correct context for it, it needs to be carried out in a systematic way to ensure all data has been collected. Through working in a systematic approach with techniques as Bool-ean and Phrase search in the different areas an efficient and explorative approach was carried out as described by Booth, et al., (2016). To ensure that the literature was con-ducted in a systematic approach it was important to register and motivate every step that was taken. The following model described by Tranfield et al., (2003) was followed during the analysis which is very similar to Wolfwinkel et al., (2011) model and has a proposed framework with 3 stages that consist of: Stage 1 - Planning the Review, Stage 2 – Conducting the review and Stage 3 – Reporting and dissemination. During the first stage, initial search was made and a plan for what areas the search should be conducted in was chosen. In the second stage in the Wolfwinkel et al., (2011) model, critical thinking and a process of ‘article analyzing’ were used to evaluate the articles found. The analysis tool was developed by Booth et al., (2016) and helped to select the most appropriate articles. The process was chosen due to its logic and transparency when selecting articles and can be seen in Figure 3 - Process of Selecting Studies Figure 3. In
How can standardized key perfor-mance indicators be used to display the current and expected perfor- mance of a reconfigurable manufac-turing system? Research Question 1 Research Question 2 Research Question 3 How can reconfigurability system characteristics support the develop- ment of new key performance indi- cators where academia lacks bear-ing? How can a conceptual decision sup-port tool be structured to facilitate stepwise investment decisions with associated key performance indica-tors? Li te ra tu re R ev ie w D oc um en t S tu dy
Method and implementation
the third stage all articles were broken down to what they said about the areas they were written about. The model also proposes a methodological order that is easy to follow and has a natural approach to handle the articles. By working in a structured way, it will increase the possibility to replicate the same work process that has been conducted.
2.2.1 Literature Search
The literature search was based on the pre-study that was conducted at the beginning of the project. Three main areas were located and divided into reconfigurable manufactur-ing systems, key performance indicators (KPI) in relation to RMS and investment de-cisions. Through an extensive literature research in these fields, the aim was to answer our three research questions.
The database and search engine Scopus were used that provide peer-reviewed articles from firms and journals that publish scientifically articles. The topics chosen for the search were conducted through a ‘boolean’ and ‘phrase search’ technique as described by Booth et al., (2016). Boolean search is a technique where different types of words i.e. AND, OR is used to perform a precise search (Booth, et al., 2016). The phrase search technique was used to search for specific words in the academia. When the search phrase was entered, the functions sorting tab were used to find the most relevant articles. Normally the tab is automatically in sorting mode for “newest to oldest” in sorting. Because the authors chose to do multiple searches that resulted in a variety of hits, sorting by relevance was considered to produce articles with a higher probability of reaching the study's scope than sorting the articles from newest to oldest. The anal-ysis was carried out according to the process in Figure 3 (Booth, et al., 2016). “1st
Round” – Title sift, “2nd Round” - Abstract read, “3rd Round” - full text and “final
re-sult” – articles included in the theory. Exceptions from the model were that, to make
Figure 3 - Process of Selecting Studies (Booth, et al., 2016)
Exclude studies that are not relevant based on title
Exclude studies that are not relevant based on abstract
Exclude studies that are not relevant based on full-text and document reasons why they do not
meet inclusion criteria
1stRound Title sift
2ndRound Abstract sift on studies
included at title
3rdRound Full-text sift on studies included at abstract level
Final Result Included studies for your
Method and implementation
sure all areas where covered from the articles, the literature technique snowballing as described by Yin (2016) was used. Interesting articles were picked and stored in a shared document on google drive to be further evaluated. In total 27 articles were cho-sen through the snowballing technique. The articles were chocho-sen from the topic in the text and then it followed the process from Booth et al., (2016) seen in Figure 3. The literature acquiring process of the different subjects will be described shortly and the search areas with associated search phrases will be displayed in Table 1.
Reconfigurable Manufacturing System - The thesis aims for a general and broad picture of the field to provide understanding of the concept, the relationships between system aspects within a firm and system characteristics. This resulted in the theoretical frame-work seen in chapter 3.1. The search words used for reconfigurability can be seen in the following Table 1.
Key Performance Indicators – The literature review for KPIs intends to give deeper understanding for data points (special data picked from the production which is added to an equation to form a KPI) and measurement which are related to reconfigurability characteristics to display manufacturing system capabilities and investment decisions effects of investments. The extract of this process is reported in chapter 3.2. The search words for KPI in relation to RMS can be seen in Table 1.
Investment Decisions – For this part (chapter 3.3), the focus is on understanding how the academy views investment and the capital budgeting process from a general per-spective, but also the reasoning about uncertainty and flexibility in procurement as ca n be seen in Table 1.
Manufacturing readiness level – The literature review conducted for manufacturing readiness level was conducted due to the focal company’s usage of the model and gave the authors a deeper understanding. The key factors to understand was the process and meaning of the criteria’s defined within the model. The search words for MRL can be seen in Table 1.
Method and implementation
Table 1 - Outcome of Literature Search Process
2.3 Case Study
In the following section it will be motivated why interviews, document analysis and questionnaire were chosen as case study methods in this study.
2.3.1 Case Selection
The case chosen to be studied was the investment process of acquiring new machineries at the focal company. Paul et al., (2019) and Williamson (2002) describes a case study as when developing an understanding of a social phenomenon in their natural setting
Search phrase using Scopus # of hits 1st round 2nd round 3rd round Result Reconfigurability
((“Reconfigurable Manufacturing Sys-tems” OR Reconfig*) AND (Production Systems OR “Manufacturing Systems”) AND Characteristics)
278 40 14 5 5
Key Performance Indicators
“Key performance indicators” AND “Reconfigurable manufacturing system”
7 6 3 3 3
(Reconfig* OR RMS)
AND (Manufacturing or Production) AND Assessment
381 40 15 9 9
("Key performance indicators" OR re-config*)
AND manufacturing AND assess-ment AND RMS
25 25 17 13 13
("KPI " OR "Key Performance indicator") AND ("manufacturing" OR "production")
1897 20 6 2 2
Investment Decisions
“Capital budgeting" AND (manufacturing
OR production) AND decision 96 9 6 6 6
"investment decisions" AND (manufac-turing OR production)
1867 40 21 6 6
"capital budgeting" AND parameters 94 11 2 2 2
"investment" AND reconfig* 913 14 8 8 8
"Cost calculation" AND reconfig* 11 2 2 2 2
Manufacturing Readiness Level
(“Manufacturing Readiness Level” OR MRL) AND Manufacturing
Method and implementation
which is unknown or poorly understood. The problem that was analyzed required a single-source case study where the problem was analyzed in-depth rather than widely. The methods should also give the authors the possibility to gather data without an ex-tensive knowledge in the area. Therefore, interviews and document analysis were cho-sen as main data gathering techniques. Although data collection techniques can be both from a quantitative- or qualitative approach as described by Paul et al., (2019). So, as a compliment, a questionnaire was chosen which can be a method of verifying the inter-views with one or several departments that share the same knowledge as the interview-ees.
Though researchers are arguing that case study design is too influenced by the level of the researcher and that the subjectively gets limited if the level of the researcher is too low (Yin, 2012; Williamson, 2002). If so, this could decrease the trustworthiness of the research (Yin, 2012). To decrease the influence from the authors an unstructured inter-view design was chosen which are further explained in chapter 2.3. As Yin (2012) de-fines unstructured interviews can be good to use when the interviewer’s knowledge within an area is low. Through conducting unstructured interviews, the interviewee gets the possibility to cover the area with the knowledge the person has.
2.3.2 Data Collection
Through the qualitative approach, data collection methods for this study has been gath-ered from techniques as interviews, document study and questionnaire. They are com-mon techniques used within qualitative studies (Paul, et al., 2019).
Interviews
The initial interviews that were carried out at the beginning of the project were of un-structured characteristics. The authors had little knowledge about the topic and needed to explore the area and see what data that could be collected. The interactions contained one or multiple people with the aim to gather data (Yin, 2016) and to gain knowledge about the specific topic with people from both the focal company and academia. The reason interviews were conducted with both people from the academia and the industry was to get an in-depth view on the complex problem (Leedy, et al., 2019; Williamson, 2002).
To be able to gather as much relevant data as possible, the most suitable interviewees was chosen together with the focal company. The unstructured interviews aimed to gather data on how they work with investment decisions and what key performance indicators are used in decision making. The interviews were conducted through eye to eye meetings or through skype where several of the interviews were audio recorded. Both authors were present at the interviews and a record with the persons involved can be seen in Table 2.
Method and implementation
Table 2 – Interviews
Unstructured Production engineer 1, Supervisor.
Project Description and initial thoughts, RMS
60 20200122
Unstructured Production engineer 2, Global director.
Project Description, initial thoughts, and RMS
60 20200225
Unstructured Production engineer 1. Updates from focal company project and RMS
30 Weekly
20200213- 20200318
Semi-structured Controller. Investment process 60 20200317
Document Study
Document studies were carried out to deepen the knowledge within the research subject and their internal processes in the focal company. Yin (2016) describes the strength in document studies and how it can help with the right context. Yin (2016) also raises the concern that the researchers need to be careful collecting the data as it cannot be known if the data has been refined. Although Skärvad & Lundal (2016) describe it as a good complement to other data collections methods.
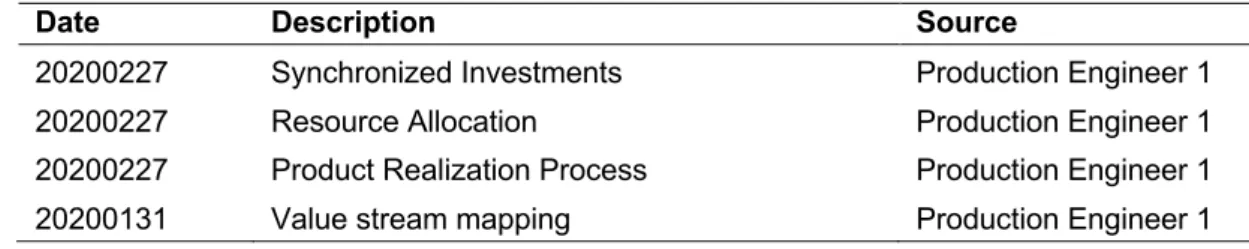
The documents that were received contained information about their KPI and were used to complement the literature review and understand how the focal company works with the information extracted from the production. It also gave a deeper insight into what KPIs and facts the top management look at when deciding in investments. The authors also received documents regarding their internal processes for projects and how differ-ent maturities on both products and production equipmdiffer-ent were calculated. The knowledge helped to construct questions for the interviews and create a better under-standing of the problem faced. The documents received can be seen in Table 3.
Table 3 - Documents Received
Data Analysis
The data gathered through interviews were compared to the literature review and doc-ument study to see similarities and try to find common KPIs and processes. This to find
Interview type Involved Topic Length (min) Date
Date Description Source
20200227 Synchronized Investments Production Engineer 1
20200227 Resource Allocation Production Engineer 1
20200227 Product Realization Process Production Engineer 1
Method and implementation
a framework that could found the base for the investment decision. The questionnaire was analyzed and compared to the model to see if all aspects were gathered. The three methods contribute to the triangulation of the data collection methods which increases the validity (Paul, et al., 2019; Williamson, 2002; Yin, 2016). The analysis can be com-pared to Yin (2016) five-phase cycle, which contains the following steps: 1 – Compil-ing, 2 – DisassemblCompil-ing, 3 – ReassemblCompil-ing, 4 – InterpretCompil-ing, and 5 – Concluding. Through the literature study and the interviews at the focal company, it was clear that the reason a company invests in a reconfigurable manufacturing system depends on variables as ‘operational performance’, ‘financial’ and ‘uncertainties’. The data col-lected through the literature search was compiled into the different variables defined above. The data collected was then disassembled within each variable and further lyzed. For operational performance, it required a more in-depth analysis. The data ana-lyzed was reassembled into subcategories within each element. When the structure was clear, the data points were matched to the ISO- standard to increase the transferability and generalizability. The data points and their belonging KPIs that could not be matched to the ISO – standard was redefined, and new data points were created that could be matched with performance measurements.
When operational performance, financial and uncertainties were defined the decision investment model could be structured. The first step in the model is to present the rea-sons and give the reader a deeper understanding of RMS and the investment it will present. The second step is to fill up all the data points defined in operational perfor-mance and put in how the system should change. Also, constraints should be filled in here, so specific goals can be achieved or taken into consideration. Then current status is mapped along with KPIs defined and the financial and uncertainty parameters taken from the second step. Also, a page with the future state is autogenerated with the infor-mation filled in, in step 2. In the future state, several scenarios will be displayed for each configuration that will highlight different possibilities. Current status and future state are then compared and are summarized in a result page where various pivot tables display interesting data.
2.4 Creation of Key Performance Indicators
When creating a new KPI, a lot of information needs to be described so everyone can understand and see the purpose of the KPI. The KPIs were developed in accordance with ISO 22400 (2014) in regards to defined key parameters as: name, description, scope, formula, unit of measure, range, trend, timing, audience and production method-ology criteria was followed (Zhu, et al., 2018).
The KPIs were defined from the literature as it created the foundation for what param-eters were missing. They were then explained according to the model by Li, Charlotta, Martina and Massimiliano (2018) and key information was displayed. Data points were then matched against the ISO 22400 – standard (2014) to see if it were possible to match the data points.
Method and implementation 2.5 Enhancement of the Credibility
To motivate the study’s trustworthiness the authors need to obtain a meaningful result that can create reasonable conclusions and that can be defended through facts (Paul, et al., 2019). Conventional methods like internal/external validity and reliability are not appropriate to use when investigating the trustworthiness of qualitative studies accord-ingly to researches (Paul, et al., 2019; Yin, 2016; Halldorsson & Aastrup, 2003). In-stead, they propose an approach called Trustworthiness which the authors have chosen to follow as it is designed for qualitative studies. The concept has the following parts: credibility, transferability, dependability, and conformability. Each concept contains a set of strategies to strengthen the trustworthiness of the study (Halldorsson & Aastrup, 2003).
2.5.1 Credibility
Credibility is the ability to obtain results, draw conclusions and that the interpretation of gathered data finds credible by other researchers (Paul, et al., 2019). Through choos-ing an approach that fit the study and followchoos-ing the process connected to that approach, important steps towards increased credibility are taken. By building a base with an ex-tensive literature review to support detailed explained data gathered from well-known techniques and appropriate methods that correlate to qualitative studies, conclusions and relations are well supported. It also gives the reader the ability to draw their own assumptions and conclusions from the study and judge the credibility.
2.5.2 Transferability
For qualitative studies, a reoccurring problem is to strengthen their transferability since the problem often is specific and is surrounded by its own context. Williamson (2002) explains the problem as, subjectively can vary depending on how well, the researchers can carry out various techniques and the uniqueness of every case. However, keeping the transparency through all data gathering techniques will increase the transferability. As when creating the literature-base that has support and backed up statements from the case studies as well as method triangulation important factors of transferability can be strengthened (Paul, et al., 2019; Yin, 2016).
2.5.3 Dependability
Through the method chapter of this study, the process was described, and the authors have tried to be as transparent as possible. Every decision has been carefully explained and motivated. (Halldorsson & Aastrup, 2003)
2.5.4 Conformability
To achieve a high degree of conformability it is important to show that no opinion has been reflected in the result from the authors (Halldorsson & Aastrup, 2003). In the study, several actions have been taken to decrease the level of biases, for example: each area in the literature study is described through multiple sources, data is analyzed
Method and implementation
through models chosen from a qualitative perspective and carefully explained in this chapter.
Theoretical Background
3
Theoretical Background
The theoretical background starts with defining reconfigurable manufacturing system (RMS) and motivate the authors choice of characteristics. The chapter ‘Key Perfor-mance Indicators in Relation to Characteristics’ presents the existing literature on Key performance indicators that has been created in different characteristics. The invest-ment decisions chapter has been categorized into three different parts, one chapter aims to present the various ways of analyzing investments on a general basis, others will handle and map the current financial investment evaluation methods, non-financial methods, and methods of investigating and handling uncertainties.
3.1 Reconfigurable Manufacturing Systems
Customer trends involve more product alternatives, customization and personalization with increased frequency of new product generations and associated launches (Koren, 2006). These challenges need to be addressed within both product and production de-velopment. The current method of handling these trends within product development has been connected to the usage of modular product architectures, product platforms and product families. However, a similar method has not been historically applied to handle the complexity within production before the implementation of reconfigurable manufacturing systems (RMS). While developing manufacturing systems, considera-tion should be given to the type of uncertainty that needs to be addressed in the organ-ization (Mehrabi, et al., 2000). Reconfigurability has a way of addressing these chal-lenges by being more responsive, which contributes to the method being more suitable than traditional perspectives (Koren, 2006). The concept of RMS was proposed in the 1990s and is designed around parts families and consists of mixes of flexible, dedicated machines and reconfigurable tools to facilitate a changeable system of functionality and capacity in a cost-effective manner. The relationship between capacity and functionality is displayed in Figure 1Figure 4, where dedicated (DMS), flexible (FMS) and reconfig-urable manufacturing systems have been mapped. Koren (2010), defines the concept as:
“Reconfigurable manufacturing systems are designed for rapid change in structure, as well as in hardware and software components, in order to quickly adjust production capacity and functionality within a part family in response to sudden changes.”
It is fundamentally important to design and adjust the structure to the intended parts or product family when working around RMS (Koren & Shpitalni, 2010). Therefore, in order to compete with FMS and DMS, the manufacturing system can only be compara-ble to the product or parts family that it was designed for (Koren, 2006). However, the system facilitates the favorable circumstances of responsiveness to changes and the pacity to be consistently versatile while keeping the requirements of functionality, ca-pacity and cost (Koren, 2006).
Theoretical Background
Figure 4 - Capacity and Functionality Mapping of Manufacturing Systems (Koren, 2006)
Reconfigurability can be constructed on different system aspects levels. Wiendahl et al. (2007) have eased the communication of an organization’s hierarchical structure by mapping the technical and human resources into six levels. The highest level involves all sites in the organization and is called network-level. Individual site level involves buildings and its infrastructure, thus named factory-level. The third level segment im-plies all processes needed for a ship-ready product, where system-level instead ad-dresses all processes used for manufacturing variants of a product. Cell-level means a group of workstations and material handling that refines the product, where work-stations are defined as the lowest level, which includes machinery and tools that add value to the product. Higher levels are usually affected by strategic goals, visions and policies, and these decisions affect all underlying structures, but small changes in work-stations, however, might not generate any major impact on the higher levels (Andersen, et al., 2015). In summary, all these levels are interdependent of each other; therefore, it is important to know that changes more or less affect the other levels (Wiendahl, et al., 2007). The following Figure 5 by ElMaraghy & Wiendahl (2009) illustrates the differ-ent system aspects with associated reconfigurability lingo and product structure.
Figure 5 - The System Aspect, Reconfigurability-Lingo and Product Structure (ElMaraghy & Wiendahl, 2009)
Theoretical Background
3.1.1 Key Performance Indicators in the Different Levels
Connecting to the levels in Figure 5, each level has its own set of KPIs which is trans-lated to the responsibility each manager has. Björkman (2019) maps and conclude that a clear definition needs to be constructed within the organization and communicated in an efficient way for each KPI. Otherwise its usefulness can be perceived differently though the organization. Bhatti, Awan and Razaq., (2014) expresses the importance of having a clear definition of the KPIs, as it is the only way for the organization to check if they are going in the right direction. It also gives them the opportunity to evaluate and control the overall business. Although Raza, Muhammad and Majid., (2016) argues that KPIs are not always easy to measure and to know which should be measured could also bring some challenges.
3.1.2 Understanding Driving Forces and Strategies
Bi, Lang, Shen and Wang (2008) concluded that in order to measure the performance an RMS the contribution to the manufacturing system needs to be assessed through what an RMS wants to achieve. Bi, Lang, Shen and Wang (2008) have mapped the underlying customer demand incentives and converted these into four manufacturing requirements with associated strategies. These are being shown in Table 4.
Table 4 - Manufacturing Requirements (Bi, et al., 2008)
Manufacturing requirements Strategies
Short lead time Elimination
Capability Structure Ramp-up
More variants Modularization
Capability Reconfigurability
Low and fluctuating volumes Modularization
Manufacturing Assembly
Low price Cost
Productivity Rewards
3.1.3 Reconfigurable Manufacturing Systems Characteristics
When designing a reconfigurable manufacturing system, it needs to be from a perspec-tive where hardware and software are prioritized (Koren, 2006). This so the integration of new modules can be carried out quickly and reliable (Koren, 2006). If so, the system will have the ability to be flexible, not just within a product family but with several product families (Andersen, et al., 2018). Koren (2006) has made an in-depth review of what is it that influences the RMS and suggests that RMS contains six characteristics:
Theoretical Background
scalability, modularity, diagnosability, integrability, convertibility and customization. These are the most common core characteristics mentioned by Napoleone, et al. (2018a) in the literature and has therefore been chosen for this study.
Scalability
Scalability can be defined as the ability to change capacity up and down rapidly and economic sustainability (Napoleone, et al., 2018a). A good way of working with sus-tainability is defined by ElMaraghy (2006) and is through working with the number of shifts/workers and line balancing.
Modularity
Modularity has been defined by Koren et al., (1999); Napoleone et al., (2018a) as ma-chine modules that can be quickly changed between different manufacturing modules. To achieve a high level of modularity with little cost and effort, a standardized interface that works for all the machines needs to be defined/constructed (Koren, et al., 1999; Mehrabi, et al., 2000; Napoleone, et al., 2018b).
Diagnosability
Diagnosability can be defined as the ability of how quickly a large system can identify either a quality or reliability error (Mehrabi, et al., 2000). Koren et al., (1999) talks about the importance of ramp-up time as the diagnosability needs to be able to detect faulty parts to quickly reduce waste and ramp-up time. Napoleone et al., (2018a) also describe diagnosability as the ability to correct the fault quickly in an operational con-text.
Integrability
Integrability can be defined as the components ability to be removed or integrated into the manufacturing system with the least impact as possible (Koren, et al., 1999; Mehrabi, et al., 2000). The character of the integrability could be both hardware and software as both programs and machines can change over time (Napoleone, et al., 2018a).
Convertibility
Convertibility is related to the ability to change from one batch to another (Koren, et al., 1999). This can be related to change of equipment, tool and can sometimes even require a manual change. Mehrabi (2000) defines convertibility as the ability to make a quick changeover from existing products and to quickly adapt the system for future products.
Customization
Through designing the systems hardware and software a.k.a capability and flexibility with the product family it can achieve customization (Mehrabi, et al., 2000). Koren et al., (1999) describes it as well with two aspects:
• Customized flexibility - the flexibility that is built into the machines to handle the product family
Theoretical Background
• Customized control – that is the open architecture that can allow the machines to be controlled so the exact function can be chosen.
3.2 Key Performance Indicators
Key performance indicator is a way of measuring the performance of the work carried out in a company. It can be the top management explaining a KPI to a middle manager and his department so they can set their own goal in order to reach the overarching goal. Often, companies tend to come up or chose which KPIs are the most important for just their company. Sometimes they adjust already existing KPIs, although the most im-portant thing, is that the KPIs chosen are well communicated to the lower parts of the organization.
3.2.1 Existing Key Performance Indicator Structures in Reconfigurable Manufacturing Systems
The academia has different ways of addressing and calculate various characteristics in RMS. Although academia lacks research in models that contain all elements of the RMS system (Khanna & Kumar, 2019), articles that have structured one or multiple charac-teristics to create a framework for investments can be seen but they do not conclude the holistic picture. A good example that contains the overall view is presented by Mittal and Jain (2014) where they give an introduction to RMS and its core characteristics as they define as modularity, scalability, convertibility and diagnosability. They then pro-ceed to explain how KPIs can be defined within each characteristic. They then connect each KPI with their characteristic and the influence each characteristic has on each other. Furthermore, Khanna and Kumar (2019) are mapping the field of RMS and have done an extensive literature review. They draw conclusions about which areas that had the biggest impact depending on the number of articles published about the area but also where future research needs to be attended. The lack of research lay within diag-nosability, integrability and convertibility. It also shows that the most common way of putting all the information together is from soft computing (Khanna & Kumar, 2019). Within the characteristics there exist theories that try to explain how you can improve various settings. Lee (1997) talks about the possibility to design a component after cer-tain data points and KPI that will help the product fit in a reconfigurable manufacturing system. Then the design is evaluated in the system through formulating KPI that as-sesses the system. Goyal, Jain and Jain (2012b) has identified a gap in the literature where the interactions between the modules on a machine level have not been thor-oughly investigated. Since integration is an important characteristic for making recon-figurability efficient Goyal et al., (2012b) proposes a comprehensive approach to find the best solution. The approach makes a clear trade-off for responsiveness and economy where the first one is to be prioritized to increase the integrability.
Xie, Xue and Zheng (2009) have created a performance evaluation system where they analyze the manufacturing system as a whole through six aspects, economy, capacity & functions, reconfigurability, reliability, environmental friendliness and risk. The as-pects are then further categorized to analyze the manufacturing system, the authors have
Theoretical Background
chosen 20 KPIs that have the intention to address the manufacturing system as well as evaluating the RMS
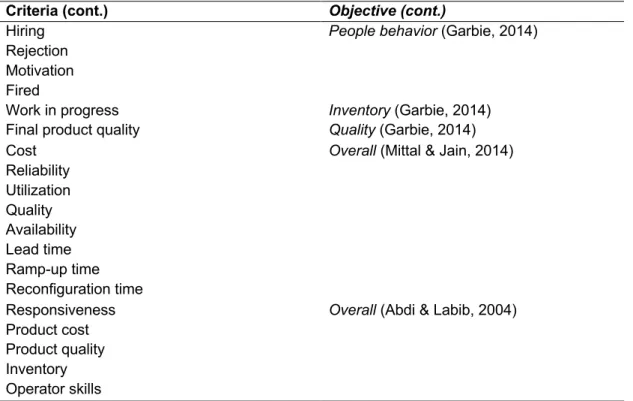
Abdi (2009) Has defined seven criteria’s capacity, functionality, operating cost, quality, overhead cost and capital cost that needs to be assessed in order to measure the level of a reconfigurable manufacturing system. The model builds fuzzy numbers and the rela-tion between the KPIs found and creates scenarios so the best solurela-tion can be chosen. Garbie (2014) identifies the need of evaluating an RMS together with performance measurements cost, response, system productivity, people behavior, inventory and quality as the critical objectives for an organization are highly dependent on the manu-facturing system. Garbie (2014) states that an RMS can be evaluated in both quantita-tive and qualitaquantita-tive measurements but to be able to compare it with the performance measurements a qualitative approach was chosen.
Mittal and Jain (2014) define eight performance parameters that need to be accounted for when deciding the most optimal configuration strategy. They further explain how to calculate a configuration of a machine in the most economical way and what param-eters are important for that specific part.
Abdi & Labib (2004) discuss the importance of analyzing the manufacturing system before designing an RMS. They propose a model that stresses the importance of capac-ity and functionalcapac-ity during the reconfiguration phases in an RMS. The model is de-signed to handle both technical and economical perspectives to give the best feasible study.
Bi, Lang, Shen and Wang (2008) have identified that RMS cannot be evaluated with system performances through its characteristics. Instead, the system needs to be trans-lated to what it needs to achieve. Bi, Lang, Shen and Wang (2008) explain that a man-ufacturing system’s core characteristic is to develop the following manman-ufacturing re-quirements shown in Table 4. The Rere-quirements will not only enhance the whole man-ufacturing system but also the elements that affect the RMS.
Theoretical Background
Table 5 - Key Performance Indicators Found in the Literature
Criteria Objective
Design cost Economy (Xiaowen, et al., 2009)
Reconfiguration cost Running cost
System productivity Capacity and functions (Xiaowen, et al.,
2009) Equipment Utilization
Process Capacity limits Balancing
Equipment reconfigurability Reconfigurability (Xiaowen, et al., 2009)
Process reconfigurability Logistic reconfigurability
Ramp-up time Reliability (Xiaowen, et al., 2009)
Diagnosability
Mean time between failures System availability
Optimal use of resources Environmental friendliness (Xiaowen, et al.,
2009) Security
Friendly interface
Technology risk Risks (Xiaowen, et al., 2009)
Organize risk Market risk
Set-up time Capacity (Abdi, 2009)
Changeover time Varity
New product introduction Functionality (Abdi, 2009)
Mobility Volume
Labour Operating cost (Abdi, 2009)
Maintenance Work in progress
Convenience of use Quality (Abdi, 2009)
Reliability Accuracy Compatibility
Price Capital cost (Abdi, 2009)
Install
Tools and fixtures
Overhead cost Overhead cost(Abdi, 2009)
Efficiency Performance (Abdi, 2009)
Risk Safety
Manufacturing cost Cost (Garbie, 2014)
Overtime cost Additional cost
Material Handling Flexibility Response (Garbie, 2014)
Production Volume (Demand) Flexibility Product (Mix) Flexibility
System utilization System productivity (Garbie, 2014)
Manufacturing lead time Production Rate
Theoretical Background
Criteria (cont.) Objective (cont.)
Hiring People behavior (Garbie, 2014)
Rejection Motivation Fired
Work in progress Inventory (Garbie, 2014)
Final product quality Quality (Garbie, 2014)
Cost Overall (Mittal & Jain, 2014)
Reliability Utilization Quality Availability Lead time Ramp-up time Reconfiguration time
Responsiveness Overall (Abdi & Labib, 2004)
Product cost Product quality Inventory Operator skills
3.2.2 ISO-Standard 22400
When developing new KPIs or changing already existing KPIs to fit into a new formula or meaning it is important to use some sort of already rooted theory. A good example of rooted theories within the manufacturing industry is standards (2014). Through the following standards, a broader perspective can be taken and the possibility for more companies to use the same model or framework is possible. Through looking at ISO standard 22400 (2014) 37 KPIs could be identified with 51 data points as a basis. These can be seen in Table 6.
Table 6 - ISO Standard 22400
ISO – Standard 22400 KPI headers Quantity
Planned times 5 Actual times 14 Maintenance times 6 Logistical elements 16 Quality elements 9 3.3 Investment Decisions
There are multiple approaches that need to be addressed in terms of analyzing an in-vestment. A common approach includes cost-calculations. Fechter, et al. (2019) have
Theoretical Background
developed a cost calculation model with a leasing approach of manufacturing equip-ment were fixed cost is being held by an external, fictive departequip-ment, and the variable costs with leasing fees act as a basis for determining the feasibility of the investment. The model is motivated by the fact that shorter product lifecycles will lead to the ina-bility to bear their own expenses and initial investment decision (Fechter, et al., 2019). Heilala, et al. (2008) does account for the production system life cycle, changeability, and reconfigurability analysis apart from the provided cost calculations by looking at the total cost of ownership during its lifespan.
Discounted cash flow techniques such as: discounted cash flow (DCF), net present value (NPV) and internal rate of return (IRR), have traditionally been the dominating investment criterion within the field, but these procedures tend to ignore the upside potential of management flexibility (Jiao, et al., 2006). As reconfigurable manufactur-ing systems (RMS) are developed to handle quick changes and fluctuatmanufactur-ing market de-mand, Fecther, et al. (2019) argues that the traditional evaluation methods and tools fail to account for the benefits reconfigurable systems can provide for the firm (Abdi & Labib, 2004).
A sole focus on cost fails to account for improved customer satisfaction, capacity changes, functionality degree, and reconfiguration time and cost (Abdi & Labib, 2004). To handle this, Abdel-Kader (1999) proposes a framework of measuring the expected performance of a reconfigurability-investment in three different aspects. The first as-pect handles the financial returns of the investment in a traditional capital budgeting technique, the second approach evaluates the investment form non-financial criteria, and the third perspective involves risk (Abdel-Kader, 1999). Another multi-approach is carried out by Heilala, et al. (2008) that have developed a cost calculation that also considers the production system lifetime and its ability to change and reconfiguration. Furthermore, Abdel-Kader (1999) suggests transforming results from different aspects into fuzzy numbers to merge the analysis and provide a concluding value for invest-ments. Rashidi-Bajgan, et al. (2010) have developed a model with a mathematical pro-gramming approach within a fuzzy environment to address the multi-variable capital budgeting problem.
Valuing flexibility is a difficult task accordingly to Kulatilaka (1988), but the benefits of flexibility include changes of indirect and direct cash flows, its ability to handle un-certainty, but also nonpecuniary effects such as learning value. Andersen, et al. (2018) also stresses the importance of considering the uncertainties within the calculations when evaluating and justifying investment decisions of new reconfigurable equipment as it is the main driver of implementing the reconfigurability concept. The downside of the notion is that reconfigurable equipment creates an initial higher procurement cost, which emphasizes the challenge to find and evaluate the breakeven point between more dedicated alternatives (Koren, et al., 2018).
MacStravic & Boucher (1992) have generated software that could be used with capital investment analysis of manufacturing equipment. The program incorporates cost with