Rapport 27 - 2013
Foto:
Karin Jacobsson
Proficiency Testing
Drinking Water Microbiology
- September 2013
Internal and external control for microbiological analyses of food and drinking water
All analytical activities require work of a high standard that is accurately documented. For this purpose, most laboratories carry out some form of internal quality assurance, but their analytical work also has to be evaluated by an independent party. Such external quality control of laboratory competence is required by accreditationbodies for accredited laboratories and can be done by taking part in proficiency testing (PT) schemes.
In a proficiency test, identical test material is analysed by a number of laboratories using their routine methods. The laboratories report their results to the organiser that evaluates them and compiles them in a report.
The National Food Agency’s PT program offers
External and independent evaluation of laboratories analytical competence. Improved knowledge of analytical methods used by laboratories with respect to
various types of organisms. Expert support
Tool for inspections regarding accreditation. Free extra material for follow-up analyses
For more information visit our website: www.slv.se/absint The National Food Agency’s reference material
As a complement to the proficiency testing, National Food Agency also produces reference material (RM) for internal quality control: a total of 7 RM for food and drinking water microbiological analyses, including pathogens, are available.
Information available on our website: www.slv.se/RM
Edition
Version 1 (2013-12-06)
Editor in chief
Annika Rimland, Head of Science Department, National Food Agency
Responsible for the scheme
Tommy Šlapokas, Microbiologist, Microbiology Division, National Food Agency PT September 2013 is registered as no. 2341/2013 at the National Food Agency, Uppsala
Proficiency testing
Drinking Water Microbiology
September 2013
Coliform bacteria and Escherichia coli with membrane filter method (MF) Coliform bacteria and Escherichia coli, (rapid methods with MPN)
Intestinal enterococci with MF
Pseudomonas aeruginosa with MF
Culturable microorganisms (total count) 3 days incubation at 22±2 °C Culturable microorganisms (total count) 2 days incubation at 36±2 °C
Tommy Šlapokas 1
Kirsi Mykkänen 1,2
1 Compilation and report writing 2 Laboratory work
Abbreviations and explanations
Common media in text and/or tables
LES m-Endo Agar LES (according to SS 028167)
LTTC m-Lactose TTC Agar with Tergitol (acc.to EN-ISO 9308-:2000) m-FC m-FC Agar (acc. to SS 028167)
m-Ent m-Enterococcus Agar (according to EN ISO 8799-2:2000)
PACN Pseudomonas Agar base with cetrimide and nalidixic acid (according to EN ISO 16266:2008)
YeA Yeast extract Agar (acc. to EN ISO 6222:1999)
CCA Chromocult Coliform Agar® (Merck; ISO/DIS 9308-1:2013)
Colilert Colilert® Quanti-Tray® (IDEXX Inc.; ISO 9308-2:2012)
Other abbreviations
MF Membrane filter (method)
MPN ”Most Probable Number” (quantification based on statistical distributions) ISO "International Organization for Standardization" and their standards EN European standard from "Comité Européen de Normalistion" (CEN) NMKL "Nordisk Metodikkomité for næringsmidler" and their standards
DS, NS, SFS, SS National standards from Denmark, Norway, Finland and Sweden
Method tables for the analytical parameters
Tot n total number of laboratories that reported methods and numerical results n number of results except false results and outliers
Mv mean value (with deviating results excluded) Med median value (with deviating results included)
CV coefficient of variation = relative standard deviation in percentage of the mean, calculated from square root transformed results
F number of false positive or false negative results < number of low outliers
> number of high outliers global results for the analysis remarkably low result
remarkably high result, high CV or many deviating results 278
Contents
Abbreviations and legends ... 2
General information on results evaluation ... 4
Results of the PT round March 2013 ... 4
- General outcome ... 4
- Coliform bacteria (MF) ... 6
- Suspected thermo-tolerant coliform bacteria (MF) ... 8
- Escherichia coli (MF) ... 9
- Coliform bacteria and E. coli (rapid method, MPN) ... 11
- Intestinal enterococci (MF) ... 14
- Pseudomonas aeruginosa (MF) ... 16
- Culturable microorganisms 22 °C, 3 days ... 18
- Culturable microorganisms 36 °C, 2 days ... 20
Outcome of the results and laboratory assessment ... 22
- Assessment of the performance ... 22
- General information about reported results ... 22
- Mixing up of samples or results ... 22
- Z-scores, box plots and deviating results for each laboratory ... 22
Test material, quality control and processing of data ... 27
- Test material and its content ... 27
- Quality control of the mixtures ... 27
- Processing of numerical results ... 28
References ... 29
Annex A – All reported results ... 30
Annex B – Z-scores of the results ... 34
General information on results evaluation
The histograms and calculation of outliers are described in the section "Evaluation of numerical results" with further references to the scheme protocol (1).
The proficiency testing program organised by the National Food Agency is accredited according to EN ISO/IEC 17043. Because it states that results might be grouped based on the method used, it is mandatory for participants to give such information. For each parameter at least some method variants are accounted for. The method information gathered is not always easy to interpret. Sometimes there is inconsistency between the standard referred to and the information given regarding various method details. Results from laboratories with ambiguous details are either excluded or placed in the group "Other/Unknown" in the tables, together with results from methods used only by some individual laboratories.
Outliers and false results are not included in the calculation of mean value and measure of dispersion for the various method groups. The numbers of low and high outliers, as well as false results, are instead explicitly given in various tables together with the group means etc. The measure of dispersion is not shown for groups with 4 or fewer results.
Results of the PT round September 2013
General outcome
Test items were sent to 108 laboratories, 35 in Sweden, 56 in other Nordic countries and 17 in other countries. 98 laboratories reported results.
The percentages of false results and outliers are compiled in table 1. These deviating results are excluded in most calculations.
Microorganisms and parameters of analyses are also compiled in table 1. For the MF analyses the parameters suspected colonies of coliform bacteria, thermo-tolerant coliform bacteria, intestinal enterococci and Pseudomonas aeruginosa on primary media for quantification could be reported as well. The results from suspected colonies are only used as basis for interpretations and discussions.
All reported results are compiled in annex A. Individual results for each laboratory are also shown on our website after logging in (www.slv.se/absint).
Standardized z-scores for all evaluated results are given in annex B and photographs with examples of colony appearance on various media are presented in annex C. Interpretation of laboratory performance is described after all analytical parameters and illustrated by a box plot together with the number of deviating results for each laboratory.
Table 1 Microorganisms in each mixture and percentages of deviating results (F%: false positive
or false negative, X%: outliers)
Mixture A B C % participants with 0 deviating results 1 deviating result 2 deviating results >2 deviating results
No. of evaluable results 560 561 557
No. of deviating results * 10 (2 %) 22 (4 %) 10 (2 %)
Microorganisms Escherichia coli Citrobacter freundii Enterococcus faecalis Pseudomonas aeruginosa (Clostridium perfringens) Escherichia coli Cronobacter sakazakii Enterococcus hirae Staphylococcus saprophyticus Staphylococcus capitis Klebsiella oxytoca Enterobacter aerogenes Burkholderia cepacia Pseudomonas fluorescens
Analysis Target F% X% Target F% X% Target F% X%
Coliform bacteria
(MF) E. coli C. freundii 0 4 E. coli C. sakazakii 3 4 K. oxytoca E. aerogenes 0 1
Susp. thermo-tolerant
colif. bact. (MF) E. coli – – E. coli C. sakazakii – – – – –
E. coli (MF) E. coli 0 4 E. coli 1 4 – 6 –
Coliform bacteria
(rapid method) E. coli C. freundii 0 0 E. coli C. sakazakii 0 0 K. oxytoca E. aerogenes 0 0
E. coli (rapid meth.) E. coli 0 0 E. coli 0 0 [K. oxytoca] 2 –
Intestinal enterococci
(MF) E. faecalis 0 3 E. hirae [S. saprophyticus] 0 1 – 0 –
Pseudomonas
aeruginosa (MF) P. aeruginosa 0 0 – 0 – [B. cepacia] 0 –
Culturable micro– organisms (total count), 3 days 22 °C E. faecalis E. coli C. freundii P. aeruginosa 0 0 (E. hirae) (E. coli) (C. sakazakii) (S. saprophyticus) 0 3 P. fluorescens K. oxytoca E. aerogenes (B cepacia) 1 1 Culturable micro– organisms (total count), 2 days 36 °C E. faecalis E. coli C. freundii P. aeruginosa 0 3 S. capitis (E. hirae) (E. coli) (C. sakazakii) (S. saprophyticus) 0 12 K. oxytoca E. aerogenes (B cepacia) 0 3
* In total 23 out of 98 laboratories (23 %) reported at least one deviating result
– Organism missing or numerical result missing or "X%" not relevant when target organism is absent ( ) The organism contributes with only very few colonies
[ ] The organism is false positive on the primary growth medium
{ } The organism may give different results depending on the methods or definitions used 93% 4% 3% 0% 85% 10% 3% 2% 93% 5% 1% 1%
Coliform bacteria (MF)
In a few cases when the primary medium reported was not the one prescribed in the standard referred to, we have assumed the medium to be correct. The medium Endo Agar reported by some participants is here included in m-Endo Agar LES (LES). From the table it is clear that 5 times as many laboratories are using LES compared to LTTC. The results indicate lower results with LTTC in mixtures A and C than
Medium Tot A B C
n n Mv CV F < > n Mv CV F < > n Mv CV F < >
Total 72 69 490 16 0 3 0 67 51 17 2 1 2 70 1467 23 0 1 0 m-Endo Agar LES 56 55 507 14 0 1 0 55 51 15 0 1 0 55 1561 21 0 0 0 Lactose TTC Agar 11 11 387 24 0 0 0 9 57 20 1 0 1 11 1167 27 0 0 0 Chromocult C Agar 1 1 470 – 0 0 0 0 – – 0 0 1 1 900 – 0 0 0 Other/Unknown 4 2 645 – 0 2 0 3 28 – 1 0 0 3 1169 – 0 1 0 0 3 6 9 12 15 0 100 200 300 400 500 600 700 800 900 100 Coliform bacteria 35/36/37 °C (MF) Without remark False negative Outlier N o. of re sul ts
No. of colonies per 100 ml
490 ↓ 490↓ 0 3 6 9 12 15 0 100 200 300 400 500 600 700 800 900 100 Coliform bacteria 35/36/37 °C (MF)
m-Endo Agar LES Lactose TTC Agar Chromocult Coliform Agar Other/Unknown N o. of re sul ts
No. of colonies per 100 ml
51 ↓ 0 3 6 9 12 15 0 15 30 45 60 75 90 105 120 135 15 Coliform bacteria 35/36/37 °C (MF) N o. of re sul ts
No. of colonies per 100 ml
* 51 ↓ 0 3 6 9 12 15 0 15 30 45 60 75 90 105 120 135 15 Coliform bacteria 35/36/37 °C (MF) N o. of re sul ts
No. of colonies per 100 ml
* 0 3 6 9 12 15 0 500 1000 1500 2000 2500 3000 3500 4000 4500 500 Coliform bacteria 35/36/37 °C (MF) N o. of re sul ts
No. of colonies per 100 ml
1467 ↓ 1467↓ 0 3 6 9 12 15 0 500 1000 1500 2000 2500 3000 3500 4000 4500 500 Coliform bacteria 35/36/37 °C (MF) N o. of re sul ts
No. of colonies per 100 ml
A
B
with LES. In mixture B there is a tendency of higher results with LTTC compared to LES. The dispersion, and thus the uncertainty are higher for LTTC in all mixtures. Although there are tails with low results in all diagrams, it is difficult to see any method difference as the cause. For about ten laboratories there are low results for coliform bacteria in at least two mixtures, possibly indicating some other systematic cause. These tails with low values are causing lower averages and higher dispersion than in the corresponding analyses with the rapid method Colilert® Quanti-Tray®.
Mixture A
- E. coli and C. freundii form colonies in the analysis of coliform bacteria and could be counted from the volume 10 ml. The colonies are typical with a metallic sheen on LES and have different nuances of yellow on LTTC. Also the oxidase negative enterococci grow with small yellow colonies on LTTC. As often, it was difficult to distinguish the yellow colour in the medium from individual colonies, as the whole medium turns yellow due to a lot of target colonies present.
- Two out of three low outliers was obtained by use of an odd or unknown medium. The cause of these and the other low results are, however, not clear. The low results on LTTC compared to LES might be due to difficulties to distinguish C.
freundii as coliform bacterium. The colonies are pale yellow with a darker middle.
Mixture B
- The colonies of both E. coli and C. sakazakii grow as typical coliform bacteria on LES and LTTC, but with somewhat different appearance. Individual yellow colour beneath the colonies on LTTC is, as usually, difficult to see. Also this mixture includes an oxidase negative enterococcus strain that appears with small, yellow colonies on LTTC. The whole medium turns yellow.
- There was a tail of low results present even in this mixture, including two false negative results and one outlier. The reason for the low values is unclear also here. Two high outliers were also present.
Mixture C
- The two coliform bacteria K. oxytoca and E. aerogenes appeared on the media for coliform bacteria. E. aerogenes appears sometimes with more or less red, atypical, colonies with only weak metallic sheen in the middle on LES. If there is any doubt, the oxidase test will confirm that it is a coliform bacterium.
- Also here were an unexpected number of low results present. However, only one was regarded as an outlier. Low values will be the result if reddish colonies on LES are not reckoned as coliform bacteria. However, LTTC had lower average than LES, indicating some problem also there (photo missing).
- There is a tendency to two peaks in the histogram. The right-hand side peak includes both the two coliform bacteria while the other incudes only K. oxytoca. The average indicated does not represent any of the peaks but is rather in between. The median of 1700 cfu/100 ml is therefor closer to the sum of coliform bacteria according to the rapid method (about 2000 cfu/100 ml).
Suspected thermo-tolerant coliform bacteria (MF)
The two most commonly used growth media are m-FC and LTTC. The incubation temperature is 44 or 44.5 °C. Here, results were separated based on the method standards most commonly used, to get a further division. They are EN ISO 9308-1 with LTTC and three standards with m-FC from the Nordic countries, namely SS 028167 from Sweden, SFS 4088 from Finland and NS 4792 from Norway. They were sometimes used a bit modified.
The table shows the medians instead of mean values because no outliers have been identified. The analysis is not included in performance assessment.
Standard, Method Tot A B C
n n Med CV F < > n Med CV F < > n Med CV F < > Total 39 39 278 – – – – 39 31 – – – – 38 0 – – – – EN ISO 9308-1 9 9 380 – – – – 9 51 – – – – 9 0 – – – – SS 028167 11 11 255 – – – – 11 28 – – – – 10 0 – – – – SFS 4088 15 15 240 – – – – 15 25 – – – – 15 0 – – – – NS 4792 3 3 210 – – – – 3 43 – – – – 3 0 – – – – Other/Unknown 1 1 12 – – – – 1 12 – – – – 1 9 – – – –
The Swedish standard states incubation at 44 °C and all laboratories reporting results used 44 °C. The temperature 44 °C is also used as stated in EN ISO 9308-1. The three laboratories using Norwegian standard has incubated 44.5 °C. All laboratories using Finnish standard reported 44 °C.
In this round there are too few results for Norwegian standard, NS 4792, with the incubation temperature 44.5 °C to compare with Swedish and Finnish standard. No general tendency can be seen. In the mixtures A and B the laboratories using EN ISO 9308-1 with LTTC at 44 °C got higher results than laboratories using m-FC according to Swedish, Finnish or Norwegian standard. One possible explanation is that colonies of intestinal enterococci have been included as suspected thermo-tolerant coliform bacteria. Alternatively, the temperature might have been too low leading to growth of C. freundii that have been included.
Mixture A
- At 44 °C only the E. coli strain should grow. With somewhat lower temperature also small colonies of C. freundii might appear.
Mixture B
- Beside the strain of E. coli, C. sakazakii grow with greyish colonies on m-FC and pale yellow colonies on LTTC at 44 °C.
Mixture B
Escherichia coli (MF)
E. coli is quantified after confirmation of colonies that have grown either at 36±2 °C
or at 44/44.5 °C. Different primary growth media are used at the two temperatures, LTTC or LES at the low temperature and LTTC or m-FC at the high temperature. The results from the two temperatures are here compiled in separate tables. In some cases, the incubation temperature stated for the primary growth medium was ambiguous. These 10 results are not specifically shown but are only included in the table "All results".
E. coli was present in mixture A and B. The averages of accepted results are
approximately the same for LTTC and LES in both these mixtures at 36±2 °C. No particular difference in numbers or proportion deviating results between these methods was seen in any mixture.
In thes round, compared to the previous one, there is a small tendency to lower results with m-FC compared to LTTC at 44/44.5 °C. However, there are only four results for LTTC. There are indications that the m-FC results with Norwegian standard, NS 4792, are lower in average than those with Finnish standard, SFS 4088, in mixture A but not in mixture B.
All results Medium Tot A B C n n Mv CV F < > n Mv CV F < > n Mv CV F < > Total 73 70 315 13 0 3 0 69 31 16 1 1 2 68 0 – 4 0 0 From 36±2 °C Medium Tot A B C n n Mv CV F < > n Mv CV F < > n Mv CV F < > Total 48 45 331 13 0 3 0 45 33 16 1 1 1 44 0 – 3 – –
m-Endo Agar LES 39 37 333 12 0 2 0 38 33 16 0 1 0 36 0 – 2 – – Lactose TTC Agar 8 7 316 19 0 1 0 6 34 19 1 0 1 7 0 – 1 – – Chromocult C Agar 0 0 – – – – – 0 – – – – – 0 – – – – – Other/Unknown 1 1 380 – 0 0 0 1 26 – 0 0 0 1 0 – 0 – – From 44/44.5 °C Medium/Standard Tot A B C n n Mv CV F < > n Mv CV F < > n Mv CV F < > Total 15 15 292 11 0 0 0 15 27 12 0 0 0 14 0 – 1 0 0 Medium m-FC Agar 10 10 274 11 0 0 0 10 25 13 0 0 0 9 0 – 1 – – Lactose TTC Agar 4 4 317 – 0 0 0 4 29 – 0 0 0 4 0 – 0 – – Other/Unknown 1 1 380 – 0 0 0 1 39 – 0 0 0 1 0 – 0 – – Standard EN ISO 9308-1 6 6 337 10 0 0 0 6 28 15 0 0 0 6 0 – 0 – – SS 028167 0 0 – – – – – 0 – – – – – 0 – – – – – SFS 4088 4 4 312 – 0 0 0 4 26 – 0 0 0 4 0 – 0 – – NS 4792 3 3 220 – 0 0 0 3 29 – 0 0 0 2 0 – 1 – – Other/Unknown 2 2 241 – 0 0 0 2 24 – 0 0 0 2 0 – 0 – –
Mixture A
- Except some low outliers, the results were well dispersed. The cause of the low outliers is not clear.
- A confirmation step is needed if E. coli is quantified from the primarily analysis at 36±2 °C as C. freundii will also grow there. C. freundii is excluded as E. coli due to its lack of both indol production and β-glucuronidase activity. At 44/44.5 °C only colonies of E. coli will appear.
315 ↓ 0 3 6 9 12 15 0 100 200 300 400 500 600 700 800 900 1000 Escherichia coli (MF) N o. of re sul ts
No. of colonies per 100 ml
331 ↓ 0 3 6 9 12 15 0 100 200 300 400 500 600 700 800 900 1000 Escherichia coli 35/36/37 °C (MF)
m-Endo Agar LES Laktos TTC agar Chromocult Coliform Agar Other/Unknown N o. of re sul ts
No. of colonies per 100 ml
292 ↓ 0 3 6 9 12 15 0 100 200 300 400 500 600 700 800 900 1000 Escherichia coli 44/44,5 °C (MF) m-FC Agar Laktos TTC agar Other/Unknown N o. of re sul ts
No. of colonies per 100 ml
0 3 6 9 12 15 0 15 30 45 60 75 90 105 120 135 150 Escherichia coli (MF) N o. of re sul ts
No. of colonies per 100 ml
31 ↓ 31 ↓ 0 3 6 9 12 15 0 15 30 45 60 75 90 105 120 135 150 Escherichia coli 35/36/37 °C (MF) N o. of re sul ts
No. of colonies per 100 ml
27 ↓ 0 3 6 9 12 15 0 15 30 45 60 75 90 105 120 135 150 Escherichia coli 44/44,5 °C (MF) N o. of re sul ts
No. of colonies per 100 ml
A
Mixture B
- The dispersion of the results was good, except some deviating results.
- Confirmation is needed when E. coli is quantified from the primary analysis at 36±2 °C. Both the strain of E. coli and C. sakazakii grow as typical coliform bacteria. C. sakazakii will be excluded as E. coli due to its lack of indol production and β-glucuronidase activity.
- Both strains will also grow at 44/44.5 °C but the colonies of C. sakazakii are atypical, greyish on m-FC. Colonies of C. sakazakii suspected as presumptive E.
coli, e.g. on LTTC, will be excluded after confirmation, as described above.
Mixture C
- No E. coli was included in the mixture. Four false positive results were present. When confirmed, colonies of K. oxytoca from incubation at 36±2 °C may grow in broth at 44 °C, however without gas production. Because the strain produces indol it may be taken for E. coli if there is no test of gas production or β-glucuronidase activity. Both these tests are negative for the strain of K. oxytoca.
Coliform bacteria & E. coli (rapid method, MPN)
The rapid method used for both these parameters was almost exclusively Colilert®
Quanti-Tray® from the manufacturer IDEXX Inc. All laboratories stating that they have analysed this parameter have this time also used a rapid method. Out of the 54 laboratories that reported Colilert some used trays with 51 wells, while others used trays with 97 wells (a few of which, probably incorrectly, have reported 96 wells). The laboratories have often analysed both diluted and undiluted samples. One laboratory included in the group Other/Unknown has reported the use of "Colilert 24 hours".
In mixture A there is a tendency that the trays with 51 wells gave a bit lower results than the trays with 97 wells. Neither for the coliform bacteria in the other mixtures nor for E. coli in any mixture were such tendencies present. No deviating result was reported.
Coliform bacteria, Rapid method with MPN
Medium Tot A B C
n n Mv CV F < > n Mv CV F < > n Mv CV F < >
Total, Rapid meth. 56 56 535 13 0 0 0 56 60 13 0 0 0 56 2042 11 0 0 0 Colilert Quanti-51 17 17 482 14 0 0 0 17 60 18 0 0 0 17 1996 9 0 0 0 Colilert Quanti-97 37 37 562 12 0 0 0 37 60 11 0 0 0 37 2076 11 0 0 0 Colilert Quanti-? 0 0 – – – – – 0 – – – – – 0 – – – – –
Other/Unknown 2 2 521 – 0 0 0 2 60 – 0 0 0 2 1800 – 0 0 0
E. coli, Rapid method with MPN
Medium Tot A B C
n n Mv CV F < > n Mv CV F < > n Mv CV F < >
Total, Rapid meth. 56 56 333 10 0 0 0 56 31 16 0 0 0 55 0 – 1 – –
Colilert Quanti-51 18 18 322 12 0 0 0 18 32 18 0 0 0 17 0 – 1 – – Colilert Quanti-97 36 36 337 9 0 0 0 36 30 15 0 0 0 35 0 – 0 – – Colilert Quanti-? 0 0 – – – – – 0 – – – – – 0 – – – – –
Other/Unknown 2 2 363 – 0 0 0 2 39 – 0 0 0 2 0 – 0 – –
Not rapid method 0 0 – – – – – 0 – – – – – 0 – – – – –
535 ↓ 0 3 6 9 12 15 0 100 200 300 400 500 600 700 800 900 1000
Coliform bacteria (rapid metohd, MPN)
N o. of re sul ts MPN-index per 100 ml 0 3 6 9 12 15 0 100 200 300 400 500 600 700 800 900 1000
Coliform bacteria (rapid metohd, MPN)
Ouanti-Tray, 51 wells Ouanti-Tray, 97 wells Other/Unknown N o. of re sul ts MPN-index per 100 ml 535 ↓ 60 ↓ 0 3 6 9 12 15 0 15 30 45 60 75 90 105 120 135 150
Coliform bacteria (rapid metohd, MPN)
N o. of re sul ts MPN-index per 100 ml 60 ↓ 0 3 6 9 12 15 0 15 30 45 60 75 90 105 120 135 150
Coliform bacteria (rapid metohd, MPN)
N o. of re sul ts MPN-index per 100 ml 2042 ↓ 0 3 6 9 12 15 0 500 1000 1500 2000 2500 3000 3500 4000 4500 5000
Coliform bacteria (rapid metohd, MPN)
N o. of re sul ts MPN-index per 100 ml 2042 ↓ 0 3 6 9 12 15 0 500 1000 1500 2000 2500 3000 3500 4000 4500 5000
Coliform bacteria (rapid metohd, MPN)
N o. of re sul ts MPN-index per 100 ml A B C
Mixture A
- Both E. coli and C. freundii are typical coliform bacteria, producing β-galactosidase and detected by methods based on the activity of this enzyme (ONPG positive), e.g. Colilert®-18/24 Quanti-Tray® where ONPG is a substrate. - Only the E. coli strain produces β-glucuronidase and is detected as E. coli by
methods based on the activity of this enzyme.
- The average results for both coliform bacteria and E. coli were slightly higher with Colilert®-18 Quanti-Tray® compared to the MF-method and had fewer
deviating results, as is often the case. Mixture B
- The strains of E. coli and C. sakazakii produce the enzyme β-galactosidase and contribute to the coliform bacteria obtained with Colilert®-18 Quanti-Tray®.
- The average for coliform bacteria is somewhat higher with this rapid method (61 cfu/100 ml) than with the MF-method (51 cfu/100 ml). For E. coli the averages were equal.
Mixture C
- Both K. oxytoca and E. aerogenes are typical coliform bacteria with the enzyme
β-galactosidase and were detected based on this enzyme (ONPG positive), e.g.
Colilert®-18/24 Quanti-Tray®.
- The average result was somewhat higher with Colilert®-18 Quanti-Tray® compared to the MF-method.
- No strain possesses the enzyme β-glucuronidase, implying zero results for E. coli.
333 ↓ 0 3 6 9 12 15 0 100 200 300 400 500 600 700 800 900 1000
Escherichia coli (rapid method, MPN)
N o. of re sul ts MPN-index per 100 ml 333 ↓ 0 3 6 9 12 15 0 100 200 300 400 500 600 700 800 900 1000
Escherichia coli (rapid method, MPN)
N o. of re sul ts MPN-index per 100 ml 31 ↓ 0 3 6 9 12 15 0 15 30 45 60 75 90 105 120 135 150
Escherichia coli (rapid method, MPN)
N o. of re sul ts MPN-index per 100 ml 31 ↓ 0 3 6 9 12 15 0 15 30 45 60 75 90 105 120 135 150
Escherichia coli (rapid method, MPN)
N o. of re sul ts MPN-index per 100 ml A B
Intestinal enterococci (MF)
The method XX-EN ISO 7899-2:2000 was almost always used. In only 5 cases another method reference, like national standards, has been stated. Also in these cases the medium m-Enterococcus Agar has been used as primary medium. Sometimes the medium is in the comments referred to as Slanetz & Bartley Agar, which is the same medium. Such comments are sometimes also found when XX-EN ISO 7899-2:2000 is given as reference.
The temperature for incubation was always 36±2 °C, and confirmation was in 77% of the cases performed with Bile-esculine-azide agar (BEA Agar) as is stated in XX-EN ISO 7899-2:2000. Confirmation was in 12% performed on Bile-esculine agar (without azide; BE Agar). It is difficult to know if this difference is real or is due to terminology mixing-up. The temperature for confirmation was in 89% of the laboratories 44 °C and in 7% 44.5 °C.
The method for presumptive intestinal enterococci does not differ for the vast majority of the about 80 results obtained, making most discussions about method differences impossible. There was no difference in the confirmation outcome in relation to BEA Agar or BE Agar.
Intestinal enterococci MF Standard Tot A B C n n Mv CV F < > n Mv CV F < > n Mv CV F < > Total 75 72 589 8 0 2 0 74 57 10 0 0 1 74 0 – 0 – – EN ISO 7899-2 70 67 591 8 0 2 0 69 57 10 0 0 1 69 0 – 0 – – Other 5 5 554 13 0 0 0 5 64 6 0 0 0 5 0 – 0 – – 589 ↓ 0 3 6 9 12 15 0 100 200 300 400 500 600 700 800 900 1000 Intestinal enterococci (MF) N o. of re sul ts
No. of colonies per 100 ml
589 ↓ 0 3 6 9 12 15 0 100 200 300 400 500 600 700 800 900 1000 Intestinal enterococci (MF) EN ISO 7899-2:2000 Other/Unknown N o. of re sul ts
No. of colonies per 100 ml
57 ↓ 0 3 6 9 12 15 0 15 30 45 60 75 90 105 120 135 150 Intestinal enterococci (MF) N o. of re sul ts
No. of colonies per 100 ml
* 57 ↓ 0 3 6 9 12 15 0 15 30 45 60 75 90 105 120 135 150 Intestinal enterococci (MF) N o. of re sul ts
No. of colonies per 100 ml
*
B
Mixture A
- One typical strain of E. faecalis was present in the mixture. - The dispersion of the results was good.
Mixture B
- One strain of E. hirae constituted the intestinal enterococci.
- There was also a strain of Staphylococcus saprophyticus in the mixture whose colonies appear reddish on m-Ent and in those cases might be counted as suspected intestinal enterococci.
Pseudomonas aeruginosa (MF)
The method XX-EN ISO 16266:2008 – with or without modification – was used by 59 out of the 62 laboratories reporting results for this analysis. Some of the laboratories have reported the method by reference to the identical, currently withdrawn, CEN standard EN 12780:2002, with or without modification. Incubation was always done at 36±2°C. Except in 5 cases where Pseudomonas Isolation agar was reported, the laboratories used what is interpreted as ”Pseudomonas Agar base” with cetrimide and/or nalidixic acid (C/N-supplement). Various confirmation tests were performed when necessary.
Method and primary medium used do not differ for the majority of the reported results, making any discussion of method or medium issues irrelevant. However, the added supplements differ among the laboratories. Several laboratories reported the addition of both cetrimide and nalidixic acid to the medium. Quite many added only cetrimide, while a few added only nalidixic acid. In 2 laboratories it is not clear which supplement they added.
Only mixture A contained P. aeruginosa. In spite of few results, the addition of nalidixic acid only seemed to give lowest results with the current strain. This is in accordance with the outcome for one out of two strains in the September round 2012. Pseudomonas aeruginosa MF
Selective additive Tot A B C
n n Mv CV F < > n Mv CV F < > n Mv CV F < > Total 75 62 194 16 0 0 0 61 0 – 0 – – 61 0 – 0 – – Cetrimide+Nalidix. 42 42 196 16 0 0 0 41 0 – 0 – – 41 0 – 0 – – Cetrimide 14 14 220 12 0 0 0 14 0 – 0 – – 14 0 – 0 – – Nalidixic acid 4 4 137 – 0 0 0 4 0 – 0 – – 4 0 – 0 – – Irgasan 0 0 – – – – – 0 0 – – – – 0 0 – – – – Other/unknown 2 2 121 – 0 0 0 2 0 – 0 – – 2 0 – 0 – – Mixture A
- One typical strain of P. aeruginosa was included.
- The distribution of results was good and no deviating results were present.
194 ↓ 0 2 4 6 8 10 0 50 100 150 200 250 300 350 400 450 500 Pseudomonas aeruginosa (MF) N o. of re sul ts
No. of colonies per 100 ml
194 ↓ 0 2 4 6 8 10 0 50 100 150 200 250 300 350 400 450 500 Pseudomonas aeruginosa (MF) Cetrimid + Nalidixin Cetrimid only Nalidixin only Irgasan Other/Unknown N o. of re sul ts
No. of colonies per 100 ml
Mixture B
- Mixture B contained no P. aeruginosa and there were no false positive results. Mixture C
- Mixture C contained no P. aeruginosa but another bacterium that can grow on the medium, namely a strain of Burkholderia cepacia.
- The strain is atypical with small, pale colonies and will normally be eliminated by confirmation. The strain does not fluoresce on Kings Agar B when illuminated by UV light at 365 nm, which P. aeruginosa normally does. The fluorescence as well as the blue green pigmentation is also absent on the primary growth medium. - No false positive results were present.
Culturable microorganisms 22 °C, 3 days
Only 5 out of 91 laboratories reported another method than XX-EN ISO 6222:1999. There were no outliers among these 5 laboratories.
Only comparisons of method variants of the XX-EN ISO 6222:1999 are therefore relevant to discuss. Here, the results are presented in relation to culture media and magnification for reading.
No general pattern can be discerned in terms of medium or magnification. Only one out of 4 deviating results was obtained when the magnification was ≥ 5 times.
22±2 °C, 3 days
Group of results Tot A B C
n n Mv CV F < > n Mv CV F < > n Mv CV F < >
Total, all results 91 90 14 15 0 0 0 88 2 49 0 0 3 89 23 15 1 0 1
EN ISO 6222 86 86 14 14 0 0 0 83 2 51 0 0 3 84 23 15 1 0 1
Medium
Yeast extract Agar 80 80 14 14 0 0 0 77 2 51 0 0 3 78 23 15 1 0 1 Plate Count Agar 4 4 10 – 0 0 0 4 4 – 0 0 0 4 22 – 0 0 0
Other/Unknown 2 2 18 – 0 0 0 2 4 – 0 0 0 2 25 – 0 0 0 Magnification None 23 23 12 17 0 0 0 21 1 76 0 0 2 22 22 17 1 0 0 1,1–4,9× 32 32 14 12 0 0 0 32 2 35 0 0 0 31 24 13 0 0 1 5–11,9× 30 30 15 14 0 0 0 29 2 50 0 0 1 30 24 15 0 0 0 > 12× 1 1 13 – 0 0 0 1 2 – 0 0 0 1 21 – 0 0 0 Unknown 0 0 – – – – – 0 – – – – – 0 – – – – – Other method 5 4 16 – 0 0 0 5 3 17 0 0 0 5 15 18 0 0 0 14 ↓ 0 4 8 12 16 20 0 5 10 15 20 25 30 35 40 45 50
Culturable microorganisms 22±2 °C, 3 days
N o. of re sul ts
No. of colonies per ml
14 ↓ 0 4 8 12 16 20 0 5 10 15 20 25 30 35 40 45 50
Culturable microorganisms 22±2 °C, 3 days
No magnification 1,1–4,9× magnification 5–11,9× magnification ≥ 12× magnification Other/Unknown N o. of re sul ts
No. of colonies per ml
Mixture A
- All strains that grow in any of the reported analyses also grow at 22 °C and contribute to the number of culturable microorganisms.
- No deviating results were present. Mixture B
- All strains except S. capitis will grow as culturable microorganisms at 22 °C. However, all of them were present in low numbers.
- Except for 3 high outliers the distribution of the results was good. The relative dispersion (CV) was high due to the very low average of only 2 cfu/ml.
- Depending on the low average the acceptable zero results will get a z-score < –2. This should not be reckoned as a deviation in the follow-up process.
Mixture C
- All strains present in the mixture grow.
- Two deviating results were identified. The distribution of the results was a bit wide. ↓ 2 0 5 10 15 20 25 0 5 10 15 20 25 30 35 40 45 50
Culturable microorganisms 22±2 °C, 3 days
N o. of re sul ts
No. of colonies per ml
* 0 5 10 15 20 25 0 5 10 15 20 25 30 35 40 45 50
Culturable microorganisms 22±2 °C, 3 days
N o. of re sul ts
No. of colonies per ml
* ↓ 2 23 ↓ 0 4 8 12 16 20 0 5 10 15 20 25 30 35 40 45 50
Culturable microorganisms 22±2 °C, 3 days
N o. of re sul ts
No. of colonies per ml
* 23 ↓ 0 4 8 12 16 20 0 5 10 15 20 25 30 35 40 45 50
Culturable microorganisms 22±2 °C, 3 days
N o. of re sul ts
No. of colonies per ml
* B
Culturable microorganisms 36 °C, 2 days
Only 4 out of 77 laboratories reported another method than XX-EN ISO 6222:1999. There was one high outlier reported from those 4 laboratories.
As for the analysis at 22 °C, comparisons of method variants are relevant to discuss only when XX-EN ISO 6222:1999 was used. Also here, the results are presented in relation to culture media and magnification for reading.
For mixtures A and C the results are very similar to those for the analyses at 22 °C. Even here no general pattern can be discerned in terms of medium or magnification. The results for mixture B at 36 °C are higher than at 22 °C, but even here there is no evident difference between the used method variants.
Deviating results were obtained only when low magnification (≤ 5 times) was used. 36±2 °C, 3 days
Group of results Tot A B C
n n Mv CV F < > n Mv CV F < > n Mv CV F < >
Total, all results 77 75 14 13 0 0 2 68 74 6 0 8 1 75 21 15 0 0 2
EN ISO 6222 73 72 14 13 0 0 1 65 74 6 0 7 1 72 22 15 0 0 1
Medium
Yeast extract Agar 66 65 14 13 0 0 1 61 75 6 0 5 0 65 21 15 0 0 1 Plate Count Agar 5 5 16 17 0 0 0 3 69 – 0 1 1 5 28 12 0 0 0 Other/Unknown 2 2 14 – 0 0 0 1 88 – 0 1 0 2 26 – 0 0 0 Magnification None 17 16 14 15 0 0 1 12 72 8 0 4 1 17 21 15 0 0 0 1,1–4,9× 34 34 14 13 0 0 0 32 76 5 0 2 0 33 22 13 0 0 1 5–11,9× 22 22 14 14 0 0 0 21 74 7 0 1 0 22 22 17 0 0 0 > 12× 0 0 – – 0 0 0 0 – – 0 0 0 0 – – 0 0 0 Unknown 0 0 – – 0 0 0 0 – – 0 0 0 0 – – – – – Other method 4 3 12 – 0 0 1 3 69 – 0 1 0 3 20 – 0 0 1 14 ↓ 0 3 6 9 12 15 0 5 10 15 20 25 30 35 40 45 50
Culturable microorganisms 36±2 °C, 2 days
N o. of re sul ts
No. of colonies per ml
* 14 ↓ 0 3 6 9 12 15 0 5 10 15 20 25 30 35 40 45 50
Culturable microorganisms 36±2 °C, 2 days
No magnification 1,1–4,9× magnification 5–11,9× magnification ≥ 12× magnification Other/Unknown N o. of re sul ts
No. of colonies per ml
Mixture A
- All strains that grow in any of the reported analyses also grow at 36±2 °C and contribute to the number of culturable microorganisms.
- Except for 2 high outliers there was no problem. The distribution of the results was good.
Mixture B
- All strains grow as culturable microorganisms at 36±2 °C. S. capitis that didn't grow at 22 °C was here the most abundant.
- Seven low and one high outlier were present. Aside from these outliers the distribution of the results was good. The reason for the many low results is unclear.
Mixture C
- All strains in the mixture grow as culturable microorganisms at 22 °C. - Two high outliers were present. The distribution of the results was good.
- The strain of P. fluorescens usually doesn't grow at 37 °C. However, this time the difference between the average results at 36 and at 22 °C was insignificant.
74 ↓ 0 3 6 9 12 15 0 15 30 45 60 75 90 105 120 135 150
Culturable microorganisms 36±2 °C, 2 days
N o. of re sul ts
No. of colonies per ml
* 74 ↓ 0 3 6 9 12 15 0 15 30 45 60 75 90 105 120 135 150
Culturable microorganisms 36±2 °C, 2 days
N o. of re sul ts
No. of colonies per ml
* 21 ↓ 0 3 6 9 12 15 0 5 10 15 20 25 30 35 40 45 50
Culturable microorganisms 36±2 °C, 2 days
N o. of re sul ts
No. of colonies per ml
* 22 ↓ 0 3 6 9 12 15 0 5 10 15 20 25 30 35 40 45 50
Culturable microorganisms 36±2 °C, 2 days
N o. of re sul ts
No. of colonies per ml
* B
Outcome of the results and laboratory assessment
Assessment of the performance
The laboratories are not grouped or ranked in relation to their performances. The assessment is basically a clear description of the number of false results and outliers. The laboratories that did not report their results in due time, have to compare their results themselves with all other laboratories' by looking in annex A.
General information about reported results
The distributions of results for the respective analysis are shown in histograms. A box plot (see below) gives a summarizing image of all the results of a laboratory, except false results. The number of false results and outliers are given below the plot for a particular laboratory to summarize its performance. These values are highlighted with bold text and colour background in annex A, where all laboratories' reported results are compiled. The limit values for lowest and highest accepted results are given for each analysis in the summarizing lines at the end of annex A, together with the measurement uncertainty of the mean.
Mixed up samples or results
When it is evident that a laboratory has mixed up results it is mentioned in the text. If whole samples seem to have been mixed up, the respective sample numbers are hatched in annex A. Perhaps have two laboratories this time mixed up the results for coliform bacteria for two sample mixtures.
Z-scores, box plots and deviating results for each laboratory
The square root transformed results of the laboratories are calculated to standard scores, z-scores, to be comparable between analyses. They are shown in annex B but are not evaluated more elaborately. They are given explicitly to facilitate the follow-up process for the laboratories using z-scores.
The z-scores are the base for the box plots. The range of the z-scores for each laboratory is shown by a rectangle (box) and lines and/or circles above and beneath the box. The smaller the range from lowest to highest value is in the plot and the more centred around zero the values are, the better is the agreement between the particular laboratory's results and the means obtained from all laboratories' results.
Box plots and numbers of deviating results for each participating laboratory
- Z-scores are calculated from the formula z = (x – mv) / s
- Z-scores > +4 and < −4 have been set to +4 and −4, respectively.
- False results do not generate z-scores and are not included in ‘No. of results’.
False positive results cannot be illustrated in the box plots.
- The outliers are included in the plots after recalculation to standardised values
with the same standard deviation (s) as the rest of the results.
- The numbers of false positives and false negatives are given in the table under the
plots together with the numbers of outliers.
- The horizontal red line in each box indicates the median for the laboratory.
- The box includes 25% of the results above and below the median. The lines
protruding from the box and/or the circles embrace the remaining 50% of the results, false results excluded.
- A circle is shown when a result is highly deviating* from the rest.
- The background is divided into coloured fields in order to simplify localization of
the laboratory results.
_________________
* < [smallest value of the box - 1.5 × (largest value of the box - smallest value of the box)] or > [largest value of the box + 1.5 × (largest value of the box - smallest value of the box)]
z -scor e Lab no. 1131 1149 1237 1254 1290 1545 1594 1611 1753 1868 1970 2050 2386 2637 2670 2704 2745 3055 3076 3159 No. of results 15 3 24 24 15 18 24 24 24 15 18 24 18 15 - 20 8 2 9 15 False positive - - - - 1 - - - 1 1 - - -False negative - - - - 2 - - - 1 - -Low outliers - - 1 - 1 - - - 4 - - -High outliers - - 1 - 1 - - - - 1 - - - -False negative ? - - - - -RSZ 0,48 -1,21 -2,16 0,32 4,16 0,87 -0,18 1,23 1,86 3,8 0,47 1,88 1,61 -0,48 - 0,89 -7,91 -2,14 -0,14 1,56 -4 -2 0 2 4
z -scor e Lab no. 3162 3305 3339 3347 3511 3533 3588 3730 3868 4015 4064 4180 4288 4319 4343 4356 4539 4633 4650 4713 No. of results 24 24 18 - 15 - 18 3 24 18 3 15 5 21 24 24 18 9 6 24 False positive - - - -False negative - - - 1 - - - -Low outliers - - - - 1 - - - 1 - - - 2 -High outliers - - - 2 -False negative ? - - - - -RSZ 2,22 -1,77 -0,24 - -3,7 - 0,6 0,6 0,73 1,96 0,79 -2,96 -2,04 1,18 0,06 1 -0,78 -0,92 4,38 -2,32 SD 0,53 1,03 1,26 - 2,2 - 0,69 0,23 0,94 0,56 0,36 0,93 2,67 0,29 0,68 0,68 0,73 0,36 8,01 1,11 z -scor e Lab no. 4723 4770 4889 4980 5018 5094 5201 5220 5352 5447 5553 5950 6180 6233 6253 6456 6563 6731 7096 7191 No. of results 12 - 21 24 24 9 - 3 18 15 6 23 24 18 9 21 - - 18 -False positive - - - -False negative - - - -Low outliers - - - 1 - - - -High outliers - - - 1 - 1 - - - -False negative ? - - - - -RSZ 1,53 - 1,22 -1,34 -0,32 -1,37 - -2,6 1,28 1,5 4,57 -1,09 2,3 -0,71 1,28 -0,28 - - -0,21 --4 -2 0 2 4 -4 -2 0 2 4
z -scor e Lab no. 7248 7282 7302 7330 7442 7564 7596 7626 7688 7728 7876 7896 7906 7930 7946 7962 7968 8068 8177 8255 No. of results 24 15 24 14 - 6 24 24 24 18 24 - 6 23 24 24 24 24 21 24 False positive - - - 1 - - - -False negative - - - -Low outliers 1 - - - 2 - - - 1 1 - - 1 -High outliers - - - 2 2 - - - - 1 False negative ? - - - - -RSZ -0,52 0,02 1,07 -2,71 - -1,32 0,26 -0,84 -2,17 -3,48 -0,03 - 0,41 25,4 -0,21 -2,35 0,1 -0,13 -4,09 0,44 SD 1,12 1,26 0,72 0,79 - 1,14 0,83 0,72 1,57 1,04 1 - 0,75 17,1 2,55 1,9 0,66 0,75 1,15 1,36 z -scor e Lab no. 8260 8329 8380 8428 8435 8569 8598 8626 8628 8663 8742 8766 8862 8891 8898 8955 9002 9051 9306 9436 No. of results 9 24 23 15 18 9 3 9 17 24 6 24 24 3 24 15 12 18 12 24 False positive - - - 1 - - - -False negative - - - -Low outliers - - - 1 1 - - - -High outliers - - - - 1 - - - 1 - -False negative ? - - - - -RSZ -0,99 -0,83 -0,83 -0,84 -0,36 -0,31 0,17 0,18 -1,57 2,76 -0,68 -1 1,06 -0,72 1,3 0,21 -2,28 1,76 0,86 1,21 -4 -2 0 2 4 -4 -2 0 2 4
z -scor e Lab no. 9441 9451 9569 9589 9736 9899 9903 9956 No. of results 12 12 24 3 24 19 18 24 False positive - - - -False negative - - - -Low outliers - - - -High outliers - - - -False negative ? - - - - -RSZ -1,14 -0,08 -0,09 0,88 -0,42 2,52 0,97 1,54 -4 -2 0 2 4
Test material, quality controls and processing of data
Test material and its content
The test material was manufactured and freeze-dried in portions of 0.5 ml in small vials, according to the description by Peterz and Steneryd (2). This round comprised three test items with different microorganism mixtures. Each laboratory received one vial of each mixture. The simulated water samples were prepared by dissolving the content of the vials in 800 ml of sterile diluent. The composition and concentrations of each mixture is listed in Table 2. The participating laboratories were assigned to perform the analyses according to the methods routinely used on drinking water samples.
The test material is primarily adapted to the EN ISO methods for analyses of drinking water referred to in the European Drinking water directive (4). Alternative methods may usually also be used without any problem.
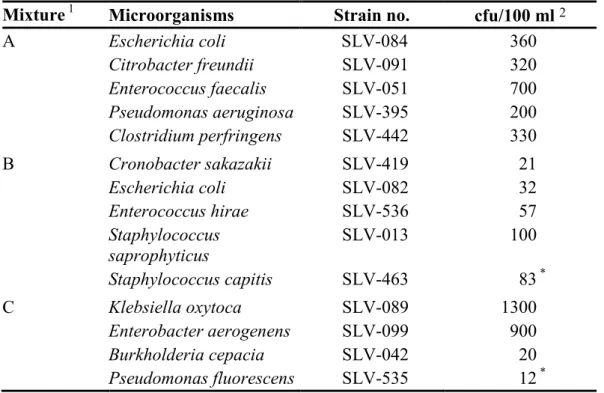
Table 2 Microorganisms present in the mixtures
Mixture 1 Microorganisms Strain no. cfu/100 ml 2
A Escherichia coli SLV-084 360 Citrobacter freundii SLV-091 320 Enterococcus faecalis SLV-051 700 Pseudomonas aeruginosa SLV-395 200 Clostridium perfringens SLV-442 330 B Cronobacter sakazakii SLV-419 21 Escherichia coli SLV-082 32 Enterococcus hirae SLV-536 57 Staphylococcus saprophyticus SLV-013 100 Staphylococcus capitis SLV-463 83 * C Klebsiella oxytoca SLV-089 1300 Enterobacter aerogenens SLV-099 900 Burkholderia cepacia SLV-042 20 Pseudomonas fluorescens SLV-535 12 *
1 The links between the mixtures and the randomised sample numbers are shown in annex A 2 cfu = colony forming units; * indicates cfu per ml; at the times given in note 1 of table 3
Quality control of the mixtures
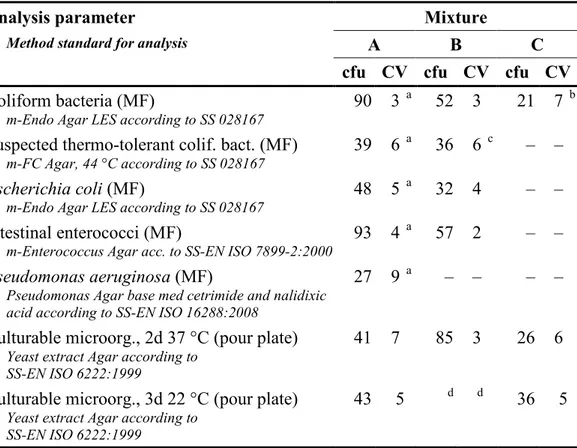
It is essential to have a homogeneous mixture and a uniform volume in all vials in order to allow comparison of all freeze-dried samples derived from one mixture. The volume was checked in 13 to 41 vials of each mixture and the biggest differences between vials were 6, 5 and 3 mg for mixture A, B and C, respectively. The highest accepted volume variation is 15 mg (3%). Table 3 presents the results from the
organizer in the form of concentration means (cfu) and coefficients of variation (CV) from duplicate analyses of 10 vials (in two mixtures about 5) from each mixture. The results relate to the volume at which the colonies were counted. According to the criteria for the CVs used they were acceptable for the mixtures to be considered homogenous. The highest accepted CV normally is 25%. For very low colony counts a higher CV is accepted.
Table 3 Contents (cfu) and measures of homogeneity (CV; coefficient of variation in
per cent) in relevant sample volumes for the various parameters in the mixtures 1
Analysis parameter Mixture
Method standard for analysis A B C
cfu CV cfu CV cfu CV Coliform bacteria (MF)
m-Endo Agar LES according to SS 028167 90 3
a 52 3 21 7 b
Suspected thermo-tolerant colif. bact. (MF)
m-FC Agar, 44 °C according to SS 028167 39 6
a 36 6 c – –
Escherichia coli (MF)
m-Endo Agar LES according to SS 028167 48 5
a 32 4 – –
Intestinal enterococci (MF)
m-Enterococcus Agar acc. to SS-EN ISO 7899-2:2000 93 4
a 57 2 – –
Pseudomonas aeruginosa (MF)
Pseudomonas Agar base med cetrimide and nalidixic acid according to SS-EN ISO 16288:2008
27 9 a – – – –
Culturable microorg., 2d 37 °C (pour plate)
Yeast extract Agar according to SS-EN ISO 6222:1999
41 7 85 3 26 6 Culturable microorg., 3d 22 °C (pour plate)
Yeast extract Agar according to SS-EN ISO 6222:1999
43 5 d d 36 5
1 n=10 vials (n=4-5 in mixture A and B according to a stability test of previously tested mixtures) analysed in duplicate, normally100 ml for MF and 1 ml for pour plate, 19, 10 and 13 weeks ahead of the testing round for the mixtures A, B and C, respectively (sample volume was 300 ml in A) a Result for 5 ml
b Result for 1 ml
c Including both E. coli and C. sakazakii
d Analysis not performed as only individual colonies will grow, giving very large CV – No target organism and thus no analysis
Processing of numerical results
Most histograms have “tails” in either or both directions, due to values that do not belong to a normal distribution. Calculations are performed after square root transformations of the results that give better normal distributions by decreasing the significance of the high end “tails”. Very deviating values are still present in most
analyses and are identified as outliers (black bars). False negative results are presented with white bars in the histograms.
Outliers are identified by use of Grubbs’ test according to a modification by Kelly (3). A level of 1% is used as risk to incorrectly assess a result as being an outlier. Although the method is objective, it is a prerequisite that the results are normally distributed in order to obtain correct outliers at the 1% level. A zero result that is a low outlier is considered as a false negative result. In special situations, e.g. when many zero results are reported and in some borderline cases, a few subjective adjustments are made in order to set the right limits based on the knowledge of the mixture’s contents. False results and outliers are not included in the calculations. The coefficient of variation (CV) for square root transformed results is given as a measure of dispersion. When the dispersion is < 10% it is regarded as very small, 10−20% as small, 20−30 % as medium, 30−40% as large and > 40% as very large. The calculation of uncertainty of measurement of the assigned value is described in the scheme protocol (1). The assigned value for an analysis is calculated from the square root transformed results and is the square root of “Mean” in Annex A, and there denoted as mv. Hence, also the measurement uncertainty will be expressed in the square root form. The standard uncertainty of measurement (u) correspond to the standard deviation of the assigned value (s) divided by the number of results squared-root transformed, i.e.: u = s/√nmv where nmv is the number of results in Annex A,
except the deviating ones. Here is the relative uncertainty (urel) used and expressed as
per cent after multiplication by 100.
More about result processing and recommendations on follow-up work are given in the scheme protocol (1). A PDF of that document is available on the website
www.slv.se/absint.
References
1. Anonymous 2012. Scheme protocol, Microbiology, Drinking water & Food. The National Food Agency, Sweden.
2. Peterz, M., Steneryd, A.-C. 1993. Freeze-dried mixed cultures as reference samples in quantitative and qualitative microbiological examinations of food. J. Appl. Bacteriol. 74:143-148.
3. Kelly, K. 1990. Outlier detection in collaborative studies. J. Assoc. Off. Chem. 73:58-64.
4. Anonymous 1998. Council Directive 98/83/EC of 3 November 1998 on the quality of water intended for human consumption. Official Journal of the Eu-ropean Communities. 5.12.98, L 330/32-54 (national translations available). 5. Standard Methods for the Examination of Water and Wastewater,
Lab no. A B C A B C A B C A B C A B C A B C A B C 1131 1 3 2 470 53 2070 470 53 2070 - - - 330 29 0 517 52 2419 387 24 0 1149 3 2 1 300 32 2300 - - - -1237 1 2 3 - - - 410 100 1300 - - - 322 70 0 429 41 1652 364 19 0 1254 3 1 2 500 47 1350 500 47 1200 - - - 300 22 0 600 62 1600 370 23 0 1290 1 2 3 - - - 180 <1 440 - - - 72 <1 440 - - - -1545 2 3 1 625 50 1700 305 50 1700 300 35 0 300 35 0 - - - -1594 1 3 2 480 41 1800 480 41 1800 152 25 0 305 27 0 429 56 2184 283 34 0 1611 1 2 3 480 64 2900 480 64 2900 190 27 0 340 26 0 517 58 1961 365 33 0 1753 1 2 3 696 69 2018 696 69 2018 - - - 391 41 0 681 60 2246 394 22 0 1868 1 2 3 524 55 1760 524 55 1760 - - - 352 33 0 563 57 1658 368 26 0 1970 1 2 3 660 73 2100 660 39 2100 380 51 0 380 26 0 - - - -2050 2 3 1 - - - 709 58 855 - - - 436 37 0 395 69 2376 270 49 0 2386 1 2 3 720 80 2600 720 80 2600 360 96 0 360 50 0 - - - -2637 1 2 3 - - - 580 56 3700 390 21 <1 2670 2 1 3 - - - -2704 1 3 2 - - - 590 36 1400 - - - 430 34 1120 697 78 2380 406 38 <1 2745 3 1 2 52 3 210 52 3 210 29 2 110 29 2 110 - - - -3055 2 3 1 - - - -3076 2 3 1 - - - -3159 3 1 2 - - - 504 83.1 1652 453 45.3 <1 3162 3 2 1 580 64 2200 580 64 2200 - - - 390 35 <1 677 84 2410 399 32 <1 3305 1 3 2 - - - 460 15 2000 - - - 300 13 0 430 29 2000 360 13 0 3339 2 3 1 630 64 2100 630 64 2100 - - - 410 37 0 - - - -3347 3 2 1 - - - -3511 3 2 1 - - - 288 34 2005 222 24 0 3533 3 1 2 - - - -3588 3 2 1 615 50 1886 615 50 1886 370 34 0 370 18 0 - - - -3730 1 2 3 720 64 1200 - - - 240 64 0 - - - -3868 3 2 1 510 43 2400 510 43 2400 240 20 0 260 32 0 660 41 3100 480 24 0 4015 3 1 2 660 61 2000 660 61 2000 300 48 0 391 37 0 730 50 2400 360 28 0 4064 3 1 2 - - - 570 52 2050 - - - -4180 3 2 1 - - - 200 30 1150 - - - 200 24 0 - - - -4288 1 2 3 - - - 90 <10 325 - - - -4319 1 3 2 580 61 1850 580 61 1850 338 40 0 320 33 0 565 73 1986 376 31 0 4343 2 1 3 541 49 1586 541 49 1586 - - - 369 25 <9 436 44 2420 250 19 <1 4356 2 3 1 700 46 2200 700 46 2200 230 17 0 430 30 0 550 86 1700 410 34 <1 4539 1 2 3 - - - 530 56 2000 380 29 0 4633 1 3 2 - - - -4650 3 2 1 - - - 23 12 23 12 12 9.2 - - - -4713 3 1 2 210 46 1800 210 46 1800 77 23 0 140 37 0 210 70 2000 210 50 0 4723 3 1 2 613 56 2000 613 56 2000 - - - 357 35 0 - - - -4770 2 1 3 - - - -4889 3 1 2 - - - 560 64 1100 - - - 560 51 0 580 77 1300 240 37 0 4980 3 2 1 500 80 750 500 80 750 210 49 0 210 31 0 591 101.3 2005 344 50.4 <1 5018 2 3 1 310 60 560 280 60 560 - - - 280 30 <1 820 62 2420 330 37 <1 5094 1 3 2 560 49 1640 - - - 550 31 0 300 31 0 - - - -5201 2 1 3 - - - -5220 1 2 3 - - - -5352 2 1 3 583 39 1770 460 39 1770 228 28 0 228 28 0 - - - -5447 3 1 2 - - - 518 51 1500 - - - 311 21 0 - - - -5553 3 1 2 - - - -5950 2 1 3 530 63 1000 530 63 1000 290 26 <1 405 29 <1 465 66 2204 310 43 <10 6180 3 1 2 625 69 935 625 69 935 385 57 0 345 35 0 620 80 2010 343 40 0 6233 2 3 1 - - - 330 49 0 - - - 495 45 1590 296 24 0 6253 2 3 1 - - - 727 75 1800 377 33 0 6456 1 3 2 - - - 543 43 1681 - - - 315 20 0 418 95 2011 344 45 0 6563 1 3 2 - - - -6731 3 1 2 - - - -7096 2 1 3 - - - 520 67 1520 - - - 290 50 0 - - - -7191 3 2 1 - - - -7248 3 1 2 565 62 818 565 62 818 129 23 0 452 46 0 656 75 2110 382 33 0 7282 3 1 2 - - - 144 25 0 - - - -7302 2 1 3 518 73 900 518 73 900 - - - 345 49 <10 576 55 1733 327 26 <1 7330 1 2 3 - - - 250 21 0 - - - -7442 1 3 2 - - - -7564 3 1 2 - - - -7596 2 3 1 570 64 1850 570 64 1850 210 43 0 210 23 0 411 46 1986 261 33 0 7626 1 3 2 262 62 859 262 62 859 267 53 0 267 27 0 432 66 1640 292 38 0 7688 2 3 1 - - - 160 65 1600 - - - 82 43 0 370 57 1700 280 44 0 7728 2 1 3 - - - 230 23 1800 - - - 190 23 0 - - - -7876 3 2 1 445 40 1790 445 40 1790 - - - 445 32 <1 662 64 1720 369 34 <1 Mean 490 51 1467 315 31 0 535 60 2042 333 31 0
Sample Suspected coliform bacteria (MF)
Coliform bacteria (MF) Susp. thermotolerant E. coli (MF) coliform bact. (MF)
Coliform bacteria ("rapid" MPN)
E. coli ("rapid" MPN) Annex A Results of the participants. Susp. = suspected on membrane filter before
confirmation. Results given as <1, <2, <10 and <100 are treated as zero. The fields with other results given as < 'value' and results given as > 'value' are yellow, and those results are not included in calculations or evaluations. This is also valid for results in shaded
columns. A hyphen indicate that no result has been reported. Figures written in bold in yellow fields indicate outliers, false positive and false negative results. Underlined zero values indicate results characterized as 'False negative ?'. Crossed out sample numbers in a
Lab no. A B C A B C A B C A B C A B C - - - 14 1 33 - - - 1131 - - - 8 1 23 - - - 1149 - - - 370 33 0 - - - 210 0 0 10 3 21 9 40 18 1237 550 76 0 550 76 0 270 0 160 270 0 0 14 3 31 17 70 21 1254 - - - 600 670 <1 - - - 190 <1 <1 15 1 21 13 81 25 1290 770 81 0 770 37 0 240 0 0 240 0 0 15 5 22 25 68 26 1545 625 59 0 625 59 0 141 0 108 141 0 0 13 3 21 17 80 21 1594 520 73 0 520 73 0 200 0 0 200 0 0 22 3 22 13 82 23 1611 691 51 0 691 51 0 284 0 0 284 0 0 14 1 29 14 78 25 1753 1054 55 0 - - - 23 87 24 - - - 1868 610 50 0 610 50 0 280 0 0 280 0 0 13 2 21 19 57 28 1970 - - - 664 53 0 - - - 345 0 0 12 2 37 16 74 32 2050 560 61 0 560 61 0 160 0 0 160 0 0 13 4 25 17 70 18 2386 - - - 460 54 <1 - - - 14 <1 28 13 72 13 2637 - - - 2670 - - - 540 67 0 - - - 10 3 14 13 80 18 2704 - - - 9 3 21 - - - 2745 - - - 10 0 0 - - - 3055 - - - 190 0 0 190 0 0 22 0 24 18 66 19 3076 - - - 680 70 0 - - - 13 5 29 12 77 17 3159 691 121 <1 691 69 <1 200 <1 <1 200 <1 <1 18 1 18 15 80 25 3162 540 60 0 540 60 0 280 0 0 280 0 0 13 1 19 18 78 20 3305 390 61 0 390 61 0 180 0 0 180 0 0 14 0 28 4 80 30 3339 - - - 3347 - - - 58 56 0 - - - 14 1 24 15 74 26 3511 - - - 3533 510 101 0 510 61 0 275 0 0 275 0 0 17 1 32 14 70 25 3588 - - - 16 2 26 - - - 3730 580 50 0 580 50 0 230 0 0 230 0 0 14 0 23 18 80 27 3868 736 85 0 736 62 0 - - - 14 2 31 - - - 4015 - - - 4064 - - - 610 68 0 - - - 6 2 13 10 68 18 4180 - - - 15 <10 50 - - - 4288 630 58 0 630 58 0 - - - 13 3 26 14 80 22 4319 658 108 0 658 61 0 189 0 0 189 0 0 16 2 28 15 89 19 4343 550 55 0 550 55 0 220 0 0 220 0 0 13 1 22 11 87 23 4356 420 79 1 420 38 0 130 15 81 130 0 0 18 2 24 14 75 22 4539 - - - 564 52 0 - - - 177 0 0 - - - 11 74 16 4633 - - - 140 88 65 4650 620 64 0 620 64 0 110 0 42 110 0 0 13 1 18 13 64 14 4713 600 55 0 600 53 0 - - - 19 2 36 - - - 4723 - - - 4770 - - - 700 69 0 - - - 200 0 0 9 3 29 - - - 4889 560 48 0 560 48 0 170 0 0 170 0 0 15 1 18 13 30 13 4980 570 66 <1 570 66 <1 115 <1 <1 115 <1 <1 11 2 20 13 70 28 5018 550 46 0 - - - 12 0 18 16 76 13 5094 - - - 5201 430 87 0 430 30 0 - - - 5220 478 40 0 478 40 0 200 0 146 200 0 0 13 76 22 11 75 22 5352 - - - 691 91 0 - - - 17 2 33 15 75 26 5447 - - - 580 45 <1,0 - - - 25 161 40 5553 >100 53 <1 >100 53 <100 180 <1 <1 180 <1 <1 10 <1 21 8 76 12 5950 620 50 0 620 50 0 220 0 0 220 0 0 18 5 35 16 88 29 6180 564 57 0 564 57 0 205 0 0 205 0 0 11 2 29 12 83 23 6233 545 66 0 - - - 20 1 27 - - - 6253 - - - 560 43 0 - - - 10 3 29 13 63 22 6456 - - - 6563 - - - 6731 - - - 600 50 0 - - - 120 0 0 12 3 18 16 65 18 7096 - - - 7191 608 34 0 608 34 0 140 0 0 140 0 0 15 1 22 10 44 21 7248 - - - 520 72 0 - - - 250 0 0 28 2 12 15 67 30 7282 636 65 <1 636 65 <1 300 <1 <1 300 <1 <1 13 4 32 17 72 16 7302 - - - 430 52 0 - - - 192 0 0 - 2 14 11 54 13 7330 - - - 7442 - - - 18 3 11 12 67 13 7564 580 49 0 580 49 0 280 0 0 280 0 0 14 5 24 22 71 30 7596 775 52 0 775 52 0 141 0 15 141 0 0 13 3 18 15 75 21 7626 - - - 200 67 0 - - - 73 0 0 11 3 26 16 79 27 7688 - - - 723 58 0 - - - 123 0 0 8 1 14 6 66 11 7728 473 66 <1 473 66 <1 155 <1 <1 155 <1 <1 23 2 10 19 75 9 7876 Pseudomonas aeruginosa (MF)
Total plate count 22 °C, 3 days
Total plate count 36±2 °C, 2 days Susp. Pseudomonas aeruginosa (MF) Intestinal enterococci (MF) Susp. intestinal enterococci (MF)
are excluded, as well as other outliers, in the summarizing calculated results at the end of the table. The mean value (Mean) is the square of the mean value for the square root transformed results (mv). The coefficient of variation (CV) is the standard deviation (s) in percentage of the mean value for the square root transformed results. As means to calculate the z-values of your own, the appropriate values of mv and s are given at the end of the table. The x-values are obtained as the square roots of the reported result,
respectively. z = (x - mv) / s. urel,mv is the relative standard uncertainty of mv in per cent.