A N I N TE LL IG EN T N O N -C O N TA C T B A SE D A PP RO A C H F O R M O N ITO RIN G D RIV ER ’S C O G N ITI V E L O A D 2018 Hamidur Rahman ISBN 978-91-7485-389-6 ISSN 1651-9256
Address: P.O. Box 883, SE-721 23 Västerås. Sweden Address: P.O. Box 325, SE-631 05 Eskilstuna. Sweden E-mail: info@mdh.se Web: www.mdh.se
Mälardalen University Press Licentiate Theses No. 268
AN INTELLIGENT NON-CONTACT BASED APPROACH
FOR MONITORING DRIVER’S COGNITIVE LOAD
Hamidur Rahman 2018
Copyright © Hamidur Rahman, 2018 ISBN 978-91-7485-389-6
ISSN 1651-9256
No. 268
An Intelligent Non-Contact based Approach
for Monitoring Driver’s Cognitive Load
Hamidur Rahman 2018
Abstract
The modern cars have been equipped with advanced technical features to help make driving faster, safer and comfortable. However, to enhance transport security i.e. to avoid unexpected traffic accidents it is necessary to consider a vehicle driver as a part of the environment and need to monitor driver’s health and mental state. Driving behavior-based and physiological parameters-based approaches are the two commonly used approaches to monitor driver’s health and mental state. Previously, physiological parameters-based approaches using sensors are often attached to the human body. Although these sensors attached with body provide excellent signals in lab conditions it can often be troublesome and inconvenient in driving situations. So, physiological parameters extraction based on video images offers a new paradigm for driver’s health and mental state monitoring. This thesis report presents an intelligent non-contact-based approach to monitor driver’s cognitive load based on physiological parameters and vehicular parameters. Here, camera sensor has been used as a non-contact and pervasive methods for measuring physiological parameters.
The contribution of this thesis is in three folds: 1) Implementation of a camera-based method to extract physiological parameters e.g., heart rate (HR), heart rate variability (HRV), inter-bit-interval (IBI), oxygen saturation (SpO2) and respiration rate (RR) considering several challenging conditions e.g. illumination, motion, vibration and movement. 2) Vehicular parameters e.g. lateral speed, steering wheel angle, steering wheel reversal rate, steering wheel torque, yaw rate, lanex, and lateral position extraction from a driving simulator. 3) Investigation of three machine learning algorithms i.e. Logistic Regression (LR), Support Vector Machine (SVM) and Linear Discriminant Analysis (LDA) to classify driver’s cognitive load. Here, according to the results, considering the challenging conditions, the highest correlation coefficient achieved for both HR and SpO2 is 0.96. Again, the Bland Altman plots shows 95% agreement between camera and the reference sensor. For IBI, the quality index (QI) is achieved 97.5% considering 100 ms R-peak error. For cognitive load classification, two separate studies are conducted, study1 with 1-back task and study2 with 2-back task and both time domain and frequency domain features are extracted from the facial videos. Finally, the achieved average accuracy for the classification of cognitive load is 91% for study1 and 83% for study2. In future, the proposed approach should be evaluated in real-road driving environment considering other complex challenging situations such as high temperature, complete dark/bright environment, unusual movements, facial occlusion by hands, sunglasses, scarf, beard etc.
Sammanfattning
Moderna bilar har utrustats med högteknologiska egenskaper för att göra dem snabba, säkra och bekväma. För att förbättra transportsäkerheten, dvs för att undvika oväntade trafikolyckor, är det nödvändigt att överväga en fordonsförare som är en del av miljön och där förarens hälsa och mentala tillstånd övervakas. Enligt litteraturen används ofta körbeteendebaserade och fysiologiska parameterbaserade metoder för att övervaka förarens hälsa och mentala tillstånd. Dessa studier är i huvudsak baserade på fysiologiska parameterbaserade metoder där sensorer ofta är knutna till människokroppen. Dessa sensorer ger utmärkta signaler under laboratorieförhållanden men är ofta förenade med artefakter och besvärliga och obekväma i körsituationer. Fysiologiska parametrar baserade på videobilder erbjuder ett nytt paradigm för förarens hälsa och mentala övervakning. Denna licentiatrapport presenterar ett intelligent, icke-kontaktbaserat tillvägagångssätt för att övervaka förarens kognitiva belastning baserat på fysiologiska parametrar och fordonsparametrar. Denna metod använder en kamerasensor som kontaktlös och genomgripande metod för mätning av fysiologiska parametrar.
Denna avhandling genererar ett trefaldigt bidrag: 1) Kamerabaserad metod implementeras för att extrahera fysiologiska parametrar, t.ex. hjärtfrekvens (HR), hjärtfrekvensvariation (HRV), interbit-intervall (IBI), syremättnad (SpO2) och andningsgrad (RR) med tanke på belysning, rörelse, och vibration. 2) vehikelparametrar, t.ex. ryggvinkel, rattvinkel, rattmoment, rygghastighet, lanex och sidoposition extraheras från simulatorn. 3) Tre maskininlärningsalgoritmer, dvs Logistic Regression (LR), Support Vector Machine (SVM) och Linear Discriminant Analysis (LDA) undersöks för att klassificera förarens kognitiva belastning. Enligt det experimentella arbetet, med tanke på de utmanande förhållandena, är den högsta korrelationskoefficienten som uppnåtts för både HR och SpO2 0,96. Återigen visar Bland Altman-grafer 95 % överenskommelse mellan kamera och referenssensor. För IBI uppnås kvalitetsindex (QI) 97,5% med tanke på 100 ms R-topp fel. Slutligen är den uppnådda genomsnittliga noggrannheten för klassificering av kognitiv belastning 91 % för studie1 och 83 % för studie2. I framtiden bör det föreslagna tillvägagångssättet utvärderas i körvägsmiljöer i andra mer komplicerade utmanande situationer som (exempelvis) hög temperatur, fullständigt ljus/mörker, ovanliga rörelser, ansikt oscklusion med händer, solglasögon, halsduk, skägg etc.
Acknowledgement
The thesis would not have been possible without the guidance and help of several persons. I am indebted to my supervisors Dr. Shahina Begum, Dr. Mobyen Uddin Ahmed and Prof. Peter Funk, at Mälardalen University (MDHfor theirinvaluable knowledge and advice,valuable time, guidelines. I would like to thank for their unconditional support in different situations and they have always been there and guided me when I was in deadlock position to solve problems.
I would like to express my appreciation to the members of safeDriver project Anna Anund at The Swedish National Road and Transport Research Institute (VTI); Bo Svanberg at Volvo Car Corporation (VCC); Bertil Hök, founder of Hök Instrument AB; and Johan Karlsson, Autolive. Thank you all for your opinions and suggestions on different occasions during the meetings. Also thank all of the test subjects in different data collection experiments for their time and cooperation.
I am also thankful to the professors at MDH from whom I have learnt during my courses. I thank the lecturers and professors whom I learned a lot from during meetings, lectures, seminars and PhD courses including Maria Lindén, Mikael Sjödin, Mikael Ekström, Moris Behnam, Ning Xiong and others. I would also like to thank my colleagues Shaibal Barua, Md Abu Naser Masud, Mohammed Ghaith Altarabichi for their support. I thank my course mates Ashalata, Filip, Hans, Husni, LanAnh, Mirgita, Nandinbaatar and others. I would like to thank all my current and past roommates Nikola Petrovic, Arash and Elaine. I would like to thank my friends and colleagues in the department of IDT: Fredrik Ekstrand, Anna, Carl, Miguel, Hossein, Maryam, Per, Sara, Nesredin and others.
Thanks to Swedish Knowledge Foundation KKS, Volvo Car Corporation (VCC), The Swedish National Road and Transport Research Institute (VTI), Karolinska Institute (KI), Autoliv AB, Hök instrument AB, Anpassarna AB and Prevas AB Sweden for their support of the research projects in this.
Finally, I would like to express my gratitude to my family members for their patient, support and encouragement. Special thanks to my wife Shamima Nasrin and my brother Mizanur Rahman.
Hamidur Rahman Västerås, Sweden, 2018
List of Publications
This thesis is based on the following papers, which are referred to in the text by their Roman numerals.
I Intelligent Driver Monitoring Based on Physiological Sensor Signal: Application Using Camera: Hamidur Rahman, Shaibal Barua, Shahina Begum, In Proceeding of IEEE 18th Int. Conf. on
Intelligent Transport System (ITSC2015), Spain, 2015.
II Non-Contact Physiological Parameters Extraction using Camera: Hamidur Rahman, Mobyen Uddin Ahmed, Sahina Begum, In Proceeding of the 1st Workshop on Embedded Sensor
Systems for Health through Internet of Things (ESS-H IoT), Italy, 2015.
III Non-contact Heart Rate Monitoring Using Lab Color Space: Hamidur Rahman, Shahina Begum, Mobyen Uddin Ahmed, In
Proceeding of the 13th International Conference on Wearable, Micro & Nano Technologies for Personalized Health (pHealth2016), Greece, 2016.
IV Non-contact Physiological Parameters Extraction using Facial Video considering Illumination, Motion, Movement and Vibration: Hamidur Rahman, Mobyen Uddin Ahmed, Shahina Begum, submitted in IEEE Transaction on Biomedical
Engineering, May 2018.
V Classification of Driver’s Cognitive Load using Non-contact
based Physiological and Vehicular Parameters: Hamidur Rahman, Shahina Begum, and Mobyen Uddin Ahmed, submitted
Additional publications, not included in this thesis:
A. Deep Learning based Person Identification using Facial Images: Hamidur Rahman, Mobyen Uddin Ahmed, Shahina Begum, the 4th EAI International Conference on IoT Technologies for HealthCare (HealthyIOT'17).
B. Vision Based Remote Heart Rate Variability Monitoring Using Camera: Hamidur Rahman, Mobyen Uddin Ahmed, Shahina Begum, the 4th EAI International Conference on IoT Technologies for HealthCare (HealthyIOT'17).
C. A Case-Based Classification for Drivers’ Alcohol Detection Using Physiological Signals: Hamidur Rahman, Shaibal Barua, Mobyen Uddin Ahmed, Shahina Begum, Bertil Hök, The 3rd EAI International Conference on IoT Technologies for HealthCare (HealthyIoT'16).
D. SmartMirror: An Embedded Non-contact System for Health Monitoring at Home: Hamidur Rahman, Shankar Iyer , Caroline Meusburger , Kolja Dobrovoljski , Mihaela Stoycheva , Vukan Turkulov , Shahina Begum, Mobyen Uddin Ahmed, The 3rd EAI International Conference on IoT Technologies for HealthCare (HealthyIoT'16).
E. Real Time Heart Rate Monitoring From Facial RGB Color Video Using Webcam: Hamidur Rahman, Shahina Begum, Mobyen Uddin Ahmed, Peter Funk, the 29th Annual Workshop of the Swedish Artificial Intelligence Society (SAIS 2016).
F. Driver Monitoring in the Context of Autonomous Vehicle: Hamidur Rahman, Shahina Begum, Mobyen Uddin Ahmed, the 13th Scandinavian Conference on Artificial Intelligence (SCAI 2015).
Publications in other domains:
G. Sources of Variation Analysis in Fixtures for Sheet Metal Assembly Process: Tomasic, Ilker Erde, Hamidur Rahman, Alf Andersson, Peter Funk, Swedish Production Symposium 2016 (SPS 2016).
H. Inline Process Control – a concept study of efficient in-line process control and process adjustment with respect to product geometry: Alf Andersson, Ilker Erdem, Peter Funk, Hamidur Rahman, Henrik Kihlman, Kristofer Bengtsson, Petter Falkman, Johan Torstensson, Johan Carlsson, Michael Scheffler, Stefan Bauer, Joachim Paul,
Lars Lindkvist, Per Nyqvist, Swedish Production Symposium 2016 (SPS 2016).
I. Ins and Outs of Big Data: A Review: Hamidur Rahman, Shahina Begum, Mobyen Uddin Ahmed, the 3rd EAI International Conference on IoT Technologies for HealthCare (HealthyIoT'16).
J. Falling Angel – a Wrist Worn Fall Detection System Using K-NN Algorithm: Hamidur Rahman, Johan Sandberg, Lennart Eriksson, Mohammad Heidari, Jan Arwald, Peter Eriksson, Shahina Begum, Maria Lindén, Mobyen Uddin Ahmed, the 3rd EAI International Conference on IoT Technologies for HealthCare (HealthyIoT'16).
List of Figures
Figure 1: Overview of driver monitoring systems ... 37
Figure 2: Intelligent driver monitoring system [58] ... 41
Figure 3. Volvo CE simulator ... 45
Figure 4. VTI car simulator (SIM III) ... 46
Figure 5: Face detection ... 48
Figure 6: Geometrical formulas for ROI correction ... 48
Figure 7: (a) Facial features selection for M1 (b1) ROI selection for method M1 (c) facial landmarks selection for M2 (d) four ROI selection for M2 ... 49
Figure 8: Scatter plot and correlation coefficient of HR between camera and cStress system ... 55
Figure 9: Poincare’ plot for IBI ... 56
Figure 10: Quality index ... 56
Figure 11: Overview of non-contact-based cognitive load classification ... 59
Figure 12: Representation of color matrix ... 60
Figure 13: Representation of color matrix ... 60
Figure 14: HR, IBI and HRV extraction workflow [Paper D] ... 61
Figure 15: Block diagram of cognitive load classification scheme [Paper E] ... 64
List of Tables
Table 1: Contribution of thesis ... 32 Table 2: Time domain features ... 62 Table 3: Frequency domain features ... 62
List of Abbreviations
HR Heart Rate
HRV Heart Rate Variability IBI Inter-beat-Interval RR Respiration Rate SpO2 Oxygen Saturation LR Logistic Regression
LDA Linear Discriminant Analysis SVM Support Vector Machine QI Quality Index
ECG Electrocardiography ROI Region of Interest
NLMS Normalized Mean Least Square CNN Convolutional Neural Network CAN Controller Area Network IVA Independent Vector Analysis
MCCA Multiset Canonical Correlation Analysis SWRR Steering Wheel Reversal Rate
DT Decision Tree BN Bayesian Network GSR Galvanic Skin Response FPS Frames Per Second VCA Visual Cue Adaptation HE Hidden Exit
CFR Car From Right SW Side Wind
LCL Low Cognitive Load HCL High Cognitive Load KLT Kanade-Lucas-Tomasi STD Standard Deviation ME Mean Error
RMSE Root Mean Squared Error EEG Electroencephalogram SDE Standard Deviation of Error
Contents
PART 1 ... xxvii THESIS ... xxvii
CHAPTER 1 ... 29 Introduction ... 29
1.1. Motivation and Aim ... 30 1.2. Problem Formulation ... 31 1.3. Research Contribution ... 31 1.4. Thesis Outline ... 33
CHAPTER 2 ... 36 Background and Related Works ... 36
2.1. Cognitive Load ... 37 2.2. Non-contact Parameters Extraction ... 38 2.3. Classification ... 41
CHAPTER 3 ... 44
Experimental Design and Methods ... 44 3.1. Experimental Design ... 44 3.2. Methods ... 47 3.3. Evaluation Methods ... 53 3.4. Ethical Issue ... 56
CHAPTER 4 ... 59
Cognitive Load Classification ... 59 4.1. Physiological Parameters Extraction ... 59 4.2. Vehicular Features Extraction ... 62 4.3. Cognitive Load Classification ... 63
CHAPTER 5 ... 66
Contributions ... 66 5.1. Paper A: Intelligent Driver Monitoring Based on Physiological Sensor Signal: Application Using Camera ... 66 5.2. Paper B: Non-Contact Physiological Parameters Extraction using Camera 67
Space 68 5.4. Paper D: Non-contact Physiological Parameters Extraction using Facial Video considering Illumination, Motion, Movement and
Vibration ... 69 5.5. Paper E: Classification of Driver’s Cognitive Load using Non-contact based Physiological and Vehicular Parameters ... 70
CHAPTER 6 ... 73
Conclusions ... 73 6.1. Summary ... 73 6.2. Limitations and Future Work ... 75
P
ART
1
29
CHAPTER 1
Introduction
This chapter presents an introduction together with motivation and goal, research questions and research contributions. An outline of the thesis report is also presented here.
Road crashes killed about 1.3 million and severely injured 50 million people every year around the world [1]. Deficiency in vehicle control occurs due to various mental states of driver, is one of the main reasons of road accidents. It has been shown in the literature that car accidents related cost in Europe is around 160 billion Euros on which 60-80% can be estimated due to the psychophysical condition of the drivers [2]. Driver’s state, for example, cognitive load, fatigue, stress, sleepiness, visual inattention etc. can cause driver impairments. Driver’s state need to be detected and predicted to reduce critical situations that can cause road accidents. These physiological and mental conditions are highly correlated with safe driving. According to the author in [1], in 2015, about 38% of all road traffic crashes and 31% of all road fatalities were attributed to inattentiveness or distraction as the main cause of the crash. Governments and authorities have been taking initiatives in last few years to decrease road crashes. For example, The Swedish government is working with the focus of Vision Zero i.e., a strategic approach for safety driving system by the year 2020. The target of Vision Zero is nobody should be at risk of being fatally or severely injured when being a road user1.
This thesis work presents a non-contact-based approach to classify cognitive load considering physiological and vehicular parameters. In physiological parameters, Heart Rate (HR), Inter-beat-interval (IBI), Heart Rate Variability (HRV), Respiration Rate (RR), Oxygen Saturation (SpO2) etc. are the most important factors to be used for the classification of cognitive load mentioned in [3], [4] and [5]. In general, sensors are attached with human body to extract these physiological parameters. These signals are good in lab experiments but are contaminated with noises in real applications such as in driving condition due to motion, movement, vibration etc. In recent decades,
30 for measuring these physiological information, for example, through facial skin color variation caused by blood circulation [6]. Several research work, for example, [3, 4, 7] show that driver’s cognitive load can be classified using Heart Rate Variability (HRV) where HRV features were extracted from Inter-Beat-Interval (IBI) using Electrocardiogram (ECG) sensor. Again, vehicular parameters e.g. steering wheel reversal rate, steering angle, steering torque, brake stroke, etc. are also investigated to classify driver’s cognitive load [8, 9]. This thesis focuses on three main issues in non-contact based approach 1) extraction of physiological parameters from facial video recordings in different challenging conditions, 2) extraction and selection of vehicular parameters based on driving performance, and 3) application of machine learning techniques for classification of drivers cognitive load.
This thesis work is a part of the “SafeDriver: A Real Time Drivers State Monitoring and Prediction System” project collaboration with Swedish Road and Transport Research Institute (VTI), Volvo Cars Corporation (VCC), Autoliv, Prevas Ab, Karolinska Institute, Hök Instrument, Anpassarna AB and Mälardalen University. The goal of the SafeDriver project is to investigate physiological and vehicular measures using non-contact-based approach to monitor driver’s state in real time for proving early prediction of driver’s mental state. Physiological measures, i.e. HR, RR, IBI, HRV and SpO2 are the main physiological signals which are investigated based on non-contact approach in this project to analyze driver’s state.
1.1. Motivation and Aim
Drivers’ mental health monitoring system that increases the safety of all road users have drawn a lot of attention from the research community and the industry. Today, significant advancement of technologies made it possible to monitor driver's state using physiological sensor signals. Sensor signals for example, EEG, ECG etc. provides more direct and early indication of fatigue, cognitive load and stress. The area of driver monitoring using physiological signals is continually improving. However, one of the important issues is that the sensors will be unobtrusively integrated for efficient monitoring that implies no real distraction in driving.
Recently, there has been increasing interest in low-cost, non-contact and pervasive methods for monitoring physiological parameters. The use of camera imaging has been investigated in recent years as one of the non-contact-based approach. Here, a camera can be mounted into the car face to driver and an area of facial skin is captured by the camera, so, drivers do not need to wear any sensors. Using computer vision and advanced signal processing technology, the physiological parameters such as HR, RR, HRV and SpO2 can be extracted. The aim of this licentiate thesis is to investigate algorithms to classify drivers’ cognitive load by extracting physiological
31
parameters based on driver’s facial images and features from vehicular parameters.
1.2. Problem Formulation
Higher cognitive load is one of the important human factors which has greater impact in risky driving behavior. Sensors are attached with the driver’s body which are not convenient for real road driving and expensive. Therefore, non-contact system is very popular among the research community and industries because of its contactless applications. Still most of the non-contact systems are ok for lab environment with constant amount of ambient light and less movements. Moving environment e.g. in driving condition the physiological parameters are contaminated due to ambient illumination, motion, movement, vibration etc. These challenges should be addressed to use such non-contact approach in driver monitoring context to extract parameters i.e. HR, RR, IBI, HRV and SpO2. Again, extraction of vehicular parameters collected from simulator driving Controller Area Network (CAN) bus are used to classify driver’s cognitive load.
Based on the problem domain this report formulates the following research questions (RQs):
RQ1. What non-contact approaches can be used to classify driver’s mental state, i.e. cognitive load?
RQ2. How to extract physiological parameters based on facial images considering ambient illumination, motion, movement, vibration?
RQ3. What machine learning algorithms can be used to classify driver’s cognitive load using physiological and vehicular parameters?
1.3. Research Contribution
Research contribution for the licentiate thesis are described in the included papers. A summary of research contribution (RC) is presented below:
RC1: A literature study has been done in order to understand the content of driver’s cognitive load monitoring using non-contact-based system [Paper A]. RC2: Implementation and validation of non-contact-based approach to extract physiological parameters from facial images considering ambient illumination, motion, movement, vibration [Paper D].
RC 2 .1 Extraction and validation of physiological parameters using camera [Paper B], [Paper C].
32 RC3: Applying machine learning algorithms to classify driver’s cognitive load based on physiological and vehicular parameters [Paper E].
Table 1 represents the association among research questions, contributions and included papers.
Table 1: Contribution of thesis
Research Question Research Contributions Included Papers What non-contact approaches can be used to classify driver’s mental state, i.e. cognitive load? RC1 A literature review is conducted for driver monitoring, presenting current-state-of-the-art and investigating limitations for driver monitoring systems. Paper A
Intelligent Driver Monitoring Based on Physiological Sensor Signals: Application Using Camera
H. Rahman, S. Barua, and S. Begum, in Intelligent
Transportation Systems (ITSC), 2015 IEEE 18th International Conference on, Canary Island, Spain, 2015, pp. 2637-2642. How to extract physiological parameters based on facial images considering ambient illumination, motion, movement, vibration? RC2, RC2.1 -Implementing methods for extracting physiological parameters using facial images. -HR, RR and IBI extraction for normal sitting position -Extraction of HR considering illumination -Extraction HR, IBI, HRV and SpO2 Paper B, C, D -Non-contact Physiological Parameters Extraction using Camera
H. Rahman, M. U. Ahmed, and S. Begum, in The 1st Workshop on Embedded Sensor Systems for Health through Internet of Things (ESS-H IoT), Oct., 2015.
-Non-contact Heart Rate
Monitoring Using Lab Color Space
H. Rahman, M. U. Ahmed, and S. Begum, in 13th International Conference on Wearable, Micro & Nano Technologies for
Personalized Health
(pHealth2016), Crete, Greece, 29-31 May.2016.
-Non-contact Physiological
33 considering motion, movement, vibration and illumination in simulator environment
Video in Simulator Driving
Scenario Considering Illumination, Motion, Movement and Vibration
H. Rahman, M. U. Ahmed, and S. Begum, Sensors for Health
Monitoring and Disease Diagnosis, 2018 (Submitted). What machine learning algorithms can be used to classify driver’s cognitive load using physiological and vehicular parameters RC3 -Extraction of key vehicular parameters -Classification of driver’s cognitive load using machine learning algorithms based on physiological and vehicular parameters Paper E -Classification of Driver’s
Cognitive Load using Non-contact based Physiological and Vehicular Parameters
H. Rahman, M. U. Ahmed, and S. Begum in Engineering
Applications of Artificial Intelligence, 2018 (Submitted)
1.4. Thesis Outline
This thesis work is divided into two parts. The organization of the first part is as follows:
Chapter 1: An introduction of the thesis including motivation, research
questions, and research contributions of the research work.
Chapter 2: Theoretical background and related works of the methods and techniques that have been applied in this thesis work.
Chapter 3: Materials and methods, i.e. experimental design, data
collection procedures, algorithms for signal processing, image processing, computer vision and classification are presented. Also,
34 with list of extracted features from non-contact physiological and vehicular parameters are presented.
Chapter 5: Research contributions containing a summary of the
included papers.
Chapter 6: Conclusion is presented including summary and future work.
36
CHAPTER 2
Background and Related Works
This chapter presents background and related works including cognitive load, physiological parameters extraction, vehicular parameters extraction and cognitive load classification.
Most of the car accidents happen because of people's unsafe behaviors, which is determined by the person's physical, psychological, environmental and genetic factors [10]. Many aspects of the driver’s conditions may affect the safe driving, for example excessive cognitive load, sleep disorder, clinical depression, alcohol consumption, emergencies (myocardial dysfunction), and even their emotions (anger, excitement, etc.). These physiological and mental conditions are highly correlated with safe driving. Intelligent driver monitoring system is developed based on either driver’s behavior or driving behavior. Driver’s behavior represents both changing of visual features (e.g. facial expressions) and non-visual features (e.g. physiological information changes) whereas driving behavior represents driving tasks. Driver monitoring approaches are presented in Figure 1.
37
Figure 1: Overview of driver monitoring systems
In this thesis, driver’s state, i.e. cognitive load is classified based on several nonvisual features i.e. physiological features and vehicle-based features i.e. vehicular features. A literature review for non-contact based physiological parameters extraction and driver’s state classification is presented in [Paper A].
2.1. Cognitive Load
The term ‘cognitive load’ is relating to cognition which means mental action or process of acquiring knowledge and understanding through thought, experience, and the senses [11]. Human memory can be divided into three categories such as sensory memory, working memory and long-term memory. Cognitive load is the total amount of mental effort being used in the working memory or the amount of information that working memory can hold at one time. Since working memory has a limited capacity, instructional methods should avoid overloading it with additional activities that don't directly contribute to learning. Cognitive load is generally increased when the task of processing information is so much complex and unnecessary demands are imposed on a learner. It is easier to learn well when cognitive load is managed well but higher cognitive load may interfere with the creation of new memories. Cognitive load theory was first outlined by John Sweller in 1988, an educational psychologist at the University of New South Wales, Australia
38 that long-term memories develop when auditory and visual information is processed to a greater degree than other everyday observations.
In this thesis, ‘cognitive load’ is defined as workload imposed on a driver’s cognitive processes by secondary task. Recently, a plenty of in-vehicle information systems is used which induces mental distraction and may affect driving performance [12, 13]. Additionally, secondary tasks such as sending messages or engaging in conversations using personal communication devices while driving, may lead to mental distraction which can impair driving performance [14]. Cognitive load is measured by three ways such as by self-ratings through questionnaires, using physiological measures and by secondary tasks or dual task. To measure cognitive load of driver, several features are used such as muscle movement of driver’s face [15], eye tracking [16, 17], EEG signal [18, 19], physiological parameters [20, 21] etc. However, for extracting physiological parameters by attaching sensors with driver’s body is inconvenient and uncomfortable. Non-contact-based approach, i.e. camera based cognitive load classification approach may open a new paradigm of driver monitoring. In this approach, camera is placed in front of driver’s face about 0.5-1 meter away which is known as non-contact and not-invasive sensor. As camera is not attached with driver’s body therefore it is convenient, easy to use and totally electrical interference free.
2.2. Non-contact Parameters Extraction
2.2.1. Physiological Parameters
For camera-based system, a ROI is selected from any part of the body which is not occluded. RGB color signals are generated from ROI and physiological parameters are extracted from color signals. Literature show that ROI is selected from different parts of the body such as facial skin [22-30], skin of hand or neck [31-33], finger [34-36] and eyes [37, 38]. However, facial image is widely used as an input for camera based physiological parameters systems as it is convenient and flexible. In 1995, the first remote, noncontact pulse oximetry and camera images was investigated for monitoring health using only a color camera to measure remote PPG signals by Costa et al. [33]. But their approach did not report quantitative results; only a graph of heartbeats was presented but no correlation with reference signals (i.e. simultaneous ECG) were reported. Again in 2005, another method was introduced for the measurement of computer user’s emotional state using the facial thermal image using a thermal camera [39]. Their experiment was conducted with 12 users and the authors found some interesting fact that user stress was correlated with increased blood flow in the frontal vessel of the forehead.
In 2006, Takano et al. showed that RR, HR could be acquired simultaneously using a digital CCD camera with normal ambient light [30]. The images of a part of the subject’s facial skin were consecutively captured,
39
and the changes in the average image brightness of the region of interest (ROI) were measured for a short time. Their system could detect HR for a certain period of time but the efficiency was unknown. However, the term ‘brightness’ in the article was confusing as physiological parameters were extracted from color variation in ROI instead of brightness. Later in 2007, Garbey et al. developed a contact-free measurement of cardiac pulse based on the analysis of thermal images [32]. In this article ROI was selected from facial skin as well as hand’s skin. The authors used the temperature of the vessel which was modulated by pulsative blood flow and directed to the recovering of frequency of the component signal with the highest energy content [32]. Again, in 2008, by Verkruysse et al. [40], an inexpensive digital camera was used to extract HR and RR from facial video recorded in ambient light. Their system was able to extract HR and RR from 30 seconds to a few minutes. However, they did not consider illumination variation in their experiment. Banitsas et al. in 2009, used smart phone to record PPG signals from user’s finger and they were able to extract HR [41]. In other different experiments HR and RR were extracted by smart phone camera using user’s finger in [25], [34] and [42].
In recent years, camera-based systems have been further improved. In 2011, Poh et al. at the Affective Computing Research Group in MIT proposed an algorithm to extract underlying source signals from R, G, and B color bands [27]. They used ICA for blind source separation and extracted HR and HRV from 1-minute color facial video recording considering normal sitting position. In the same year, several other experiments were taken place such as [24] and [43]. However, the state-of-the-art methods are good for laboratory applications in normal sitting position. In real applications e.g. driver monitoring, environmental illumination changes frequently and the dynamic illuminance changes can cause artifacts in color signals. A motivation has been observed in 2014 by Xiaobi et al. to reduce environmental illumination artifacts from RGB color signals using Normalized Mean Least Square (NLMS) adaptive filter [24]. They achieved good correlation and agreement between proposed method and reference sensor considering indoor environment. However, no motivation is observed how their proposed method can be used for real applications in outdoor environment considering motion, movement and vibration. Again, Li et al. have utilized an adaptive filter to reduce the artifacts from illuminance variations [24]. However, their experimental setup have not included the dynamic illuminance changes and their reduction method has not been evaluated independently. Another method by Jeanne at al. have presented IR camera-based heart rate monitoring system in a dynamic light environment for normal sitting in lab setting [44]. The authors mention that their approach has limitation considering vibration and motion.
Non-contact camera-based systems need to consider another important issue, i.e. motion artifacts which is caused by motion, movement and vibration. In literature several techniques are used for removing motion
40 method, SVD (Singular Value Decomposition) method, wavelet de-noising methods and adaptive filtering methods [45]. A spatial restoration algorithm was introduced using non-linear interpolation technique for eliminating motion artifacts [46]. This algorithm preserves the edges surrounding the artifact area of the image sequences and mostly used in biomedical applications. Authors in [47] presented an algorithm using Convolutional Neural Network (CNN) to detect motion artifacts automatically in MRI images. Recently some works [48], [49], [50], [24] considering motion artifacts have been reported to extract physiological parameters using camera without considering illumination and vibration.
Several other approaches are also observed to extract physiological parameters from driver’s facial video recordings. In 2014, Zhang et al. developed a webcam based noncontact system for monitoring physiological information of drivers [51]. The authors have applied FFT to measure HR and RR from driver’s facial video in real time. However, they did not explain how motion artifacts and illumination variation have been considered. Also their evaluation results does not show correlation and agreement with the reference sensor. In the same year, Guo et al. showed similar approach to monitor driver’s HRV continuously under real world driving circumstances [23]. The authors applied Independent Vector Analysis (IVA) technique to extract HR from driver’s facial video but they failed to overcome motion and illumination artifacts. Again in [52], authors presented Multiset Canonical Correlation Analysis (MCCA) approach to extract HR and HRV from driver’s facial video both in laboratory setting and real road driving. They have shown that their approach achieved better performance than ICA based approach considering motion artifacts. However, the authors did not consider illumination and vibration.
2.2.2. Vehicular Parameters
Vehicular parameters are another source of non-contact data which are used to classify driver’s cognitive load. A commonly used vehicular data for mental state monitoring are longitudinal velocity, lateral velocity steering wheel angle, steering wheel torque, yaw rate, longitudinal acceleration, lateral acceleration, yaw acceleration, break, throttle position, lane departure, lateral position, longitudinal position etc. It is shown that the effect of mental load for better driving performance rely on the right speed of the vehicle [53]. A reduced speed as a compensatory action due to increased mental load or distraction is more often used as an indication of behavior adaption rather than a change in driving performance [54, 55]. Another important parameters steering wheel angle and lane positioning are used to measure driving performance [56]. A Lane change task can be used to investigate effects of cognitive load on driving performance [57]. The authors in [54] presents few other parameters such as lateral position, Steering Wheel Reversal Rate (SWRR) which can contribute to driver’s cognitive load. Lateral position is
41
measured in meters (m) and defined as the distance between the right hand parts of the front right wheel to the left part of the right hand lane marking. When the wheel crosses the lane marking the lateral position becomes negative. Lateral position reflects strategy, for example by driving more towards the relatively safe emergency shoulder to adapt the safety margins [54]. SWRR is defined as the number of changes in steering wheel direction per minute (turns/minute). For a reversal to count an angle difference of around 2° between steering end values is required. The number of changes in steering wheel rotational directions reflects the frequency of steering corrections, not the magnitude of them. In this thesis work, vehicular parameters such as lateral speed of the car, steering wheel angle, steering wheel torque, yaw rate, lane departure, and lateral position are collected during driving and are used to classify driver’s cognitive load.
2.3. Classification
In machine learning, two types of techniques, i.e. supervised learning and unsupervised learning are used where in supervised learning a model is trained on known input and output data so that it can predict future outputs and in unsupervised learning hidden patterns or intrinsic structures are found in input data. In this thesis, supervised learning is used as classification technique to detect driver’s cognitive load which is presented in figure 2. This basic technique consists of preprocessing of input data that includes cleaning/filtering, artifacts handling etc.; features/attributes extraction from the processed data that are used for training and testing the classifier; and perform driver’s cognitive load classification using one or more classification algorithms and provide feedback to the driver as output [Paper A].
Figure 2: Intelligent driver monitoring system [58]
Physiological signals extracted from facial images are pre-processed. One of the key task in classification is feature extraction. HRV is the key marker for cognitive load classifications that can be obtain from IBI data [59]. Several HRV features both in time domain and frequency domain are extracted from IBI which are presented in chapter 4. In the classification scheme it is required to use a best fitted classifier based on the domain knowledge. From the literature, it is observed that several machine learning algorithms are used for classification of mental state such as cognitive load, sleepiness, stress etc. In
42 They conducted driving experiment in simulator with 46 people and extracted features based on facial expressions. Again in [60], three machine learning algorithms i.e. Decision Tree (DT), Bayesian Network (BN) and Support Vector Machine (SVM) have been used to classify mental stress using Electrocardiogram (ECG) and Galvanic Skin Response (GSR). They achieved better classification accuracy considering SVM than other two classifiers. SVM classifier is also used in [18] and in [61] for the cognitive load classification. In another experiment KNN classifier was used to detect driver’s stress based on HRV features under different conditions [62]. In [63], deep learning method, i.e. Convolutional Neural Networks (CNN) with large-margin SoftMax loss function was used to classify cognitive load. The authors extracted features for the classification based on EEG (electroencephalography) signals. In [18], EEG signals acquired from the subjects during program analysis and fuzzy rule-based classifier was used to determine the class of the cognitive load of the subjects.
44
CHAPTER 3
Experimental Design and Methods
This chapter presents the experimental design and non-contact-based approach for driver’s cognitive load classification. A Summary of the three data collection procedures are described in this chapter. The evaluation methods are also presented. Here ethical issue is included in the last section of this chapter.
In this thesis inductive research method has been used. Initially related literature is studied which enables formulation of unsolved problems. Research questions are formulated based on state-of-the-art challenges and solving the challenges yields research results. The design of the measurement system will become more and more detailed when new challenges are faced, and the implementation is updated over time. The validation of the non-contact methods is performed using various statistical and graphical parameters with respect to stablished system, i.e. sensor-based system.
3.1. Experimental Design
For experiments, this thesis work considers three data sets which are collected in three phases, 1) considering Lab condition i.e. normal sitting positions with room light, 2) considering ambient illumination, motion, movement, vibration using simulator2, and 3) aiming driver’s cognitive load using a driving
simulator (SIM III)3 provided by The Swedish National Roads and Transport
Research Institute (VTI) [64]. A short description of data collection experiments is presented below:
Experiment 1: The goal of this study was to extract physiological
parameters, i.e. HR, RR and IBI and to validate the results with a reference sensor system. In this experiment, 9 subjects participated with different genders (3 females, 6 males), ages (25 to 40 years) and mixed skin color. The experiments were conducted in indoor lab environment with room light and the test subjects were asked to sit as still as possible. Participants were informed about the aim of the study and they seated on a table in front of a laptop at a distance of approximately 0.5 meter from the built-in webcam (HP HD webcam). During the experiment, participants were asked to keep still,
2
https://www.volvoce.com/united-states/en-us/services/volvo-services/productivity-services/training-si-mulators/.
45
breathe spontaneously, and face the webcam while their video was recorded for 10 minutes. All videos were recorded in color (24-bit RGB) at 30 frames per second (fps) with pixel resolution of 640 × 480 and saved in AVI format in the laptop. Simultaneously, reference HR, RR and IBI were also recorded using ECG sensors and cStress4 system [Paper B, Paper C].
Experiment 2: The aim of this study was to compare the improved approach
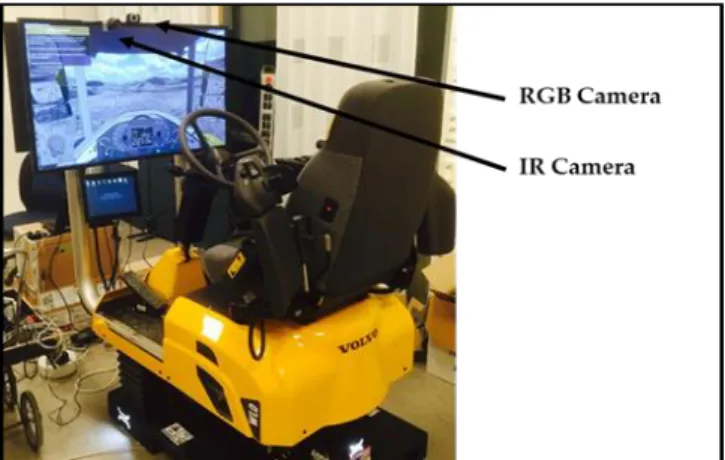
with the reference system considering ambient illumination, motion, movement, vibration. Here, 30 participants were randomly selected from those who were interested in the experiment as voluntarily. Among them, there were 24 male and 6 female participants with the age range between 20 to 50 years and mixed skin color. In addition, all participants reported as they were healthy, no sleep problems, no alcohol 72 hours before arrival, no smoke or use caffeine 3 hours before experiment and no problems with motion sickness. The experiment was conducted using Volvo Construction equipment (VCE) simulator which is generally used for bucket filling for construction site shown in Figure 3. As the simulator had omnidirectional motion and vibration while driving, this information was recorded. Again, the illumination of the environment was changed by switching ‘On’ and ‘Off’ and the amount of light was recorded by Lux meter5. A downhill scenario was selected for the
experiment which included one of the most complex road condition. Each experimental session for a test subject was thirty minutes long where the first ten minutes was for experimental setup such as attaching the reference sensor with the driver’s body, signing the consent letter and giving instructions about the experiment.
Figure 3. Volvo CE simulator
In the second ten minutes, each participant practiced driving to become familiar with the simulator functionalities. The last ten minutes were allocated for the real driving experiment where facial video of the driver for the first
4http://stressmedicin.se/neuro-psykofysilogiska-matsystem/cstress-matsystem/. 5https://www.clasohlson.com/uk/Lux-Meter/32-7361
46 five minutes in dark conditions (i.e. light is off). The amount of light for both situation was measured using lux meter and the highest amount of light was 340 lux when light was on and the lowest amount of light was 35 lux when the light was off. An iPhone 6 was kept on the platform of the simulator and ios app ‘vibSensor’6 was used to record vibration of the simulator. The average
vibration of the simulator recorded as 5 Hz. However, the average vibration in a passenger car is 1-3 Hz [65] [Paper D].
Experiment 3: The aim of this study was to collect cognitive load
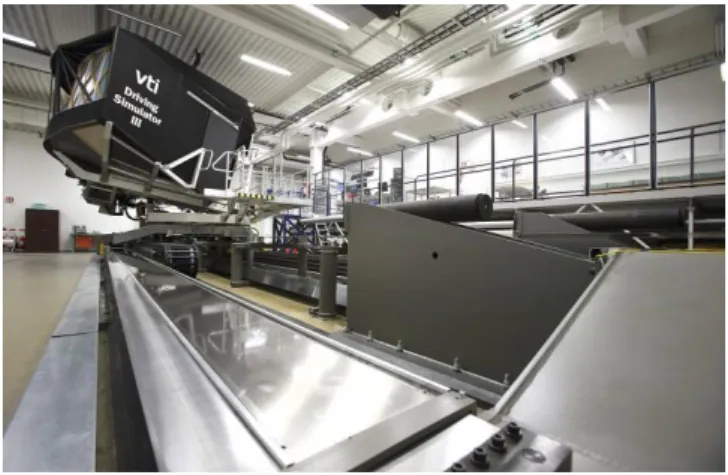
measurements in control environment. The data has been collected using a driving simulator (SIM III) in The Swedish National Roads and Transport Research Institute (VTI) [64] shown in Figure 4. The simulator includes sound, infrasound and vibrations inside the cabin correspond to the level in a modern real car. It has three LCD-displays for rear mirrors and six projectors for visualization of the frontal view with a horizontal field of view of 120 degrees. The simulator has a cabin of a Saab 9-3 and for this experiment manual gear box is used. The data collection was conducted in two separate studies by 66 test persons where in each study 33 participants were involved. However, three participants, i.e. 2nd, 8th and 9th were excluded in study 2 due
to interruption of the experiment before the allocated time.
Figure 4. VTI car simulator (SIM III)7
All the participants were randomly selected from the register of vehicle owners who are male, 35-50 years old and having height of 160-195 cm. The driving habits of each of the participant was 100-500 km/week and 5000-25000 km/year and they have driving license for more than 10 years. They didn’t have any hearing problem and their stress tolerance was normal. During data collection, three different types of Visual Cue Adaptation (VCA) scenarios such as Hidden Exit (HE), Car From Right (CFR) and Side Wind
6https://itunes.apple.com/us/app/vibsensor-accelerometer-recorder-vibration-analysis/id932854520?mt=8. 7https://www.vti.se/en/research-areas/vtis-driving-simulators/
47
(SW) were used and each VCA scenario was passed once during no cognitive load (baseline), once during Low Cognitive Load (LCL) and once during High Cognitive Load (HCL) which were labeled as class ‘0’, class ‘1’ and class ‘2’ respectively. The different levels of cognitive load were manipulated with the help of a cognitive task. A number was aurally presented through the simulator’s speakers every two seconds and the participant were to respond whenever the last presented number was the same as the previous one (i.e. when the same number was presented twice in a row). The participants responded by pressing a button mounted on his right index finger against the steering wheel. The VCA scenarios occurred in the same order for all the drivers in order to make it possible to compare cognitive load levels. The total driving time was 40 minutes where 10 minutes for practice driving and 30 minutes for test driving. However, the allocated driving time for every scenario was 60 seconds [Paper E].
3.2. Methods
In order to develop an intelligent non-contact-based approach to monitor driver’s cognitive load based on physiological parameters and vehicular parameters several image processing, computer vision, signal processing and machine learning algorithms are used which are presented in this chapter.
3.2.1. Image Processing and Computer Vision Methods
Algorithms for image processing and computer vision have been applied in different steps: 1) Face Detection, 2) ROI Selection, 3) Facial Landmarks Selection and 4) Transformation of RGB to Lab Color Space.
Face Detection: To extract color values from facial image, face detection
is necessary for every image frame. Here, the Viola and Jones an image processing algorithm has been used as a classifier to select a small number of visual features [66] [67]. For the first frame, to identify the coordinates of the face location, Viola and Jones uses a boosted cascade classifier. This method identifies x and y-coordinates along with the height and width to define a rectangular box around the face [68]. Figure 5 shows an image of (640 x 480) and the coordinates of detected rectangular box by Viola and Jones algorithm are P1(p11,p12), P2(p21,p22), P3(p31,p32) and P4(p41,p42).
48
Figure 5: Face detection
However, the coordinates of rectangular box cannot be defined if a subject moves in omni-direction, i.e. left/right/front/back. For example, in Figure 5, if the subject moves his/her head left, right, up or down then point P1, P2, P3 and P4 can go outside of the image frame. In that case we cannot calculate the rectangular box. Further in this work, a geometrical transformation formula is developed to define the rectangular box considering omni-directional movements. The following 12 equations in figure 6 are applied to overcome this problem. Let, x = 640 and y = 480.
Figure 6: Geometrical formulas for ROI correction
ROI Selection: ROI or region of interest is an approach to select a facial
skin from a face frame where RGB (Red, Green and Blue) colors signals are extracted. A rectangular box is plotted to define face using the coordinates of facial region shown in Figure 7(a) and 7(b). However, the box contains little
(i) if p11 <1 && p12 <1 then p11 =1;p12 =1; (ii) if p11 <1 && p12 >1 then p11 =1; (iii) if p11 >1 && p12 <1 then p12 =1; (iv) if p21 >y && p22 <1 then p21 =y;p22 =1; (v) if p21 >1 && p22 <1 then p22 =1; (vi) if p21 >y && p22 >1 then p21 =y;
(vii) if p31 >y && p32 >x then p31 =y; p32 =x; (viii) if p31 >y && p32 >1 then p31 =y;
(ix) if p31 >1 && p32 >x then p32 =x; (x) if p41 <1 && p42 >x then p41 =1;p42 =x; (xi) if p41 <1 && p42 >1 then p41 =1;
49
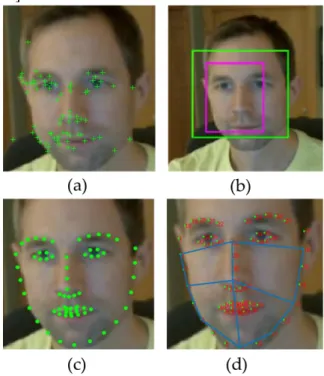
amount of non-facial skin which is unnecessary for camera based physiological parameters extraction technique. Therefore, the ultimate ROI is further defined by another rectangular box inside the first box which is equivalent to 60% width and 80% height of the first box shown in Figure 7(b). ROI is detected automatically for every image frame which is computationally expensive. To speed up the ROI selection, face is tracked in every image frame using the Kanade-Lucas-Tomasi (KLT) face tracking algorithm. Facial tracking is performed based on the selected features in first image frame. Here, matlab function ‘detectMinEigenFeatures’ is used for feature selection [69] [Paper B, Paper C].
Figure 7: (a) Facial features selection for M1 (b1) ROI selection for method M1 (c) facial landmarks selection for M2 (d) four ROI selection for M2
Facial Landmarks Selection: In traditional method, facial features are
selected based on edges and corners in facial region. The number of selected features and their locations vary in each frame due to motion, movement and vibration while video recording. In this thesis, multiple ROI selection method is proposed. First, 66 facial landmarks are selected which are pre-defined facial key points. These landmarks are automatically detected in image frame using Discriminative Response Map Fitting (DRMF) method [70] and they are numbered from 1 to 66 shown in Figure 7(c). Then, four ROI is detected where first ROI is selected using the landmarks 2, 4, 31 and 28; second ROI is selected using the landmarks 4, 6, 9 and 31; third ROI is selected using 9, 11, 13 and 31 and fourth ROI is selected using 13, 16, 28 and 31 which is shown in Figure 7(d). In each frame, average RGB values are extracted from
50 However, depending on the face position due to head movement in left/right, one or two ROI are ignored.
Transformation of RGB to Lab Color Space: RGB image of an object may
look different when they are captured by different camera and different environmental light [8]. On the other hand, Lab color space is device independent where L represents the lightness of the image and the color channels ‘a’ and ‘b’ represents the other color combinations. ‘a’ axis represents red/green opponent color with green at negative a value and red at positive a value. ‘b’ axis represents yellow/blue opponent colors with blue at negative b values and yellow at positive b values. A true neutral gray values at a = 0 and b = 0 and L = 0 represents completely black and L = 100 represents the brightest white [71]. In this thesis, physiological parameters are extracted using Lab color space instead of RGB color space and the transformation of RGB images into Lab color space is shown in [Paper C].
3.2.2. Signal Processing Methods
The three signal processing algorithms are used in this thesis which are Fast Fourier Transform (FFT), Independent Component Analysis (ICA) and Principal Component Analysis (PCA).
First Fourier Transform (FFT): it is one of the top 10 algorithms in 20th
century by IEEE journal computing in science and engineering [72]. FFT algorithm samples a signal over a period of time and divides it into frequency components. Let us assume 𝑥(𝑛1, 𝑛2) is a stable sequence of color values and it’s fourier transform is X(𝑤1, 𝑤2) [73].
X(𝑤1, 𝑤2) = ∑𝑛∞1=−∞∑∞𝑛2=−∞x(𝑛1, 𝑛2)𝑒−𝑗𝑤1𝑛1𝑒−𝑗𝑤2𝑛2 (3.1)
The function X(𝑤1, 𝑤2) which represents the amplitude associated with the complex exponential 𝑒−𝑗𝑤1𝑛1𝑒−𝑗𝑤2𝑛2 can be obtained from x(𝑛
1, 𝑛2). Here,
X(𝑤1, 𝑤2) seems complex in general even though x(𝑛1, 𝑛2) is real. It is often convenient to express X(𝑤1, 𝑤2) in terms of its magnitude |X(𝑤1, 𝑤2)| and
phase 𝜃x(𝑤1, 𝑤2) or real part 𝑋R(𝑤1, 𝑤2) and imaginary part 𝑋I(𝑤1, 𝑤2) as
X(𝑤1, 𝑤2) = |X(𝑤1, 𝑤2)| 𝑒−𝑗𝑤1𝑛1𝑒−𝑗𝑤2𝑛2
= |X(𝑤1, 𝑤2)| 𝑒j𝜃x(𝑤1,𝑤2)
=𝑋R(𝑤1, 𝑤2)+ 𝑋I(𝑤1, 𝑤2) (3.2)
In our case, FFT is performed to transform PPG signal time series into frequency domain to identify peaks which is caused by each heartbeat.
51
Principal component analysis (PCA): in PCA, multi-dimensional data is
projected onto the singular vectors corresponding to a few of its largest singular values [74]. This operation effectively decomposes the input signal into orthogonal components in the directions of largest variance in the data. Even though, PCA is often used in dimensionality reduction applications, where performing PCA yields a low-dimensional representation of data that can be reversed to closely reconstruct the original data. The basic idea in PCA is to find the components 𝑠1(𝑡), 𝑠2(𝑡), … , 𝑠𝑁(𝑡) so that they explain the maximum amount of variance possible by N linearly transformed components. The principal components are then given by 𝑠𝑖 = 𝑤𝑖𝑇.x. The computation of 𝑤𝑖 can be accomplished bu using the covariaence matrix E(
x𝑥𝑇) = C. The vectors 𝑤
𝑖 are the eigenvectors of C that corresponds to the N
largest eigenvalues of C. These components should be ordered in such way that the first component, 𝑠1, points in the direction where the inputs have the highest variance. The second component is orthogonal to the first and points in the direction of highest variance when the first projection has been subtracted, and so forth.
Suppose we have two zero mean random vectors, X and Y, that gives E[X] = 0 and E[Y] = 0. Let u denote a unit vector, onto which the X is to be projected. This projection is defined by the inner product of the vectors X and U, as shown by
Y = 𝑈𝑇X (3.3) where U is an orthonormal matrix. The principal components are columns of U and they are found by seeking the directions of maximum data variance, under the orthogonality constraint. Columns of U are eigenvectors of the covariance matrix ordered with decreasing variance [11]. In this case, we have a mixture of red, green and blue color signal we want to investigate which signal is principal signal using PCA.
Independent component analysis (ICA): it is a technique for separating
independent signals from a linear mixtures [75]. Here the mixture of source signal is color RGB signal which are extracted from facial images. When facial video is recorded by a camera, the RGB color sensors pick up a mixture of the reflected plethysmographic signal along with other sources of fluctuations in light due to artifacts. These observed signals from red, green and blue color sensors are denoted as 𝑠1(𝑡), 𝑠2(𝑡) and 𝑠3(𝑡) respectively. These signals are the amplitude of the recorded signal at time t. Let us assume that the three original color signals are 𝑐1(𝑡), 𝑐2(𝑡) and 𝑐3(𝑡) respectively. The ICA model assumes that the observed signals are linear mixtures of the sources, i.e., and A is square 3 × 3 matrix contains the mixture coefficients.
52 Where, 𝑆(𝑡) = [𝑠2(𝑡) 𝑠3(𝑡) ], 𝐶(𝑡) = [𝑐2(𝑡) 𝑐3(𝑡) ]
The goal to use ICA method is to find a demixing matrix B which is an approximation of the inverse of matrix A. Therefore, the output will be:
𝐶𝑜𝑢𝑡(𝑡) = 𝐵𝑆(𝑡) (3.5) Here 𝐶𝑜𝑢𝑡(𝑡) is an estimation of 𝐶(𝑡) containing the original source signals.
3.2.3. Classification Methods
To classify the drivers’ cognitive load three machine learning algorithms e.g. Logistic Regression (LR), Support Vector Machine (SVM) and Linear Discriminant Analysis (LDA) are considered an instance of supervised learning in which an algorithm learns to classify new observations from examples of previous labeled data [76]. During each classification, 70% of data are randomly selected for training and rest 30% of data are selected for testing and 5-fold cross validation approach is considered.
Logistic Regression (LR): it is a machine learning algorithm which is used
to analyze data set consist of one or more independent variables to determine one outcome. Logistic regression is the extended version of linear regression [77]. Equation (3) represents the linear regression
hθ(x) = θ0+ θi× xi , (3.6)
Where θ0 and θi are the regression coefficient and xi and yi are the dependent variable and predicted value respectively. θ0and θi can be solved from the equation (5) and (6) below.
θ0 = hθ(x) − θi× xi , (3.7) θi = (∑ (xi− x)(hθi(x) − hθ(x)))(∑ (xi− x)2 i ) i , (3.8)
In logistic regression, ℎ𝜃(𝑥) must be 0 ≤hθ(x)≤1. The equation (6) below is the logistic regression function
hθ(x) = eθTx
eθTx+1 = 1/(1 + e
−θTx
) , (3.9)
53
J = (1/(m))*[-y' *(log(g))-(1 - y)'*log(1-g)],
(3.10)
Where, g = 1/(1 + 𝑒−𝜃𝑇𝑥). The cost function is minimized in such a way so that θ0 and θi be best fitted with the hypothesis hθ(x).
Support Vector Machine (SVM): it constructs a hyperplane or a set of
hyperplane to analyses data to identify pattern and commonly used for classification and regression analysis [78]. In our case, polynomial kernel function is used for similarity matching as data sets are not linearly separable [79]. Matlab function ‘fitcsvm’ is used for building the SVM classifier for the training data sets using polynomial kernel with order 2. Initially for the experiment, different orders are used for the polynomial kernel and it is observed that second order polynomial kernel produces better result than higher order polynomial and hence, all of the experiments in this paper for SVM are conducted by polynomial kernel with order 2. The function takes predictors and response as input where predictor is a matrix based on all features set and response is a vector based on class label of the feature set.
Linear Discriminant Analysis (LDA): it is also known as Fisher’s
discriminant, generates different classes based on different Gaussian distributions [80]. Matlab function ‘fitcdiscr’ is used for LDA classifier for the training data sets where linear discriminant is used. The parameter ‘Gamma’ for regularizing the correlation matrix for predictors is SET TO zero. The function takes predictors and response as input where predictor is a matrix based on all features set and response is a vector based on class label of the feature set.
3.3. Evaluation Methods
Physiological parameters extracted by camera system are evaluated with reference sensor system using several statistical, geometrical and graphical parameters and plots. The purpose of the evaluation is to see the closeness, correlation and agreement of two systems. Evaluation is conducted using statistical parameters such as Minimum (MIN), Maximum (MAX), MEAN and Standard Deviation (STD). Also, various errors such as Mean Error (ME), Root Mean Squared Error (RMSE) and Standard Deviation of Error (SDE) are calculated considering two methods. To see the closeness of the two systems, correlation coefficient and scattered plot is presented. Bland Altman plot is demonstrated to see the agreement between camera and reference sensor system. Also, Poincare’ plots are shown for the self-evaluation of each signal and then camera system and reference sensor system are compared. Another evaluation method, i.e. signal quality index (QI) is calculated and plotted for the evaluation of IBI. In this section, all these methods are presented.
54 MIN: Minimum or MIN is the smallest observation in a data sample.
MAX: Maximum or MAX is the largest observation in a data sample.
MEAN: Mean is the average value of the sample data set and calculated as: 𝑀𝐸𝐴𝑁 = 1 𝑛(∑ 𝑥𝑖 𝑛 𝑖=1 ) (3.11)
Where 𝑥1, 𝑥2, … … , 𝑥𝑛 the observed values of the sample and n are is the
number of the sample.
STD: Standard deviation or STD is the amount of variation of a data sample. A low STD indicates the closeness of the data sample to the mean while a high standard deviation indicates that the data points are spread out over a wider range of values. The formula for the sample standard deviation is 𝑆𝑇𝐷 = √∑ (𝑥𝑖− 𝑥̅) 2 𝑛 𝑖=1 𝑛 − 1 (3.12) Here, 𝑥1, 𝑥2, … … , 𝑥𝑛 the observed values of the sample, 𝑥̅ is the average
value and N is the total number of sample.
ME: Mean error or ME refers to the average of all the errors in a set. ME is also called mean absolute error and defined as follows:
𝑀𝐸 = 1
𝑛(∑ |𝑥1,𝑡− 𝑥2,𝑡|
𝑛 𝑖=1
) (3.13)
Here, 𝑥1,𝑡 𝑎𝑛𝑑 𝑥2,𝑡 are two time series of physiological parameters
recorded by cStress and extracted by facial images respectively.
RMSS: Root Mean Square Error (RMSE) measures how much error there is between two datasets. In other words, it compares a predicted value and a known value. RMSE is calculated as follows:
𝑅𝑀𝑆𝐸 = √∑ (𝑥1,𝑡− 𝑥2,𝑡)
2 𝑛
𝑖=1
𝑛 (3.14) Here, 𝑥1,𝑡 𝑎𝑛𝑑 𝑥2,𝑡 are two time series of physiological parameters
recorded by cStress and extracted by facial images respectively.
SDE: Standard Deviation Error (SDE) is the amount of variation of error between two data sets and calculated as follows:
𝑆𝐷𝐸 = √∑ (𝐸𝑖− 𝐸̅)
2 𝑛
𝑖=1


![Figure 2: Intelligent driver monitoring system [58]](https://thumb-eu.123doks.com/thumbv2/5dokorg/4858700.132170/43.718.169.550.603.735/figure-intelligent-driver-monitoring-system.webp)