e l/Tire-1:;
355A
1990
Subjects Task Performance,
Speed and Cognitive Load as a
Function of Task Demands in
Driving Simulation
Lisbeth Harms
m
Vag- Statens va'g- och trafikinstitut (VT/l 0 58 1 0 1 Linkb'ping
[SS/V 0347-6030
VTIrart
355A
1990
Subjects Task Performance,
Speed and Cognitive Load as a
Function 0f Task Demands in
Driving Simulation
Lisbeth Harms
as
Vag- 00/)
Statens va'g- och trafikinstitut (VTI) - 58 1 0 7 Linkb'ping
IIIStItlltet Swedish Roadand Traffic Research Institute - 8-581 01 Linkb'ping Sweden
CONTENTS
Page
ABSTRACT I SUMMARY II 1 INTRODUCTION 1 1.1 Speed and cognitive load in driving 1 2 BACKGROUND 1 2.1 Previous field studies 1 3 EXPERIMENT 1 3 3.1 Objective 3 3.2 Method 4 3.2.2 Calcuation task 4 3.2.3 Visual tasks 4 3.2.3.1 Color-task 4 3.2.3.2 Name-task 5 3.2.4 Subjects 6 3.2.5 Instruction 6 3.2.6 Apparatus 7 3.2.7 Procedure 7 4 RESULTS OF EXPERIMENT 1 9 4.1 Subjects performance in responding to the visual tasks 9 4.2 Variations in subjects speed 11 4.3 Variation in subjects cognitive load 12 5 DISCUSSION OF EXPRIMENT 1 13 5.1 The influence of the task variations on subjects
general performance 13 5.2 The importance of stimulus codes and practice conditions 14 6 EXPERIMENT 2 15 6.1 Method 15 6.1.1 Color-task 16 6.1.2 Name-task 16 6.1.3 Subjects 16 6.1.4 Procedure 16 7 RESULTS OF EXPERIMENT 2 18 7.1 Subjects performance in responding to the visual tasks 18 7.2 Variation in subjects speed 20 7.3 Variation in subjects cognitive load 22 8 DISCUSSION OF EXPERIMENT 2 22 8.1 The influence of the task variations on subjects
general performance 22 9 GENERAL DISCUSSION 23 9.1 The effect of stimulus categories and practice conditions 23 9.2 Subjects performance in real traffic and driving
simulation 24 9.3 Task priority in real traffic and driving simulation 25 9.4 The relationship between task demands, speed and
processing resources 26
10 CONCLUDING REMARK ACKNOWLEDGEMENT
REFERENCES
VTI REPORT 355A
27
29 3O
Subjects Task Performance, Speed and Cognitive Load as a
Func-tion of Task Demands in Driving SimulaFunc-tion.
by Lisbeth Harms
Swedish Road and Traffic Research Institute (VTI)
8-581 01 LINKOPING, Sweden
ABSTRACT
Subjects speed and task performance were evaluated as a func-tion of the processing demands of two different visual tasks in
simulated driving. In addition, the variation in subjects'
cognitive load was measured by a dual-task method and related to the demands of the visual tasks.
The general pattern of results is discussed in relation to simi-lar results from previous dual-task studies in real traffic. The importance of the subjects speed variation to their task per-formance and cognitive load is discussed.
II
Subjects Task Performance, Speed and Cognitive Load as a
Func-tion of Task Demands in Driving SimulaFunc-tion.
by Lisbeth Harms
Swedish Road and Traffic Research Institute (VTI)
8-581 01 LINKoPING, Sweden
SUMMARY
The present study was based on a dual-task method previously
used for the measurement of variation in drivers cognitive load
in response to variations in task demands in real traffic.
The study was conducted in a driving simulator. It aimed at rep-licating the method and measurements from the previous field studies and at performing a further investigation of subjects speed and cognitive load in response to systematic variations of two tasks presented at the visual interface of the VTI-driving simulator. In addition to the measurements of speed and cogni-tive load corresponding to the measurements from the previous studies, the present study included measurements of subjects performance in responding to the visual tasks.
Experiment 1 presented subjects with variations of a color-discrimination task, using consistent practice (i.e. the target was the same in all trials and conditions), and with variations of a search-task using names as stimuli and varied practice (i.e. the targets and distractors were intermixed across trials). It was found that the subjects performance was essent-ially uninfluenced by variation in discriminability for the color-task whereas the variations used for the name-task influ-enced subjects performance thoroughly. Increasing the number of names (targets and distractors) in the task caused subjects to reduce their speed. Subjects mean reaction time and error rate in responding to the task increased and a small increase in the subjects cognitive load was observed.
Experiment 2 presented subjects with variations of a color-task
using varied practice and variations of a name-task using
III
sistent practice. Both tasks were varied by the number of items included in the task. The two tasks influenced subjects' perfor-mance similarly. Subjects reduced their speed with an increasing number of items used for a task and subjects reaction time and error rate in responding to the tasks increased. For the color-task, using varied practice, an increase in subjects cognitive load was observed.
It was concluded that the subjects' spontaneous speed adjust-ments in response to increased difficulty of the two visual tasks did not prevent a degradation in subjects performance in responding to them. The number of items used for a task was cru-cial to the variations in subjects performance, whereas the pattern of results was similar for both the practice conditions and both the stimulus codes. However, only the tasks using varied practice caused an increase in the subjects' cognitive load.
Apparently the task priority differed between the subjects per-forming in the simulator study and subjects performing in real traffic. In real traffic the high task demands associated with complex traffic environments increased the drivers cognitive load. In driving simulation high task demands caused a degrada-tion of subjects task performance in responding to the task. However, both the previous studies of real traffic and the present simulator study demonstrated that the subjects sponta-neous speed adjustments did not prevent variations in the de-mands of the tasks from influencing the subjects performance.
1 INTRODUCTION
1.1 Speed and cognitive load in driving
The fact that driving speed is strongly associated with traffic safety may lead to the assumption that the drivers' spontaneous speed adjustments represent their active control of the driving task. The drivers spontaneous speed adjustments may serve the purpose of maintaining a rather constant information processing rate independent of the variations in the demands of the driving task caused by variation in the traffic environments.
It may be questioned, however, whether the drivers spontaneous speed adjustments can prevent complex traffic environments from inducing a heavier load on the drivers' limited-capacity proces-sing system than do simple driving environments. Variation in the drivers' cognitive load may therefore be an important mea-sure in evaluating the relationship between driving environments and driving performance. Objective methods for the measurements of variation in drivers' cognitive load would be useful for this purpose.
2 BACKGROUND
2.1 Previous field studies
Assuming that variations in the traffic environment would induce
measurable variation in drivers cognitive load, Harms (Harms 1986 and 1988) used a dual-task method for investigating drivers cognitive load in real traffic. The measurements were undertaken on a number of preselected driving routes including either a village area or a rural junction. Professional drivers participated in the driving experiments. They were instructed to drive as they would usually do and to respond to verbally presented calculation tasks at their own pace. Presuming that
each calculation task used the same amount of processing capa-city, the time used by the subjects for performing a calculation operation would also be constant. Systematic variation in subjects reaction times in calculating would therebyreflect the variation in subjects spare capacity left from the driving task.
It was found that the drivers mean reaction time to the calcu-lation tasks (cognitive load) was higher in the complex traffic environments of village areas and rural junctions than it was at less complex highway sections of the driving routes. This find-ing suggested that the drivers allocated more processing resources to the driving task in complex traffic environments than they did in simple traffic environments.
The variations in the drivers reaction times to the calculation task (the drivers cognitive load) were inversely related to their variations of driving speed. The drivers reduced their speed in the complex traffic environments, but the speed reduc-tions did not prevent an increase in their cognitive load. This pattern of results was found in subsequent studies and for different driving routes. Apparently the drivers responded to variation in task demands both by reducing their driving speed and by increasing the amount of resources allocated to the driv-ing task.
It was concluded that the drivers spontaneous speed adjustments in response to increasing task demands did not prevent an in-crease in their cognitive load. In fact, both the speed reduc-tion and the allocation of more processing resources to the driving task may have been useful means of preventing a deteri-oration in driving performance caused by the increasing task demands in the complex traffic environments.
Actually the field studies provided no proper measure of the subjects task performance. For a number of the driving routes an indirect indication of driving performance was provided by
the number and the location of reported accidents. Within the borderlines of village areas a high cognitive load in a 100-metre interval was associated with a high number of reported
accidents in the same interval whereas no such relationship was
found for lOO-metre intervals of the village areas with high driving speed (see Harms, 1986).
A sound measure of driving performance is the driver s ability to respond to the variety of demands occurring on a driving route within the time limits determined partially by the chosen driving speed, partially by the traffic dynamics. The lack of a proper performance measure andof systematic variations in the demands of the driving task in real traffic prohibited the interpretation of the results in terms of variation in driving performance in response to variation in the task demands. Furthermore, subjects variation of driving speed was probably influenced both by the variation in the legal speed limit, the speeds of the other vehicles and by the variation of task com-plexity on the observed driving routes.
3 EXPERIMENT 1
3.1 Objective
The present study replicated the method and the measurements from the previous field studies. The study was undertaken in a
driving simulator and it aimed at investigating the influence of
systematically varied task demands on subjects task perform-ance, driving speed and cognitive load in the absence of vari-ation in the speed limit and other vehicles. By transferring the research method to the laboratory conditions of a driving simu-lator both the measurements of the subjects' speed, task per-formance and cognitive load could be related to induced varia-tions of the tasks.
3.2 Mbthod
3.2.2 Calculation task
The calculation task used for the measurement of variation in the subjects cognitive load was identical to the the task used in the previous field experiments. The task was to subtract the smaller from the greater digit in spoken two-digit numbers pre-sented to the subjects from a tape over headphones. The presen-tation of each stimulus number followed the termination of the spoken response to the previous one with a time delay of approx-imately .40 seconds. Reaction times to the calculation tasks (stimulus-off/response-on time) were located to the stimulus-off position. Tapes including both the stimulus numbers and the subjects responses were used for manual registration of calcu-lation errors. The error responses were not included in the analysis of subjects reaction times.
3.2.3 Visual tasks
Subjects were presented with 2 different types of visual tasks, a color-task and a name-task. Both tasks were presented in an
easy and a difficult variant. Subjects performance in respond-ing to the two tasks was measured by their reaction time and
error rates in responding to the task.
3.2.3.1 Color-task
Subjects were instructed to move the foot from the gas pedal to the brake pedal whenever a red color-spot was presented. Color spots, approximatedly 0.9° in width and height, were presented one by one at 1 out of 6 possible positions near the edge of the roadline (see Figure 1). The discriminability between the target and the distractor color was varied. The easy color-condition presented subjects with either a red colored target-spot or a
pink colored distractor-spot. The difficult condition presented distractor-spots in a reddish color, more similar to the target color than the pink ones. The color-task used consistent practice (Scheider & Shiffrin 1977); the target color was the same across subsequent trials of the experiment, but the color of distractor spots varied.
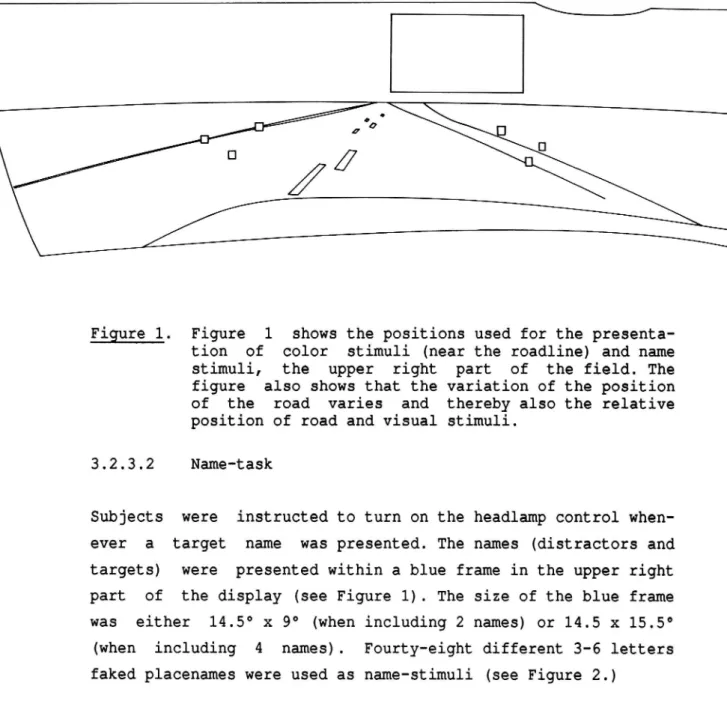
Figure 1. Figure 1 shows the positions used for the presenta-tion of color stimuli (near the roadline) and name stimuli, the upper right part of the field. The figure also shows that the variation of the position of the road varies and thereby also the relative position of road and visual stimuli.
3.2.3.2 Name-task
Subjects were instructed to turn on the headlamp control when-ever a target name was presented. The names (distractors and targets) were presented within a blue frame in the upper right part of the display (see Figure l). The size of the blue frame was either l4.5° X 9° (when including 2 names) or 14.5 x 15.5° (when including 4 names). Fourty-eight different 3-6 letters faked placenames were used as name-stimuli (see Figure 2.)
Arp Backa Boda Borg Back Dal Fager Halla Hattan Hem Holm
Hult Hog Kullan Kyrka Landa Lund Lannet Mark Mossa Mala
Norra Nas Ort Ryd Sand Sjo Skog Slot Slétta Stad Sten Strom Sund satter soder Tomta Torp Trakt Tuna Valla Veda Vista
Végen vaster Alv éster
Figure 2. The 48 faked placenames used for name stimuli. The difficulty of the name-task varied at 2 levels. The easy name-task required subjects to respond whenever 1 target name was presented among 2 simultaneously presented names. The dif-ficult name-task required subjects to respond whenever either of 2 target names were presented among 4 simultaneously presented names. The name-task used varied practice (Schneider & Shiffrin, 1977); the relevant name(s) were exchanged with (a) new relevant name(s) before each trial and the previously relevant names were replaced among the distractor names.
3.2.4 Subjects
Four students participated in the experiment. They were 22-26 years old with a mean age of 24.7 years. All subjects had a drivers licence, moderate driving experience and were inexperi-enced simulator drivers.
3.2.5 Instruction
Subjects were instructed verbally. They were told to be careful
in responding correctly to the presented visual tasks, to drive as they would usually do on a real road and respond to the cal-culation tasks at their own pace. Before performing a total of 4
experimental sessions, subjects were given a standard simulator training program and 4 test sessions for experimental practice.
3.2.6 Apparatus
The VTI driving simulator was used for the experiment (see Nordmark et.al, 1985). A Gould 6780 computer was used for moni-toring the experimental variations and for the on-line registra-tion of experimental observaregistra-tions with a sampling rate of 50 hz. Tape recorders were used for presenting the calculation tasks and for recording the calculation tasks and the subjects verbal
responses .
3.2.7 Procedure
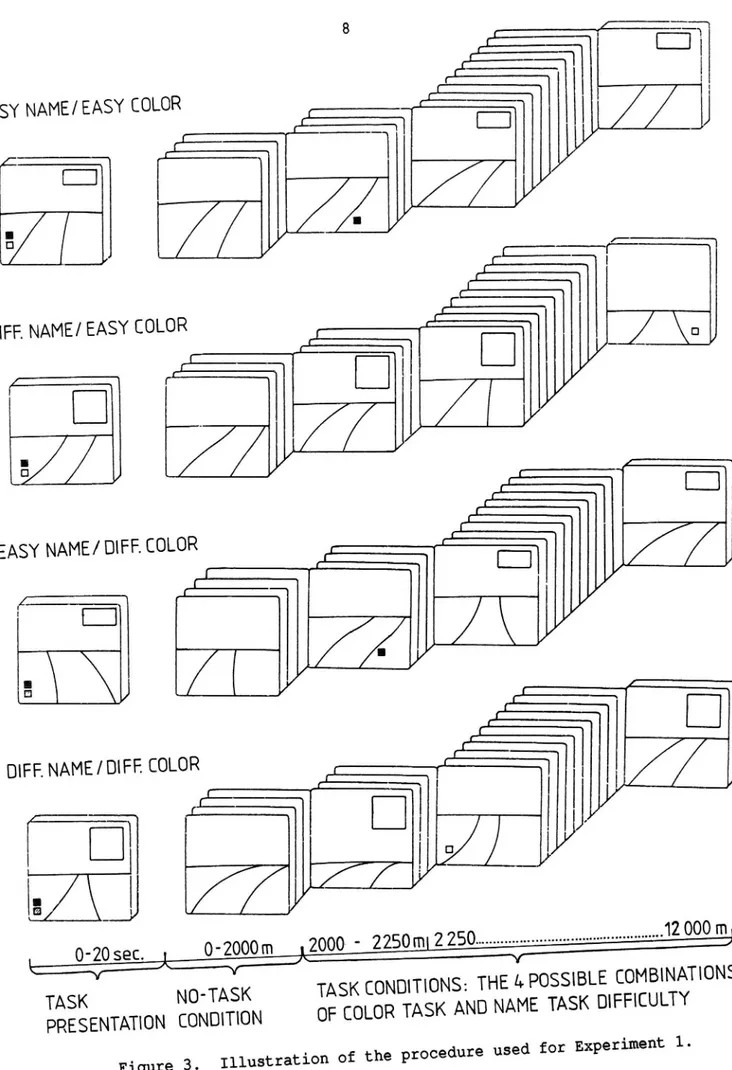
Each new trial was introduced by a stationary 20 seconds task
presentation showing both target and distractor color and the
target name(s) for the next trial. The presentation of the visual tasks was followed by a 2 kilometres section of free driving followed immediately by a 10 kilometres task-section of driving (see Figure 3). Each experimental session included 16 trials presenting each of the 4 task combinations (2 tasks x 2 difficulties) 4 times. Experimental trials included uniform 12-kilometres driving routes with l of the 4 possible combinations
of the name-task (easy/difficult) and the color-task
(easy/difficult).
Within each experimental trial subjects were presented with a random sequence of 40 visual stimuli with an equal distribution of targets and distractors, names and color stimuli. Each 250-metres interval included 1 stimulus presentation. Stimuli were presented in 10 metres (0.40 seconds at 90 km/h, 0.80 seconds at 45 km/h etc.) with a minimum.stimulus separation of 50 metres. The sequences of task combinations were balanced between sub-jects and counterbalanced between subsequent sessions of indi-vidual subjects.
E l :1
EASY NAME/ EASY EOLOR
{"w(LEE
:
7 Fr? W IL 1 T E U/ / r! j rJ: '
[:11
1
//
/L/
V/ Vy
VJ L? ?
V/
f {i r 1 j#5
OTFF. NAME/ EASY EOLOR
I
r "
(fr
$7
/ \
(if 1 {f i D V #:TT 1 rr' 7? j /
T
1
V
[/ //V// 2
T
L
,L
hf
r
:
Her j EEASY NAME/ OlFF. COLOR
ri (E: 7 Fr : [:1 J / i 1 r* j /V E::]} J/J/
\
-\ \ / ( / ' J
L V _ // rrrr OlFF.NAME/O|FF1 COLOR r I: / r (FF L j J// JT
j
D /
JO
2/"
M
/\ /Y/
1
0-20 sec. 1
O-ZOOOm
12000 * 2250 mi 2
000E
#W J *_ #4TASK
NO-TASK
TASK CONOITTONS: THE A POSSIBLE
COMBTNATIONS
OF COLOR TASK AND NAME TASK O
lFFlCULTY
PRESENTATION CONOTTION
Illustration of the procedure used for Experiment 1. Figure 3.
4 RESULTS OF EXPERIMENT 1
4.1 Subjects performance in responding to the visual tasks
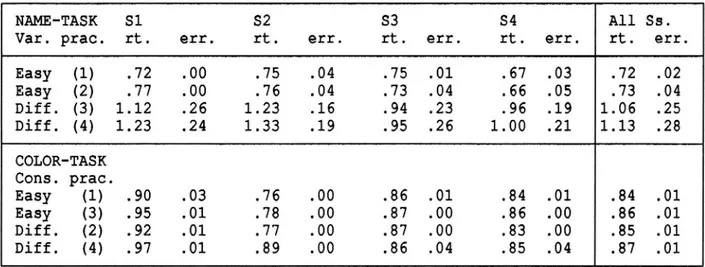
Table 1 shows individual subjects mean reaction time and error rate in responding to the name-task (upper part), which was varied by the number of names (targets and distractors) included in the task and for the variation of discriminability between target and distractor color for the color-task (lower part). Table 1. Mean task reaction time (in seconds) in response to
names (upper pane) and to color spots (lower pane) and error rate for subjects participating in Experi-ment 1. The numbers in parentheses indicate the observed condition: (1)=Easy color/easy name (2)=Difficult color/easy name (3)=Easy color/diffi-cult name. (4)=Difficolor/diffi-cult color/difficolor/diffi-cult name.
NAME-TASK 31 S2 S3 S4 All SS. Var. prac. rt. err. rt. err. rt. err. rt. err. rt. err. Easy (1) .72 .00 .75 .04 .75 .01 .67 .03 .72 .02 Easy (2) .77 .00 .76 .04 .73 .04 .66 .05 .73 .04 Diff. (3) 1.12 .26 1.23 .16 .94 .23 .96 .19 1.06 .25 Diff. (4) 1.23 .24 1.33 .19 .95 .26 1.00 .21 1.13 .28 COLOR-TASK Cons. prac. Easy (1) .90 .03 .76 .00 .86 .01 .84 .01 .84 .01 Easy (3) .95 .01 .78 .00 .87 .00 .86 .00 .86 .01 Diff. (2) .92 .01 .77 .00 .87 .00 .83 .00 .85 .01 Diff. (4) .97 .01 .89 .00 .86 .04 .85 .04 .87 .01
As can be seen, subjects reaction time and error rate in detec-ting target names increased with an increasing number of names (distractors and targets) included in the name-task, whereas the variation of discriminability between the target and the dis-tractor color did not influence subjects performance in respon-ding to the color targets.
Figure 4 shows group results for the 4 subjects participating in Experiment 1. On the average mean reaction time to the name-task increased from .73 seconds to 1.10 with an increased number of
10
names included in the task. The difference was significant by t-test (t(3)= 5.21, p< .01) and the difference in subjects error responses to the task was also significant (x2= 97.7, p<
.001).
1.2
,\1J
-(D "O C O 0 8 ~.u)_ u: 32 'a
I_": 0.9 -O <m
0,4
-(I :z< 0.8
F J 0.3
-J < E [I $02-O [r 0.7 ' E 0.1 h?
1
-E D E D E D E D NAME COLOR NAME COLORFigure 4. Mean reaction time and error rate for the 4 subjects participating in Experiment 1. An E indicates an easy condition, a D the difficult condition of the name-task and the color-name-task, respectively.
On the average, subjects mean reaction time increased from .85
to .86 seconds with reduced discriminability between target and distractor color. The error rate for both conditions of discri-minability was .01.
For both tasks, a minor effect of the difficulty of the other task on subjects mean reaction time may be noted (see Table 1) Reaction time both to the easy and to the difficult color-task increased with increasing task-load of the name-task and the reaction time both to the easy and the difficult name-task in-creased with reduced discriminability of the color-task. The
effect was small but it was found for 13 out of 16 possible
com-parisons (4 subjects x 4 task combinations).
11
4.2 variations insubjects speed
Table 2 shows the subjects' speed and cognitive load, as mea-sured by reaction time to the calculation task, for the 4 task conditions used in Experiment 1. Subjects' speed varied between 120 km/h and 51 km/h. All subjects reduced their driving speed as an effect of the increased number of items (targets and dis-tractors) used for the name task. The speed difference ranged
between 15 km/h and 70 km/h. No systematic change in driving
speed was observed for the variation of discriminability between
target and distractor for the color-task.
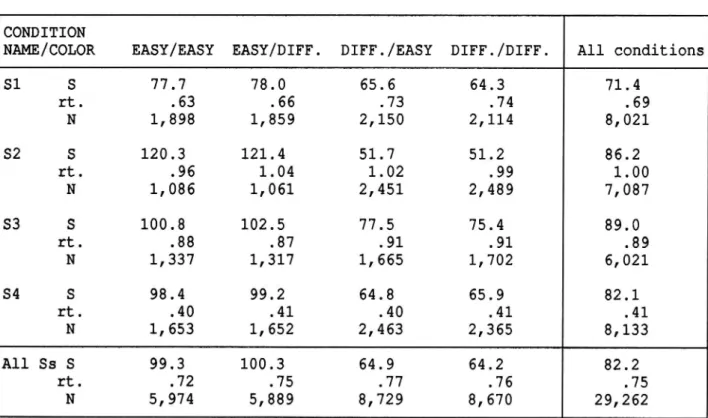
Table 2. Mean driving speed and mean reaction time to the cal-culation task S=Speed km/h rt.=Mean reaction time N=Number of reactions. Mean driving speed was based on 1600 observations per subject in each condition
CONDITION
NAME/COLOR EASY/EASY EASY/DIFF. DIFF./EASY DIFF./DIFF. All conditions S1 S 77.7 78.0 65.6 64.3 71.4 rt. .63 .66 .73 .74 .69 N 1,898 1,859 2,150 2,114 8,021 32 S 120.3 121.4 51.7 51.2 86.2 rt. .96 1.04 1.02 .99 1.00 N 1,086 1,061 2,451 2,489 7,087 S3 S 100.8 102.5 77.5 75.4 89.0 rt. .88 .87 .91 .91 .89 N 1,337 1,317 1,665 1,702 6,021 S4 S 98.4 99.2 64.8 65.9 82.1 rt. .40 .41 .40 .41 .41 N 1,653 1,652 2,463 2,365 8,133 All Ss S 99.3 100.3 64.9 64.2 82.2 rt. .72 .75 .77 .76 .75 N 5,974 5,889 8,729 8,670 29,262 On the average, subjects driving speed decreased from 99.8 km/h for the easy name-task to 64.6 km/h for the difficult name-task. A minor speed increase was observed for variations of discrimin-ability between target and distractor color. On the average the mean speed increased from 82.1 km/h for the easy color-task to
82.3 km/h for the difficult color-task.
12
I I I I I " I , 0 l tC | o .3 ,. I u:
5
|
g
E | P x " I 0.9 2E
.
g
H
l
2-2
s
.
3:.
o " I "' 0.8 z 22 | Ii>-5:
I
2
3 l E 70 "' I 0.7 us I E | Iso I
I
#16
%
1
E D E D E D E D NAME COLOR NAME COLORFigure 5. Mean driving speed and mean reaction time to the cal-culation task (cognitive load) for the 4 subjects participating in Experiment 1. An E indicates the easy condition and a D the difficult condition of the name-task and the color-task, respectively.
Variations in speed were subjected to a two-way repeated measure ANOVA with 4 subjects, 2 conditions of the color-task and 2 con-ditions of the task. The effect of task-load of the name-task was significant (F(1,15)= 25.21, p< .001) whereas no effect was found for discriminability (F(1,15)= 0.00).
4.3 variation in subjects cognitive load
As can be seen in Table 2 the subjects cognitive load, as measured by reaction time to the calculation task, varied bet-ween subjects and conditions. Out of 8 possible comparisons of variation in the subjects cognitive load, as an effect of
13
increased number of items for the name-task (4 subjects x 2 con-ditions), five showed an increase, two were neutral and 1 com-parison went in the opposite direction. For reduced discrimin-ability between target and distractor color 5 comparisons showed an increase in cognitive load, one was neutral and 2 comparisons went in the opposite direction.
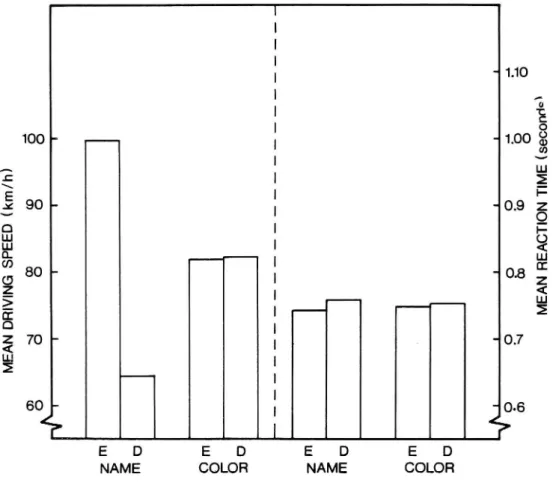
On the average drivers' reaction time to the calculation task (cognitive load) increased from .74 seconds to .77 seconds with increasing task-load of the name-task and from .75 seconds to .76 seconds with reduced discriminability between the target and the distractor color (see Figure 5). Reaction time to the cal-culation task showed marginally significant effects of task dif-ficulty of the name-task (F(1,15)= 4.81, p< .055) but no signi-ficant effects of discriminability (F(1,15)=O.7l, p< .421).
5 DISCUSSION OF EXPERIMENT 1
5.1 The influence of the task variations on subjects
general performance
The pattern of results observed for the name-task in Experiment 1 suggested that the number of items (targets and distractors) used for the name-task influenced the subjects performance in a general way. Increasing the number of items caused subjects to reduce their speed, and both their reaction time in detecting the target names and the number of error responses increased. Apparently the time gain obtained both by the speed reduction and by the prolongation of the reaction time did not prevent a considerable increase in the subjects errors in responding to the name-task.
According to the pattern of results from the previous field studies an increase in the subjects cognitive load in parallel with the speed reduction should be expected and a small increase in the subjects cognitive load was actually observed to follow the speed reduction for the difficult name condition of Experi-ment 1. However, the minor variation in subjects' cognitive load
14
as an effect of the difficulty of the name-task suggested that the calculation taskwas less sensitive to task difficulty than was the subjects speed and their performance in responding to the name-task.
The variation of the color-task showed quite a different pattern of results. Subjects performance was essentially uninfluenced
by the variation in discriminability between the target and the distractor color. This finding indicated that the variation of
discriminability between target and distractor color may not have been sufficient to produce any effects. Both distractor colors were probably sufficiently different from the target color to prevent a confusion between targets and distractors. The use of consistent practice for the color-task of Experiment 1 probably supported the subjects efficiency in detecting the targets.
5.2 The importance of stimulus codes and practice
condi-tions
According to Schneider and Shiffrin (Schneider & Shiffrin, 1977) the use of consistent practice for any task should result in automization of performance. With automatic detection of a target, distractors should not influence subjects performance systematically. However, the use of varied practice for a task requires controlled processing and subjects performance becomes highly sensitive to task-load. The different pattern of results found for the name-task and the color-task of Experiment 1 may suggest that varied practice resulted in controlled search for target names and consistent practice of the color-task in auto-matic detection of color targets.
Assuming that subjects processing strategy solely depends on the type of practice, the use of varied practice should result in controlled processing, stressing the subjects limited-capa-city processing system, both for color stimuli and for name stimuli. Likewise consistent practice should be expected to result in automatic detection both for color-stimuli and for name-stimuli.
15
6 EXPERIMENT 2
Experiment 2 investigated the relative importance of stimulus
codes and practice conditions to the variation in subjects
per-formance. It was assumed that the use of varied practice for the color-task would result in controlled search for target color(s) whereas the use of consistent practice for the name-task would replace controlled search with automatic detection of a target name. With consistent practice the influence of the number of presented names on subjects performance should be reduced or even removed whereas the use of varied practice for the color-task should result in a pattern of results similar to that of the name-task in Experiment 1.
6.1 Mbthod
Experiment 2 used the same stimulus codes and practice condi-tions as Experiment 1. However, the simple variation in discrim-inability used for the color-task of Experiment 1 was replaced by variation of the number of color spots (targets and distrac-tors) in Experiment 2. Furthermore, varied practice was used for the color-task. The targets and the distractors were intermixed across trials.
Besides the use of consistent practice for the name-task of Experiment 2 the task was similar to the name-task of Experiment 1. One and the same name was used as target in all conditions and just the number of simultaneously presented distractor names varied.
Except for the above mentioned changes of the visual tasks the method was essentially the same as the method used in Experiment 1.
16
6.1.1 Color-task
The easy color-task required subjects to move the foot from the gas pedal to the brake pedal whenever 1 target spot was present-ed among 2 simultaneously presented color-spots. The difficult color-task required subjects to respond whenever 1 out of 2 target spots were presented among 4 simultaneously presented spots. The positions of the presented color-spots were chosen randomly among the same 6 spot-positions as the ones used in Experiment 1 (see Figure 1). Twelve different colors were used for targets and distractors. Varied practice was used for the color task; the target color(s) were exchanged for each new trial and the previously relevant target color(s) were replaced in the group of distractor colors.
6.1.2 Name-task
Subjects were required to turn on the headlamp control whenever the target name was presented. The target name was the same for all subjects and one and the same name was consistently used as target in all trials (consistent practice). The easy condition presented 2 names simultaneously and the difficult condition presented 4 names simultaneously. Experiment 2 used the same placenames and nameframes as Experiment 1. The distractor names were randomly chosen among the 47 remaining names (see Figure 2). 6.1.3 Subjects
Four students participated in the experiment. They were 20-26 years old with a mean age of 24.2 years. All subjects had a driver s licence, moderate driving experience and were inex-perienced simulator drivers.
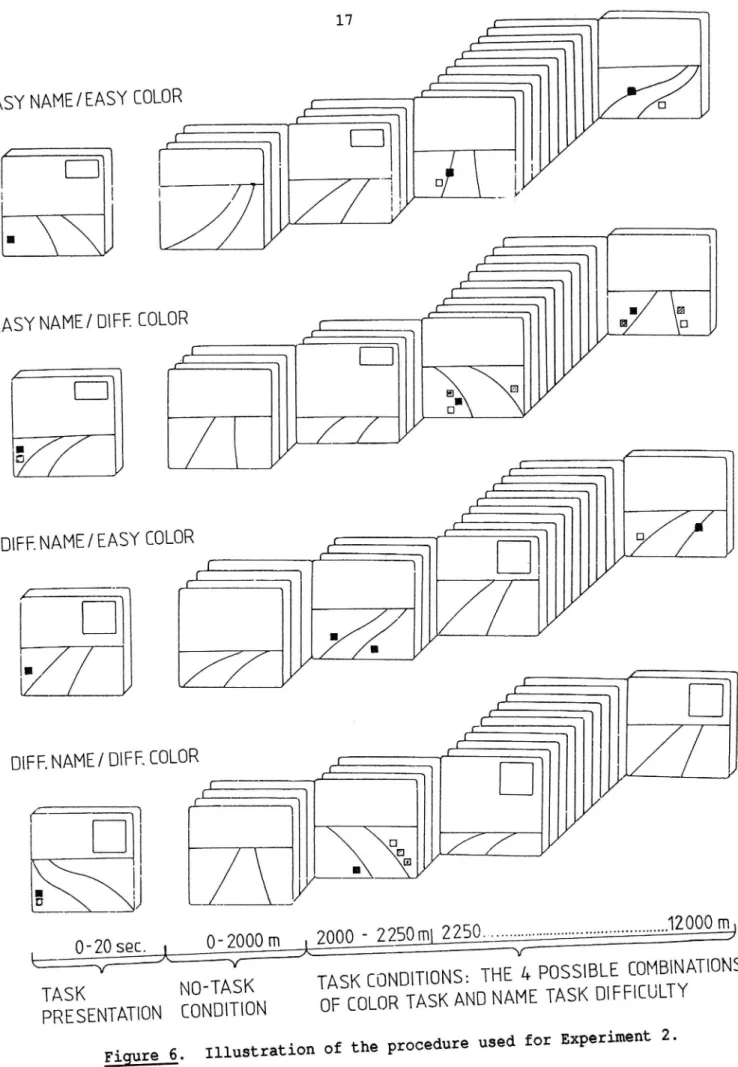
6.1.4 Procedure
The procedure was the same as the one used in Experiment 1 (see 3.3 for a description). Figure 8 illustrates the procedure for one session of Experiment 2.
1'7
Fr
r7 ' f 7F
H
A
L
r 1]EASY NAME/EASY COLOR
( 5
I
f
L r
7
a
[1 {'{L 7 C] L M
C :1
C
1
L
W
i
I
/
1V
L' \\L
V
rr
1r
A
j(i
r:
4L
l
r
EASY NAME/ OLFF. COLOR Fi
/ f 1 I { w ff 0 a \D L
z:T*
rff
1
[:31
VV
W
V
a 2 LV DI L/L/ 5:: : //// K ///, /// v/ r_rL Li 4/ IL, r:rr C
i]
r :
r?
BLEENAME/EASY COLOR Err
7R / rrC Lr_::f W? D //}r/ FCC We . V 1/ r1 C "1 J//
/
/ M
/
' / J/
/
I / AM /
y
v/
rrfji AI
::;R rrf A ZZRFr
?
DIFF.NAME/ DIFF COLOR
Lrf
Li
_ :r
*7//
L
rrE
1
?
J},
1 LEE '1 y/1
1 DE} ///y
I l C V//LB
5)
L
//
0-20 sec.
0-2000 m
2000 - 2250 m}
W...12000 In
TASK NO TASK TASK CONDITIONS: THE A PO
SSIBLE COMBLNATIONS OF COLOR TASK AND NAME TASK OlFFlCULTY
PRESENTATLON CONOlTlON
Figure 6. Illustration of the procedure used for Experiment 2.
18
7 RESULTS OF EXPERIMENT 2
7.1 Subjects performance in responding to the visual tasks
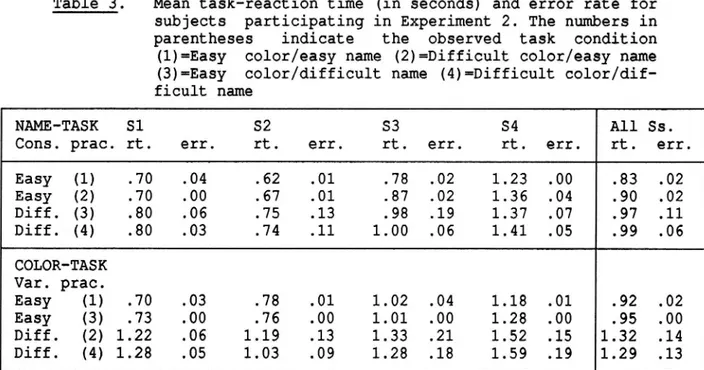
Table 3 shows the mean reaction time and error rate for the variation of the number of items (targets and distractors) for the color-task (lower part) and for the variation of the number of simultaneously presented distractors for the name-task (upper part) of Experiment 2.
Table 3. Mean task-reaction time (in seconds) and error rate for subjects participating in Experiment 2. The numbers in parentheses indicate the observed task condition (1)=Easy color/easy name (2)=Difficult color/easy name (3)=Easy color/difficult name (4)=Difficult color/dif-ficult name
NAME-TASK 81 32 S3 S4 All 58. Cons. prac. rt. err. rt. err. rt. err. rt. err. rt. err. Easy (1) .70 .04 .62 .01 .78 .02 1.23 .00 .83 .02 Easy (2) .70 .00 .67 .01 .87 .02 1.36 .04 .90 .02 Diff. (3) .80 .06 .75 .13 .98 .19 1.37 .07 .97 .11 Diff. (4) .80 .03 .74 .11 1.00 .06 1.41 .05 .99 .06 COLOR-TASK Var. prac. Easy (1) .70 .03 .78 .01 1.02 .04 1.18 .01 .92 .02 Easy (3) .73 .00 .76 .00 1.01 .00 1.28 .00 .95 .00 Diff. (2) 1.22 .06 1.19 .13 1.33 .21 1.52 .15 1.32 .14 Diff. (4) 1.28 .05 1.03 .09 1.28 .18 1.59 .19 1.29 .13
As can be seen, all the subjects increased their reaction time in response to increased difficulty for both of the tasks pre-sented in Experiment 2 and subjects error rates increased. Figure 7 shows group results for the 4 subjects participating in
On the
name-task increased from .87 seconds to
Experiment 2. average, subjects reaction time to the .98 seconds as an effect of the number of simultaneously presented names. The difference in mean reaction time was significant (T(3)= 5.89, p< .01) The error rate increased from .02 for the easy name-task to .09 for the difficult name task. The increase in the number of errors as an effect of increasing difficulty was also significant (xz=
31.45, p< .001).
19
On the average, the reaction time to the color-task increased from .94 seconds for the easy taskto 1.31 seconds for the difficult color-task. The difference in reaction time between the task conditions was significant (t(3)= 6.90, p< .01). The error rate increased from .01 for the easy color-task to .13 for the difficult color-task. The increase in the number of errors with increasing difficulty of the color-task was significant
(x2=73.09, p< .001). 1.4 1.3» 73g 1.2 -O O (D .2 Lu 2 1.0-I Z 92
*5
< 0.9E
z0.4-E
2 08. *LU 03.E
[I 028
o.7~ 83 0.1E D E D E D E D NAME COLOR NAME COLOR
Figure 7. Mean reaction time and error rate for the 4 subjects participating in Experiment 2. An E indicates an easy
condition, a D the difficult condition of the
name-task and the color-name-task, respectively.
Subjects reaction times to each of the tasks were apparently
uninfluenced by the difficulty of the other task. Nine out of 16 possible comparisons of subjects mean reaction time (4 jects x 4 task combinations) showed a small increase in the sub-jects' reaction time both for the color-task and for the name-task as an effect of increased difficulty of the other name-task and and 7 comparisons went in the opposite direction (see Table 4).
20
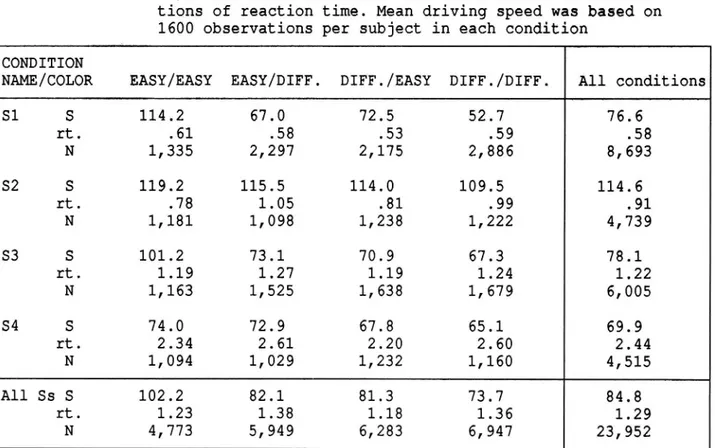
7.2 variation in subjects speed
Table 4 shows individual subjects speed and cognitive load, as measured by reaction time to the calculation task for each of the 4 task combinations of Experiment 2. Subjects speed varied between 119 km/h and 53 km/h. The speed reduction varied between
10 km/h and 70 km/h. All the subjects reduced their speed with
the increasing number of simultaneously presented distractors used for the name-task and a similar speed reduction was observ-ed for variations of the color-task.
On the average, subjects reduced their speed from 92.2 km/h to 77.5 km/h with increased difficulty of the name-task and from 91.8 km/h to 77.9 km/h with increased difficulty of the
color-task (see Figure 8).
Table 4. Mean driving speed and mean reaction to the calculation task for individual subjects in Experiment 2. S=Speed
km/h rt.=mean reaction time and N=number of
observa-tions of reaction time. Mean driving speed was based on 1600 observations per subject in each condition
CONDITION
NAME/COLOR EASY/EASY EASY/DIFF. DIFF./EASY DIFF./DIFF. All conditions 81 S 114.2 67.0 72.5 52.7 76.6 rt. .61 .58 .53 .59 .58 N 1,335 2,297 2,175 2,886 8,693 82 S 119.2 115.5 114.0 109.5 114.6 rt. .78 1.05 .81 .99 .91 N 1,181 1,098 1,238 1,222 4,739 S3 S 101.2 73.1 70.9 67.3 78.1 rt. 1.19 1.27 1.19 1.24 1.22 N 1,163 1,525 1,638 1,679 6,005 S4 S 74.0 72.9 67.8 65.1 69.9 rt. 2.34 2.61 2.20 2.60 2.44 N 1,094 1,029 1,232 1,160 4,515 All 85 S 102.2 82.1 81.3 73.7 84.8 rt. 1.23 1.38 1.18 1.36 1.29 N 4,773 5,949 6,283 6,947 23,952 Driving speed was subjected to a two-way repeated measure ANOVA with 4 subjects, 2 conditions of the name-task and 2 conditions
21
of the color-task. Both the effect of variations of the diffi-culty of the name-task (F(1,15)= 6.51, p< .03) and the effect of variations of the color-task (F(1,15)= 6.35, p< .03) were
ficant. l
:
4.40
l l I I -'L3O I l | I 1.20 | I 'uBl
8
I " 8 I 3 I LUI
5".
__ I "' zI
8
a
E'
l9
u: x ' I 0.9 mE
I
<2:
31
I
é'
a, l (D 80 - I -(18 Z I 2: m l C | E " I " 0.7 L I E I I 60 " I " 0.6$
!
$
E D E D E D E D NAME COLOR NAME COLORFigure 8. Figure 5. Mean driving speed and mean reaction time to the calculation task (cognitive load) for the 4 subjects participating in Experiment 2. An E indi-cates the easy condition and a D the difficult con-dition. The Easy of the color-task and the name-task, respectively.
22
7.3 variation in subjects cognitive load
Cognitive load and the variation in subjects cognitive load varied (see Table 4). Out of 8 possible comparisons of the effect of an increased number of simultaneously presented dis-tractors for the name-task of Experiment 2 (4 subjects x 2 con-ditions) two showed an increase in subjects cognitive load and 6 showed a decrease. For an increasing number of items (targets and distractors) for the color-task 7 comparisons showed an increase in subjects' cognitive load and 1 comparison went in the opposite direction.
On the average drivers reaction time to the calculation task decreased from 1.31 seconds to 1.27 seconds with increasing number of simultaneously presented name distractors whereas subjects reaction time increased from 1.21 seconds to 1.37 seconds as a function of the number of simultaneously presented items (targets and distractors) for the color-task. Reaction time to the calculation task showed a significant effect of variations of the color-task (F(1,15)= 12.31, p< .007) but no effect of the name-task (F(1,15)= 0.64, p< .44).
8 DISCUSSION OF EXPERIMENT 2
8.1 The influence of the task variations on subjects general performance
The effects of increasing the number of items (targets and distractors) for the color-task and increasing the number of presented distractor names for the name-task were quite similar. Subjects reduced their speed, their reaction times increased and, moreover, the number of error responses increased.
Similar to the finding of Experiment 1 the time gain obtained by reducing the speed and increasing the reaction time in respond-ing to the tasks did not prevent a considerable increase in subjects error rate caused by increased task difficulty. Both
23
the increased number of items (targets and distractors) for the varied practised color-task, and the increased number of simul-taneously presented distractors for the consistent practised name-task, caused a deterioration in subjects performance in responding to the tasks.
The subjects cognitive load, as measured by their reaction time to the calculation task, increased as an effect of increased difficulty of the varied practised color-task, whereas no such effects were observed for the consistent practised name-task of
Experiment 2. Beside this difference, task difficulty influenced
subjects general performance similarly either consistent or varied practice was used for the task. Increased task difficulty caused subjects to reduce speed and their reaction times in responding to the visual task increased. Moreover, subjects errors in responding to the tasks increased considerably as an effect of task difficulty. Apparently, just like in Experiment 1 subjects speed and performance in responding to the tasks were more sensitive to task difficulty than was their performance in responding to the calculation task.
9 GENERAL DISCUSSION
9.1 The effects of stimulus categories and practice con-ditions
Except for the simple variation in discriminability between target and distractor color used in Experiment 1, leaving sub-jects performance essentially uninfluenced by the variation, both experiments provided a similar pattern of results. It was found that the number of simultaneously presented items caused subjects to reduce their speed. However, neither the speed reduction nor the increase in subjects reaction time to the visual tasks prevented the increased error rates reflecting a deterioration in subjects performance. This effect was found for both practice conditions (varied or controlled) and for both stimulus categories (name or color). The finding suggested that
24
the number of simultaneoulsy presented items was crucial to the variations in subjects performance.
The Subjects cognitive load varied less but the small differ-ence between the tasks may be noted, solely the tasks using varied practice tended to increase the subjects cognitive load. It may be speculated that the net effect of subjects' speed reduction may have been a minor degradation of task performance than would have occurred if the subjects had not reduced their speed. Similarly a further speed reduction might have improved the subjects performance in responding to the tasks. This study was concerned with spontaneous variations in subjects perform-ance as an effect of systematic variations of the difficulty of the visual tasks and neither of these suggestions was tested. 9.2 Subjects performance in real traffic and driving
simulation
The inverse relationship between the variations of driving speed and the drivers cognitive load suggested that the drivers' responded to the increasing complexity of the driving environ-ment by reducing their speed and allocating more processing resources to the driving task in real traffic. It was suggested that both these responses may have been efficient in preventing a deterioration of driving performance as an effect of the variation in task demands associated with complex traffic environments.
This finding was just partly replicated in the present simulator study. A small increase in the subjects cognitive load in parallel with speed reduction was actually observed as an effect of increased task difficulty, but it was observed solely for tasks using varied practice (the name-task of Experiment 1 and the color-task of Experiment 2).
A main point in conducting the simulator study was the measure-ments of subjects performance in responding to variations of visual tasks in addition to the measurements of subjects speed
25
and cognitive load. The variation in difficulty of the visual tasks was found to influence the subjects performance general-ly. The subjects reduced their speed and increased their reac-tion time in response to increased difficulty of the presented visual tasks. However, the time gain resulting from these adjustments, did not prevent a considerable increase in sub-jects errors, in responding to the difficult tasks. The varia-tions in subjects' cognitive load in the simulator experiments were rather small. Apparently both driving speed and subjects task performance were more sensitive to the variations of the task demands than was the subjects performance in calculating.
9.3 Task priority in real traffic and driving simulation While the relative priority of the driving task in preference to the calculation task in real traffic is evident, the priority of visual tasks in preference to the calculation task in driving simulation is dubious. The performance of the subjects, serving in the simulator study, suggested that the subjects may not have given the high priority to the visual tasks that they had been instructed to do. The infrequent and irregular presentation of the visual tasks in the simulator study may have resulted in a lower priority of the visual tasks than of the calculation task that was presented continuously.
The variation in the difficulty of the visual tasks resulted in a speed reduction but rather than maintaining a constant high level of performance in responding to the visual tasks the subjects seem to have striven to maintain their performance in calculating. Consequently, subjects performance in responding to the visual task deteriorated as an effect of increased diffi-culty whereas the subjects succeeded pretty well in maintaining their performance in calculating. The subjects' cognitive load was less influenced by task difficulty than was the subjects task performance but it was not unaffected. The tasks using varied practice tended to cause an increase in subjects
26
nitive load in parallel with the speed reduction and a degrada-tion of task performance.
9.4 The relationship between task demands, speed and pro-cessing resources
The finding that subjects task performance varied as an effect of task difficulty in the present simulator study supported the general assumption that increasing the task demand increases the stress on subjects limited-capacity processing system. In the field studies the increased stress resulted in an increase in the drivers reaction times in responding to the calculation tasks but the influence of complexity on driving performance could not be estimated in real traffic.
In the present study the increased stress was apparently taken out on the performance in responding to the visual tasks.
The importance of speed adjustments in accounting for the increased task demands was dubious both in the previous field studies and in the present simulator study. In real traffic, an inverse relationship between speed and cognitive load showed that speed reduction did not prevent complex traffic environ-ments from inducing a heavier load on the drivers processing system. than did the simple traffic environments. The present simulator study showed that subjects speed adjustments in response to increased task difficulty did not prevent a degrada-tion of the subjects task performance in responding to the increased task demands, moreover subjects cognitive load tended to increase for the tasks using varied practice.
Both the previous field studies and the present simulator study demonstrated that variations in task demands influenced the sub-jects speed choice. However, the observed speed reduction in response to increasing complexity of the traffic environments in the field studies did not prevent a considerable increase in the drivers cognitive load. This finding suggested that the sub-jects responded to increasing task demands both by speed reduc-tions and by allocating more processing resources to the driving
27
task. The pattern of results obtained in the present simulator study differed from that of the previous field studies. Increas-ing the task demands in driving simulation caused subjects to reduce their speed but the speed reduction did not prevent a considerable degradation in their performance in responding to the visual tasks, moreover for tasks using varied practice the subjects cognitive load tended to increase.
10 CONCLUDING REMARK
In general, both the field studies and the present simulator Studies suggested that the subjects spontaneous speed adjust-ments did not ensure a stable or constant level of performance. The finding from the field studies that the drivers cognitive load increased as an effect of increasing complexity of the driving environments suggested that the subjects responded to the environmental demands both by reducing their speed and by allocating more processing resources to the driving task. The results of the simulator experiments suggested that increasing the task difficulty caused subjects to reduce their speed and in parallel degraded their performance in responding to the task. The finding that the task demands influenced subjects task per-formance and just a small increases in the subjects cognitive load was observed, and suggested that the subjects' allocation policy in driving simulation differed from that of real traffic. However, both the results of the previous field studies and of the present simulator study emphazised the importance of sub-jects processing resorces in responding to variations in task demands. Both the field studies and the present simulator study demonstrated that the spontaneous speed reductions did not prevent the increase in task demands from stressing the sub-jects processing system. However, the studies leave two ques-tions open for further research,
Would a further speed adjustment have influenced the subjects
performance in responding to the visual tasks ?
28
Would subjects performance in responding to the visual tasks in driving simulation have been improved if their resource alloca-tion had not been biased towards the calculaalloca-tion task ?
The first question requiresmanipulations of speed that were not
included in the present study and could not be carried out in
real traffic. The latter question concerns the trade-off between different tasks due to subjects' allocation policy and requires an extended control of the subjects task priority in driving simulation.
29
ACKNOWLEDGEMENT
This study received financial support from the Swedish Transport Research Board (TFB). It was performed in cooparation with the Simulator-group at the Swedish Road and Traffic Research Insti-tute (VTI). Special thanks to Hékan Jansson and Hans Erik Petterson for valuable advice and discussions.
30
REFERENCES
Harms, L.: Drivers Attentional Response to Environmental Vari-ations: A Dual-task Real-traffic study. In Gale. et.al. (eds.) Vision in Vehicles I, 1986.
Harms, L.: Variation in Drivers Cognitive Load and Driving Speed in Response to Environmental Complexity. (Submitted for publi-cation 1988).
Nordmark, S., H. Jansson, M Lidstrom & G. Palmkvist: A Moving Base Driving Simulator with Wide Angle Visual System. (VTIsar-tryck, 1986) TRB, 64th Annual Meeting, 1985.
Schneider, W. & R.M. Shiffrin: Controlled and Automatic Human Information Processing: I. Detection, Search and Attention. Psychological Review nr. 1, 1977.