Life cycle assessment of a road investment – estimating the
effect on energy use when building a bypass road
Annelie Carlson – VTI Anna Mellin - VTI
CTS Working Paper 2013:23
Abstract
In the debate of climate change and mitigation of greenhouse gases, the issue of energy use is closely related. Several political aims concern the need to reduce the overall energy demand in the society, where transportation is an important contributor. In the transport sector, major efforts have been concentrated on developing more fuel efficient engines and vehicles. However, the road infrastructure, its operation and maintenance also use energy and do have an effect on traffic fuel consumption and emissions. It is therefore important to also take the infrastructure into consideration when addressing the energy issue for traffic and use a broader perspective. The objective of this study is to estimate the total energy use in a life cycle perspective of a road infrastructure investment and the impact of different phases of the roads life time. How the results are related to the transport objectives is also addressed. A life cycle assessment method is used to evaluate an infrastructure investment, including
construction, operation, maintenance and traffic during 60 years. A small community is used as a case study where a bypass has been built and the result show that this investment will increase the total energy use by approximately 60%, or 1 550 TJ compared to not building it. A major part of the increase is due to traffic, and since mostly fossil fuel is used there will also be an increase in greenhouse gas emissions. The result stipulates that the aspects of energy efficiency and reduction of greenhouse gases has not been accounted for in the planning or it has been considered as less important than other aspects, e.g. traffic safety and accessibility.
Keywords: Life cycle assessment, energy use, road infrastructure and traffic.
Centre for Transport Studies SE-100 44 Stockholm
Sweden
INTRODUCTION
Energy use and emissions of greenhouse gases (GHG) within the transport sector is continuously growing. In Europe (EU-27) while sectors like households and industries have decreased the final energy use in 2007 compared to 1990, transports have increased energy use by approximately 32 % (European Commission 2010). Since road transport is the dominant energy user and fossil fuel is the major source of energy, a similar development is reflected in the GHG emission which has increased by 35 % during the same time period (European Commission 2010). In the case of Sweden, the GHG emissions from the transport sector have increased by 9 % since 1990 due to the increase of light and heavy truck flows (Swedish Transport Administration 2012a). Besides the issue with global warming there is also an anticipated shortage of fossil fuel in the future that will have an effect on the overall possibilities to produce not only fuel but also heat and electricity. Therefore, to get a more sustainable transport sector and reach the energy and environmental goals it is imperative to improve the energy efficiency.
Major attention has been directed toward vehicles and more fuel efficient engines. In the EU there is e.g. a regulation stating that each manufacture’s fleet average emissions of carbon dioxide for passenger cars should be 130 g/km by 2012 with a long term target of 95 g/km in the year 2020 (European Commission 2009). There are also efforts and research made in reducing car travels in favour of more energy efficient transport modes such as bicycles and public transport. During recent years attention has also been directed to the road infrastructure and the effect it has on energy use. Two EU projects that have studied this are IERD (2006) and ECRPD (2010). IERD (the Integration of Energy into Road Design) assessed the energy use in the constructions of roads regarding different alignments and the effect on energy use of both construction and traffic. In IERD it was concluded that the energy used by the vehicles on the roads over a 20 year period is, on average, 18 times greater than the energy used in the road construction. It could therefore be worthwhile to make changes to a route at the design and construction stage even if it increases the energy used during construction, such as reducing a steep gradient, if it will result in a reduction in the energy used by vehicles over the road lifetime. ECRPD (Energy Conservation in Road Pavement Design, Maintenance and Utilisation) focused on evaluating energy conservation in pavement manufacture and placement. A result of ECRPD was that energy savings of up to 47% could be achieved in road construction and up to 20% in the operation of the road over a 20 year period by choosing the most energy efficient material and methods and to design the roads with the objective to have low traffic energy use.
A more recent project is MIRIAM (Models for rolling resistance In Road Infrastructure Asset Management Systems) where one of the objectives is to study the importance of rolling resistance on total energy use of a road and if maintenance treatments can be viable option to reduce total energy (MIRIAM 2012). Results have shown that traffic fuel use on the Swedish road network can decrease by 1.1 %, equivalent to approximately 3 700 TJ, if the macro texture is decreased by 0.5 mm (Hammarström et al 2012).
Also, a number of life cycle assessments of roads and pavements have been made which, for instance, have shown that energy due to construction, maintenance and operation can be considerable (Carlson 2011). Traffic, however, is the dominating contributor to energy use in a road’s life cycle (Häkkinen and Mäkele 1998; Stripple 2001). Though, this is not an argument to focus all attention on measures for traffic, which has been shown by IERD (2006) and ECRPD (2010). Therefore, it is also important to take the road infrastructure into
consideration, especially during planning procedures. The overall goal of the Swedish transport policy is to ensure socio-economic efficient and sustainable transport services for people and businesses throughout the country, and with objectives concerning, e.g., accessibility, health, safety and the environment (The Swedish Government 2012). To include the expected energy use of infrastructure investments in a life cycle perspective is a development the Swedish Transport Administration (STA) is promoting mainly due to their target to reduce the transport sector’s impact on the climate, i.e. they have one objective of reducing energy use in the transport sector with 20 % until the year 2020 compared to 1990, and the GHG emissions with 40 % (Prop. 2008/09:93).
Aim and scope
The aim of this study is to estimate the total primary energy use in a life cycle perspective of a road infrastructure investment and the importance of different phases of the roads life time in an energy use perspective. The life cycle assessment method is applied for a case study where we compare the energy use when building a bypass road, to a scenario when it is not built. Further, the question on how the results relates to the Swedish national transport objective of improved energy efficiency is addressed.
METHOD AND LIMITATIONS
A case study including two specific road sections are used as an example to perform the evaluation of the energy need in a road’s life cycle. The material and primary energy used is estimated in a life cycle perspective including construction, operation, maintenance and traffic during a time period of 60 years. The analysis period is based on the upper boundary of a recommended economic life length of 40 to 60 years for new roads in Sweden (SIKA 2008). There are several environmental aspects which are of interest when studying infrastructure in a life cycle perspective, such as emissions to the ground, the atmosphere and the water, as well as noise and effects on land use and biodiversity. However, in this study we have chosen to focus on energy due to the energy efficiency aspect. Also, conversion of energy is a major contributor to various environmental aspects and studies of environmental impact have shown that energy use is one of the most important sources to the environmental load of a road (Mroueh et al 2001).
Two separate scenarios are studied; one describing a situation when the bypass is not built (Scenario A) and one describing a situation when the bypass is built (Scenario B). These two scenarios are compared to show the impact the infrastructure investment have on the total energy demand in the road’s life cycle. The life cycle assessment of the scenarios has been conducted following the ISO standard 14040 and 14044 concerning life cycle analysis (ISO 2006a, 2006b).
The calculations of the energy use in a life cycle perspective are mainly based on the previous work of Stripple (2001), Karlsson and Carlson (2010) and Andersson and Gunnarsson (2009). The estimations have further been divided into three main stages; the construction phase, the phase of operation and maintenance and traffic. The end-of-life stage is not included since it can be considered that a road usually does not have an end-of-life. In this case one can with almost certainty state that the road will be in use longer than the applied analysis period. However, some materials used, such as asphalt, may have an end-of-life. This is mainly dependent on the choice of rehabilitation strategies for the pavement, for instance, removing the old top layer and transport it to a landfill or recycle some of the material into the new
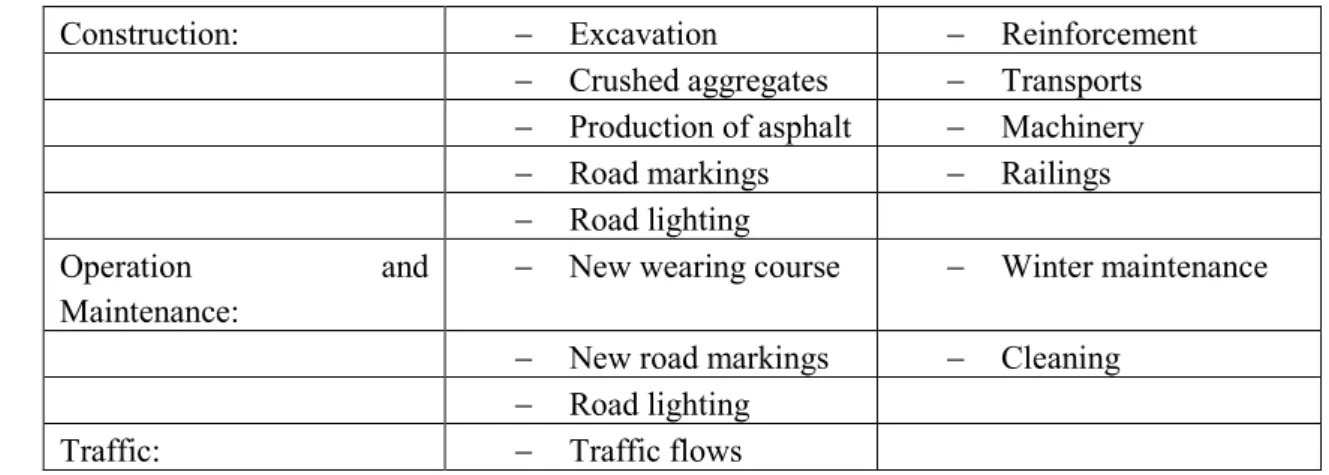
paving. In this study we have assumed that a new wearing course is laid on top of the old, and that no material is recycled or deposited. The factors included in the study are presented in Table 1.
Table 1 Factors included in the LCA.
Construction: − Excavation − Reinforcement
− Crushed aggregates − Transports − Production of asphalt − Machinery − Road markings − Railings − Road lighting
Operation and
Maintenance:
− New wearing course − Winter maintenance − New road markings − Cleaning
− Road lighting
Traffic: − Traffic flows
A detailed description of the thoroughfare and the bypass has been applied in the analysis and also the quantity of material needed for construction and maintenance has been collected for the specific roads. The information used in the study comprise width, crossfall, horizontal and vertical alignment of the road, roughness and macro texture of the pavement, thickness of pavement of the existing road (1412), thickness of all layers of the new road (111), material for road markings, railings, reinforcement and lighting, transport distances of material used for the road construction, i.e. crushed aggregates and asphalt, annual average daily traffic (AADT), vehicle fleet composition and speed. This information is derived from blue prints for the bypass that was received from the project manager for the infrastructure investment and blue-prints for the thoroughfare that are available in the archive at the STA office in Malmö. Also two databases that are administrated by STA have been used to get information specific for the thoroughfare, i.e. Väggrafen and TIKK (Swedish Transport Administration 2012b). Further information was collected from the work plan for road 111, which is a document describing technical solutions, road geometry, geotechnical conditions, land use, traffic situation, environmental impact assessment (EIA) etc., and it is needed in the planning and decision process (Vägverket, 2003). The blue-prints gave detailed information regarding road profile, horizontal alignment, vertical alignment, super elevation, the cross section of the roads, road lighting and road markings. Väggrafen consists of information about several characteristics of the national roads like age and thickness of pavement, road roughness (IRI), ruts, performed maintenance operations, etc. Traffic information, i.e. speed limits, AADT, the vehicle fleet composition of passenger cars, trucks and trucks with trailers, was retrieved from TIKK and the work plan. Furthermore, information regarding mass transport on the site, transport of raw material from the quarry and the asphalt production plant, and transport of excess material to a landfill was retrieved from blue-prints and from the project manager of the road construction of road 111. How the traffic volumes were expected to be divided between the thoroughfare and the bypass when the new road was built is stated in the work plan. However, not all information needed for the life cycle assessment could be collected from the above mentioned sources, especially regarding maintenance operations such as winter operation, new wearing course, cleaning and the number of hours the road lighting is active. Hence, some generalized values based on mainly Stripple (2001) have been used instead to include these aspects. Also, estimates for the production of steel and asphalt is retrieved from Stripple (2001), while crushing is from studies made by Andersson and Gunnarsson (2009) and fuel use of mass transports are from Karlsson and Carlson (2010). Road lighting is lit during the dark hours of the day and a normal use amounts to app. 4 000
hours per year in Sweden. The aim has been to have as recent and complete information as possible that are valid for Swedish conditions. To get the energy figures in primary energy use, a factor of 1.1 has been applied to the direct use of diesel and oil, and 2.23 for electricity (Stripple 2001).
The fuel consumption of traffic is estimated using a model called VETO. It is a simulation model based on physical relationships that was originally developed to estimate vehicle costs including fuel consumption, tyre ware, brake ware, repair costs and capital cost (Hammarström & Karlsson 1987). However, lately the model has primarily been used to estimate fuel consumption of traffic as a function of different driving resistances. The basic background data in VETO can be divided into the following main parts:
• Road: Geometrical alignment and road surface conditions. • Vehicle: Vehicle data, engine, engine map, tyre and transmission. • Driving behaviour: Goal speed and gear change.
• Weather: Wind, air and surface conditions with water or snow depths.
Vehicle data for an average Swedish vehicle in each of the categories passenger car, truck and truck with trailer, has been used in the calculation (Carlsson et al 2008). An average driving behaviour for these three types has been applied and the weather is representing normal condition and with dry road surfaces (Brodin & Carlsson 1986). The road is described according to the blue-prints and information from the databases TIKK and Väggrafen. The fuel consumption in both litres/10km and MJ/10 km is estimated for the three vehicle categories. To calculate the expected total traffic fuel use for one year, the estimated MJ/10 km is transformed to MJ/(road section) and multiplied with the AADT for each vehicle category. The annual fuel use is then multiplied with the number of years of the analysis period (60 years) and the total energy need for traffic is estimated.
CASE STUDY
Description of the case study
The location of the two road sections in the scenarios is presented in Figure 1. The thoroughfare, road 1412, runs through the small community of Viken in the south west of Sweden. The built bypass, road 111, lies to the east of the community. The main objectives for building the bypass were to increase traffic safety and accessibility, by reducing the traffic along road 1412 and transfer it to road 111 (Vägverket 2003). The bypass opened for traffic in 2007. The road sections included in the case study runs from the roundabout in the north marked X and to the intersection after the roundabout in the south marked Y. The basic data for the two road segments is described in Table 2.
Figure 1 Location of road 111 and road 1412. Reference: Google maps and authors editing.
The dominating speed limit for road 1412 is 50 km/h (67% of the road stretch) and the rest is 70 km/h. For road 111 there are three different speed limits where 100 km/h is most common (82 % of the stretch), then 80 km/h (16 %) and 70 km/h (2 %).
Table 2 Characteristics of the roads sections in the study.
Road Type Length Width
[m] [m] [% of road] 1412 1+1 4 300 6,0 7,5 9,0 13,0 3% 59% 17% 20% 111 2+1 5 500 6,0 7,0 13,0 14% 7% 79% Reference: Vägverket (2003) and blueprints from STA.
Road 111 is a so called 2+1 road, consisting of one lane in one direction and two lanes in the other direction and alternating every few kilometres see Figure 2. The directions are separated with a steel cable barrier. The benefit with these types of roads is that it is possible to reach near-motorway safety levels at a much lower cost than actually building or converting an existing road to motorway or dual carriageway (Carlsson and Brüde, 2005).
Figure 2 Description of a 2+1 road.
As described earlier two scenarios have been studied. Scenario A represents a situation when the bypass is not built. The estimated material and energy use is in this case limited to operation, maintenance and traffic on road 1412. The building phase is excluded in the study since the focus is on the differences between the two scenarios rather than the outcome of the individual scenarios. Scenario B represents a case when the bypass is built and the traffic is
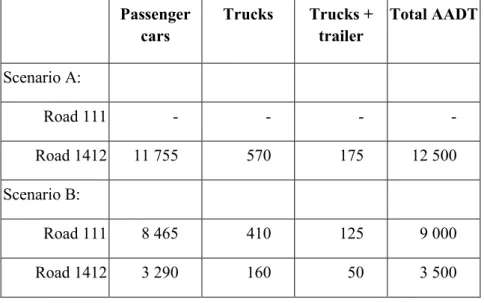
divided between the two roads. The material and energy use is estimated for the construction, operation and maintenance stage and traffic for road 111 and for the operation and maintenance as well as traffic for road 1412. The total AADT is 12 500 and it is the same for the two scenarios. In Scenario A all traffic is limited to road 1412, whereas in Scenario B app. 70% of the traffic is distributed to road 111 according to the expectations of traffic distribution described in the work plan, see Table 3. The vehicle fleet is divided into three categories that are representative for Swedish traffic; a standard passenger car, standard truck without trailer and a standard truck with trailer. In general they are somewhat larger than the average vehicles used in Europe. Driving behaviour is assumed to be standard Swedish driving behaviour and the traffic situation is free flow. In the case studies the traffic volume and engine efficiency is assumed to be unchanged during the analysis period as baseline for the life cycle assessment calculation. To see the effect on traffic fuel consumption due to more energy efficient vehicles, an increased traffic flow and traffic situations other than free flow, some additional calculations are made and presented in a sensitivity analysis.
Table 3 Annual average daily traffic (AADT) used in the case studies.
Passenger cars Trucks Trucks + trailer Total AADT Scenario A: Road 111 - - - - Road 1412 11 755 570 175 12 500 Scenario B: Road 111 8 465 410 125 9 000 Road 1412 3 290 160 50 3 500 Reference: Vägverket (2003)
RESULTS
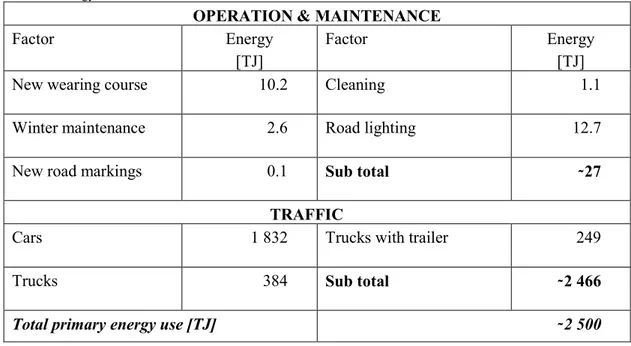
In this section the results are presented and Table 4 and Table 5 show the total energy use in a life cycle perspective for the two scenarios, A and B, respectively and for each stage and factor.
Table 4 Energy use in Scenario A.
OPERATION & MAINTENANCE
Factor Energy
[TJ]
Factor Energy
[TJ]
New wearing course 10.2 Cleaning 1.1
Winter maintenance 2.6 Road lighting 12.7
New road markings 0.1 Sub total ̴ 27
TRAFFIC
Cars 1 832 Trucks with trailer 249
Trucks 384 Sub total ̴ 2 466
Total primary energy use [TJ] ̴ 2 500
Reference: VETO simulations and own calculations. Table 5 Energy use in Scenario B.
CONSTRUCTION
Factor Energy
[TJ]
Factor Energy
[TJ]
Excavation 1.0 Machinery for paving 0.4
Reinforcement 1.1 Lighting poles and road markings
0.1
Crushed aggregates 2.5 Railings 1.5
Production of asphalt 12.0
Transports 12.8 Sub total 31
OPERATION & MAINTENANCE
New wearing course 29.0 Cleaning 2.9
Winter maintenance 6.4 Road lighting 27.0
New road markings 0.7 Sub total 66
TRAFFIC
Cars 3 012 Trucks with trailer 321
Trucks 606 Sub total ̴ 3 940
Reference: VETO simulations and own calculations.
From the tables above we can see the estimated energy demand for the two scenarios. In Scenario A the total primary energy use, over the life cycle, sum up to approximately 2 500 TJ and for Scenario B approximately 4 050 TJ, a difference of around 1 550 TJ. When comparing the total energy use per kilometre it is higher in Scenario A (app. 581 TJ/km) than in Scenario B (app. 413 TJ/km). This is due to a longer total road length in Scenario B, hence the amount of total energy use is distributed over a longer stretch. The main difference seen, when comparing the two scenarios, is the traffic’s energy need, which is 60% higher due to increased speed and a longer travel distance on the bypass, and constitutes 95% of the total increase. The construction phase is the least important regarding total energy use and only constitutes 2% of the total. An overview is provided in Table 6.
Table 6. Comparison of energy use in Scenario A and B
Scenario A [TJ] Scenario B [TJ] Difference [TJ] Construction - 31 +31
Maintenance & operation 27 66 +39
Traffic 2 466 3 940 +1 474
Total 2 500 4 050 +1 550
In Figure 3 below the energy use for the different vehicle types are described separately. As can be seen it is passenger cars that constitutes the major share which is due to sheer amount of vehicles of this category. As comparison to traffic the sum of the energy needed for the construction, operation and maintenance is presented in the fourth column. It is almost not visible for scenario A, whereas it in Scenario B is larger due to construction of the bypass and also because of the need for maintenance and operation of two roads, both road 1412 and 111, instead of one, only road 1412. The total road length increases from 4.3 km to 9.8 km between the scenarios.
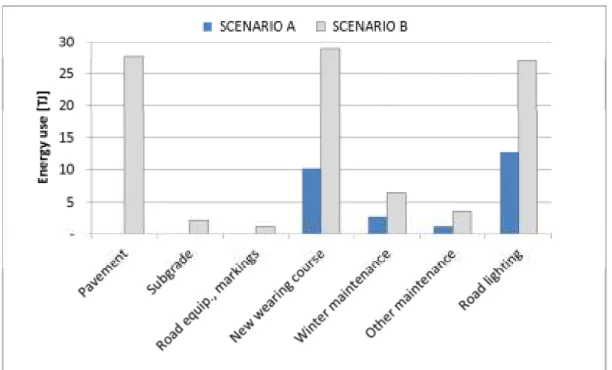
In Figure 4, the energy use for the different activities in the phases construction and maintenance for the two scenarios is shown. The main contributor to energy use is the activities concerning pavement and the rehabilitation work with laying new wearing course, which includes asphalt production, mass transportation and paving machinery. Also road lighting is a major source to energy use in this life cycle stage.
Figure 4 Energy use for activities in construction and maintenance.
Sensitivity analysis
The assumed 60 year analysis period is quite long and the vehicle fleet will be renewed during this time. Due to this, there is also an anticipated improvement in the fuel efficiency. In the tool “Handbook of emission factor” (HBEFA 3.1) there is a forecast of the development of the Swedish vehicle fleet until the year 2030 (HBEFA, 2013). Estimations of traffic fuel use that take into account more fuel efficient vehicles can be performed by using these figures. For the years between 2030 until the end of the analysis period there is an assumption that the vehicles will continue to become more fuel efficient at the same rate as they are in 2030 (app. 1% per year for passenger cars and 0.45% per year for trucks and trucks with trailers). Also, the traffic volume will probably increase during this time period, due to an increased population. In the work plan the assumption is an increase of 1.3% per year. The information of more fuel efficient vehicle fleet and increased traffic has been combined in four ways.
Table 6 Combination of traffic volume increase and fuel efficiency improvements for the sensitivity analysis. Case: Traffic volume
increase Fuel efficiency improvements I No No II No Yes III Yes No IV Yes Yes
The results are shown in Figure 5. Case I represents the baseline used in the life cycle assessment presented in the paper.
Figure 5 Traffic fuel consumption using with different prerequisites of traffic volume and fuel efficiency development.
The result indicates that with no increased traffic but with improved fuel efficiency, i.e. case II, the fuel use is lower than the baseline, app. 30%. Increased traffic volumes and no fuel efficiency lead to the largest traffic fuel consumption, app. 50% more compared to the baseline. Somewhat surprising, though, is that there is just a small difference between I and IV where case IV will lead to just 5% higher fuel use, even though the traffic volume has doubled during the analysis period. These estimations should just be seen as indications of the effect on traffic energy use by using different assumptions of traffic volumes and fuel efficiency improvements. No regard has been taken to if it is possible to more than double the traffic volumes, especially on the thoroughfare. However, it illustrate that the prerequisites for the estimations are sensitive for the final result.
Another sensitivity analysis conducted is to test the assumption of free flow for both road sections, which will minimise energy use due to less braking and acceleration. This is most likely true for the bypass road since there are few connecting roads and no junctions which will facilitate a free flow situation. This may not be the case for the thoroughfare which runs through the community and where there are intersections and crossings for pedestrians. Therefore, a strictly free flow situation may not be a likely scenario and the energy use for traffic is somewhat underestimated in the calculations. To use a more representative driving patter than free flow for this road will further increase the importance of traffic in energy use, and decrease the difference between the two scenarios. Using information in HBEFA 3.1 on emissions and fuel use during different traffic situation it is possible the get a rough estimation of the importance of another traffic situation. According to traffic flow measurements approximately 50% of the traffic volume has a somewhat lower average speed (TIKK 2012). Assuming that the traffic situation for these 50% is saturated, characterised by an uneven traffic flow and variation in speed (Sjödin et al 2009), it has been estimated that fuel use would increase by about 5% in Scenario A and 1% in Scenario B.
The estimated values for road lighting are for the lighting technology common today, mainly high pressure sodium lamps and ceramic metal halide lamps. The technology for road lighting is changing where the electric fitting are becoming more energy efficient. In the nearby future it is most likely that the energy use will be considerably lower than today, especially if LED
will become more common. Reducing the energy used for road lighting in Scenario B by 50 % will lead to a 20 % decrease in the stage operation and maintenance but only 0.3 % regarding the total energy use.
DISCUSSION
The analysis made in this paper is limited to energy use and do not include any other environmental aspects. Other environmental aspects, such as noise, biodiversity and land use, are also of interest and there are on-going efforts to develop environmental product declarations (EPD) and product category rules (PCR) for transport infrastructure. There are some examples of EPD for railway infrastructure, such as Bothniabanan (Uppenberg et al 2010) that includes EPD reports on, for instance, freight transport, passenger transport, railway infrastructure, tunnels and bridges, and the aim is now to develop similar EPDs and PCRs for road infrastructure. However, other life cycle studies of roads have shown that energy use is one of the most important sources to the environmental load, see for instance Mroueh et al (2001). Therefore, energy use can be considered to be a relatively good measure of environmental impact.
The results show that Scenario B generates a greater energy need than Scenario A. The increased energy use in Scenario B is partly due to construction of the new road. For this phase, i.e. building the bypass, the use of energy is 5.6 TJ/km. This is within the same range as other Swedish studies have shown for LCA energy need of road construction. Andersson & Gunnarsson’s (2009) study indicates an energy use between 1.7 - 5.2 TJ/km for a 6 meter width road. This is for the case of a road with low traffic whereas in our case the traffic would rather be defined as high for the bypass, with an AADT of 9 000. In their high traffic scenario the construction phase generates 12.7 -20.5 TJ/km. Another generalized example from Sweden indicates a higher energy use of 22.6 TJ/km (Kennedy et al, 2006) and the ECRPD project estimates a range of 3.3 to 11.7 TJ/km for a single carriageway (ECRDP, 2009). However, the area where the bypass is built in Scenario B has prerequisites for a rather low energy need since it is e.g. flat and straight. The road is built on mostly arable lands, which makes it relatively easy to construct a foundation for the road.
The main driver for the increased energy use when building the bypass is the traffic, mainly because of a longer driving distance and an increased average speed. A more detailed analysis of the results show that the passenger cars are the main source for energy use, as presented earlier in Figure 3. The average speed for a car is 96 km/h on the bypass compared to 60 km/h on the thoroughfare. This results in that the energy use per vehicle km on the bypass is 0.067 dm3 for cars and 0.22 dm3 for trucks, while it for the thoroughfare is 0.05 dm3 and 0.18 dm3 per vehicle km, an increase of 34 % and 22 %.
In the project ECRPD a range for the energy use by traffic is estimated to an annual use of 2.7 to 16 TJ/km (ECRPD, 2009). In our scenarios the traffic uses 6.7 to 9.6 TJ/km and year. However, it is important to keep in mind that there are several complications when comparing the energy use between projects. This is due to the different assumptions (e.g. life length of the road and traffic flows) made and different road types that have been selected, which are not always enough transparently described for valid comparisons (Santero et al, 2010; 2011a; 2011b).
The baseline assumption for the life cycle assessment is a steady state situation for both traffic volume and fuel efficiency. When assuming a yearly increase in traffic volume due to population growth and improved fuel efficiency during the analysis period, the result in total
energy need for traffic is just 5 % higher compared to the baseline. This demonstrates that improved fuel efficiency is important but not enough for reaching a more energy efficient traffic system. The presence of other traffic situation than free flow was also evaluated to some extent, indicating that less free flow has a rather marginal impact compared to the increased traffic flow.
Other studies also show that new roads in general lead to induced traffic flows, which will increase the energy use further and with more than a growth in population would explain (Tennøy 2010; Noland and Lem 2002). This implies that with the new bypass, the total traffic volume would increase more than if it was not built and thereby the energy use would also increase more. One question that arises is if the main aim of building the bypass will be lost, i.e. reducing traffic along road 1412 to increase traffic safety and accessibility. The impact of induced traffic volumes is interesting but not addressed in this study.
The overall goal of the Swedish transport policy is to ensure socio-economic efficient and sustainable provision of transport services for people and businesses throughout the country. Adhered to overall goal are a functionality objective and an impact objective concerning health, safety and the environment (The Swedish Government 2012). Competition between transport goals do occur (Tennøy 2010). In this case it is the aim of having more energy efficient transports and decreasing the energy use that is in conflict with the goals of increased accessibility and traffic safety, as well as decreased environmental load and barrier effects along the thoroughfare in the central parts of Viken (Vägverket 2003).
CONCLUSION
So far energy has not been an important decision factor concerning decision about infrastructure investments, which is also implied in this study. Our results shows that building the bypass increases the total energy use with approximately 60 % (1 550 TJ), mainly because of increased fuel use of traffic where higher speed and longer travel distance are the crucial factors. Thus the infrastructure investment is in opposition of the energy efficiency goal and, as long as fossil fuels are used, also the objective to reduce emission of greenhouse gases. The main objective for the bypass was to relieve the thoroughfare of traffic, to increase accessibility and traffic safety, which also are goals in the transport sector. The results further suggests that there are conflicts between the different transport political goals where solutions promoting accessibility, shortening of travel time and reduced impact of traffic in populated areas are sometimes, as this case indicates, seen as more important than energy efficiency. Also regarding the common knowledge that new roads leads to more traffic, one may question how long it will take before the thoroughfare has the same traffic volume again, which thereby would lead to a similar situation as the one the aim was to avoid.
ACKNOWLEDGEMENT
The authors would like to thank the two anonymous reviewers of the paper for their comments, and suggestion for improvements. The remaining errors rest with the authors.
REFERENCES
Andersson, C. and Gunnarsson, H. (2009) Klimatpåverkan vid vägbyggnad – Beroende av vald konstruktion, Högskolan i Halmstad
Brodin, A and Carlsson, A. (1986) The VTI traffic simulation model, VTImeddelande 321A. Carlson, A. (2011) Life cycle assessment of roads and pavements – Studies made in Europe,
VTI Rapport 736A
Carlsson, A and Brüde, U. (2005) Uppföljning mötesfria vägar – Halvårsrapport 2004:2, VTI notat 47-2005.
Carlsson, A., Hammarström, U. and Karlsson, B. (2008) Fordonskostnader för vägplanering. PM 2008-10-24, VTI
ECRPD (2009) WP6 – Life cycles evaluation, Report in ECRPD, Nov 2009,
ECRPD (2010) Energy conservation in road pavement design, maintenance and utilisation, Report in ECRPD, Feb 2010
European Commission (2009) Setting emission performance standards for new passenger cars as part of the Community’s integrated approach to reduce CO2 emissions from
light-duty vehicles, Regulation (EC) No 443/2009 of the European Parliament and of the Council of 23 April 2009.
European Commission (2010) EU Energy and transport in figures - Statistical pocketbook 2010, Publications office of the European Union, Luxembourg
Hammarström, U. and Karlsson B. (1987) VETO- ett datorprogram för beräkning av transportkostnader som funktion av vägstandard, VTI meddelande 501
Hammarström, U., Eriksson, J., Karlsson, R., Yahya, M-R (2012) Rolling resistance model, fuel consumption model and the traffic energy saving potential from changed road surface conditions, VTI rapport 748A
HBEFA (2013) http://www.hbefa.net, 2013-05-07.
Häkkinen, T. and Mäkele, K. (1998) Environmental adaptation of concrete – Environmental impact of concrete and asphalt pavements, VTT Research notes 1752
IERD (2006) Integration of the Measurement of Energy Usage into Road Design,
Commission of the European Directorate-General for Energy and Transport, Contract No: 4.1031/Z/02-091/2002. 2006
ISO (2006a) Environmental management – Life cycle assessment – Principals and framework, International organization for standardization, ISO 14040:2006(E) ISO (2006b) Environmental management – Life cycle assessment – Requirements and
guidelines, International organization for standardization, ISO 14044:2006(E) Karlsson, R. and Carlson, A. (2010) Estimation of energy consumption and carbon dioxide
emissions during construction, maintenance and operation of roads (report in Swedish), VTI notat 3-2010
Kennedy, E. et al. (2006) Integration of the measurement of energy usage into road design – Final report, Commissioned by the Commission of the European Communities DG TREN.
MIRIAM (2012) http://www.miriam-co2.net, 2012-10-23.
Mroueh, U-M, Eskola, P. and Laine-Ylijoki, J. (2001) Life-cycle impacts of the use of industrial by-products in road and earth construction, Waste Management 21 (2001) 271-277.
Noland, R.B and Lem, L.L (2002) A review of the evidence for induced travel and changes in transportation and environmental policy in the United States and the United
Kingdom, Transportation Research Part D: Transport and Environment, 7 (1), p.1-26. Prop. (2008) Mål för framtidens resor och transporter (government bill, in Swedish), Prop.
Santero, N., Masanet, E. and Horvath, A. (2010) Life Cycle Assessment of Pavements: A Critical Review of Existing Literature and Research, Report PCA R&D Serial No. SN3119a, Portland Cement Association
Santero. N., Masanet, E. and Horvath, A. (2011a) Life-cycle assessment of pavements. Part I: Critical review, Resources, Conservation and Recycling, Article in press
Santero, N., Masanet, E. and Horvath, A. (2011b) Life-cycle assessment of pavements. Part II: Filling in the gaps, Resources, Conservation and Recycling, Article in press SIKA (2008) Samhällsekonomiska principer och kalkylvärden för transportsektorn: ASEK 4,
SIKA PM 2008:3.
Sjödin, Å., Jerksjö, M., Sandström, C., Erlandsson, L., Almén, J., Ericsson, E., Larsson, H., Hammarström, U., Yahya, M-R., Jphansson, H. (2009) Implementering av ATREMIS Road Model i Sverige,Rapport B1831, Februari 2009, IVL Svenska Miljöinstitutet Swedish Transport Administration (2012a) Minskade utsläpp av koldioxid från vägtrafiken,
PM 2012-02-27, Swedish Transport Administration, Borlänge.
Swedish Transport Administration (2012b) http://www.trafikverket.se , Swedish Transport Authority, 2012-10-22
Stripple, H. (2001) Life cycle assessment of road – A pilot study for inventory analysis, 2nd ed. Swedish Environmental Research Institute, 2001.
Tennøy, A. (2010) Why we fail to reduce urban road traffic volumes: Does it matter how planners frame the problem?, Transport Policy 17, p. 216-223.
The Swedish Government (2012) http://www.regeringen.se/sb/d/11771, 2012-10-22. TIKK (2012) http://gis.vv.se/tfk2/tfk/indextikk.aspx?config=tikk , 2012-10-23.
Uppenberg, S., Aava-Olsson, B. and Berglund, M. (2010) Environmental product declarations (EPD:S) for the Bothnia line - Final report on background, contents, use and future development, Botniabanan AB, 2010-08-31
Vägverket (2003) Väg 111 Förbifart Viken, Gråläge-Lerberget, Arbetsplan Beskrivning, Objekt 2121, 2003-09-01.