DISSERTATION
A CLONABLE SELENIUM NANOPARTICLE IN ACTION: HIGH RESOLUTION LOCALIZATION OF FTSZ USING ELECTRON TOMOGRAPHY
Submitted by Kanda Borgognoni Department of Chemistry
In partial fulfillment of the requirements For the Degree of Doctor of Philosophy
Colorado State University Fort Collins, Colorado
Spring 2021
Doctoral Committee:
Advisor: Christopher J. Ackerson James Neilson
Alan J. Kennan Susan Tsunoda
Copyright by Kanda Borgognoni 2021 All Rights Reserved
ABSTRACT
A CLONABLE SELENIUM NANOPARTICLE IN ACTION: HIGH RESOLUTION LOCALIZATION OF FTSZ USING ELECTRON TOMOGRAPHY
A meaningful understanding of biochemistry requires that we understand the function of proteins, which is heavily dependent on their structure and location within an organism. As the Resolution Revolution of cryo-electron microscopy gains unprecedented ground largely due to the recent development of commercially available direct electron detectors, energy filters, and high-end computation, thousands of protein structures have been solved at atomic or near-atomic resolution, with the highest resolution structure to date being solved at 1.2 Å. A major challenge that has limited the broad use of cryo-electron tomography (cryo-ET) is locating a protein of interest in an organism, as no commercially available high-contrast markers which can be generated in vivo exist. Herein, we present a breakthrough study which aims to solve this problem by synthesizing high contrast metal nanoparticles labeling desired proteins in situ. We isolated a Glutathione Reductase-like Metalloid Reductase (GRLMR), which can reduce selenite and selenate into selenium nanoparticles (SeNPs), from Pseudomonas moraviensis stanleyae found in the roots of a Se hyperaccumulator Stanleya pinnata, or Desert Princes’ Plume. A recombinant variant, denoted as a clonable Selenium NanoParticle (cSeNP), was fused to filamentous temperature sensitive protein Z (FtsZ), and the chimera was expressed in vivo using a T7 expression system in model organism E. coli for a proof-of-concept study. Because the SeNPs biogenically produced are amorphous, they exist in a quasistable state and are composed of polymeric Sen in the form of chains and rings that are constantly breaking and reforming through
a disproportionation-like reaction can be done either in vivo or as a post-fixation step to form crystalline metal selenide (MSe) NPs that can withstand the processing liquids used. Thereafter, electron tomography was used to acquire a tilt series that was reconstructed into a tomogram and segmented using IMOD, generating a model representing MSeNPs labeling FtsZ filaments. As such, we have demonstrated the potential of using cSeNP as a high resolution marker for cryo-ET. While our study relied on traditional preservation and embedment techniques, we anticipate that for cells preserved via vitrification, cloned SeNPs can be used without subsequent transformation to MSeNPs, as the amorphous particles are stable in aqueous media. Prospectively, we expect that clonable nanoparticle technology will revolutionize cryo-ET, allowing us to localize proteins in vivo at high resolution while maintaining organism viability through metal immobilization. Furthermore, this technique can be expanded to other imaging modalities, such as light microscopy and X-ray tomography, through the discovery and engineering of other clonable nanoparticles.
ACKNOWLEDGEMENTS
In acknowledgement of the work itself, it could not have been done without the efforts of several people who have contributed to the advancement of clonable nanoparticle technology. To Bossman Ack for starting the lab and the bud of the idea. It has truly flourished into something quite revolutionary (in our opinion, obviously, and hopefully in others’ too). Thank you for working with me over the years and for providing the support that you could. It was certainly more than what most advisors would have done.
To those who began the journey, Ricky (who I had the chance to work with and learn from), Thomas, Mackenzie, and Lucian, by discovering GRLMR from a field in Colorado and doing all of the initial studies. In that regard, I guess we should also thank those miners from the 1800s who did not mind dumping their waste into nature…? Lemon meringue pie from lemons. To Zach (Butz) who I worked closely with for several years on this project. It would not have gotten to this stage without you. To Zach (Nilsson), who also has contributed to the advancement of this project through instrumentation expertise. To those in the Prieto group, Jen and Becca, for multiple discussions about synthesizing and looking at nanoparticles.
To my lab mates Phillip my desk buddy, James and Ian for keeping me up to date on the extreme right ideals, Christian and Hosier and Ryan for being responsible adults I could talk with about problems and science, and Alex and Collin for keeping me company in the Bio lab. To the Ack lab alumni. Heine for being awesome, Tim for showing me around and talking with me about the lab, Thomas for continuing to talk with me about TEM and other stuff, and Scott and Marcus for hanging out with us.
To my family for supporting me. My no FOMO Mom for making me smart and Alex for being the best big brother in the world. To those who personally supported me, especially Lily, Neubs, and Maggie for always being true friends. To my wifey Luiza, I am very grateful to have met you. I am also thankful to have met the other Brazilians, Rute, Daniel, Chawani, Juliana, and Priscilla, for the great times we had together in the USA and in Brazil. To my pottery friends, Liz and David and Sean and Matt and Sue, for having a blast with ceramics.
TABLE OF CONTENTS
ABSTRACT………ii
ACKNOWLEDGEMENTS………iv
Chapter 1 - Introduction to Clonable Nanoparticle Technology……….1
Chapter 2 - Characterizing the Size Control and Conjugation of a Clonable Selenium Nanoparticle……….8
Chapter 3 - Optimization of a Clonable Nanoparticle Label……….17
Chapter 4 - Stabilization of Amorphous SeNPs via Disproportionation into MSeNPs………….37
Chapter 5 - A Breakthrough Study that Applies SeNP Disproportionation Reactions and Clonable Labeling Technology to Localize FtsZ Protofilaments In Vivo……….…47
Using KMnO4 to Shell Biogenic SeNPs and Enhance Cellular Contrast In Vivo……….50
Disproportionating Biogenic SeNPs into ZnSeNPs as a Post-Fixation Step………..52
Disproportionating Biogenic SeNPs into CdSeNPs as a Post-Fixation Step………..54
Disproportionating Biogenic SeNPs into Ag2SeNPs as a Post-Fixation Step……….56
Disproportionating Biogenic SeNPs into CuSeNPs as a Post-Fixation Step………..59
Disproportionating Biogenic SeNPs into CuSeNPs In Vivo………...60
Tomograms and Models of the CuSe Sample Prepared Using a Post-Fixation Disproportionation……….62 References………..70 Appendix A………78 Appendix B………84 Appendix C………93 Appendix D………..101
CHAPTER 1: Introduction to Clonable Nanoparticle Technology
Proteins are largely responsible for all of the processes that maintain the health and proper function of each individual cell. Incredibly, these proteins must work together in a delicate balance to perform variegated tasks such as biomolecule transport, signaling, catalysis, and gene regulation as a few examples. A full understanding of how specific cell types contribute to the vitality of an organism requires that we understand complex biological systems, which are composed of and regulated by proteins. Thus, methods that probe protein function is paramount to the fundamental understanding of how organisms function at the molecular level.
The main determinants of protein function are structure and location within a system. Great advances have been made in structure determination due to the considerable developments in X-Ray Crystallography and NMR Spectroscopy, allowing for tens of thousands of proteins to be solved at angstrom-level resolution and deposited into the Protein Data Bank (PDB).1 While these achievements are instrumental to progress in the field, these methods are limited to proteins that are amenable to specific experimental parameters. For example, proteins must be fairly small to be analyzed by traditional H1NMR (~35 kDa), or they must be crystallizable to be analyzed using X-Ray Spectroscopy.1,2 Importantly, these methods rely on extracting and purifying a protein of interest. This removes it from the native environment, causing a loss of one of the key determinants of protein function: location. Hence, for a full understanding of biological systems, it is vital to also localize where proteins of interest are within a cell using microscopy.
Biological microscopic studies, once revolutionized by the discovery of clonable fluorophores like Green Fluorescent Protein (GFP), engender foundational evidence for cellular processes via in situ protein labeling and tracking by fluorescence. While fluorescence microscopy has greatly improved our understanding of subcellular processes, it is limited by low spatial
resolution due to the diffraction limit of light.3,4 Typically, standard fluorescence microscopy is limited to around 200 nm spatial resolution in two dimensional imaging and 400 nm in tomography, which is larger than many subcellular structures as shown in Figure 1.1 reproduced with permission from Huang et al.4–7 Currently, super resolution methods that break the diffraction barrier of light are vigorously being developed. While super resolution fluorescence microscopy has the potential of achieving a spatial resolution up to 10 nm, the best resolution achievable with a biogenic tag remains around 40 nm in two dimensions.4,7–10 Furthermore, light microscopy is limited to locating only the proteins that are labeled, which disregards important structural information of the surroundings.
For a global picture that details cellular ultrastructure, we must turn to electron microscopy (EM), which is experiencing its own Resolution Revolution due to recent developments commercially available direct electron detectors and user friendly, computationally expensive programs.11–14 Cryo-electron tomography (cryo-ET) of whole organisms coupled with subtomogram averaging permits us to resolve proteins to ca. 2.6 nm on average, with the highest resolved structure to date being solved to near-atomic precision at 3.5 Å.15 Of particular importance to this revolution is single-particle cryo-EM, which has resulted in over 6,000
Figure 1.1: Sizes of common biological specimens and structures and the resolution limit of light microscopy reproduced with permission from Huang
et al. (2010). From left to right: mammalian cell, bacterial cell,
structures being solved at near-atomic or atomic level resolution and deposited into the Electron Microscopy Data Bank (https://www.ebi.ac.uk/pdbe/emdb/index.html). The highest resolved structure of human apoferritin has been solved to 1.15 Å resolution.12,16 Not only does this rival X-ray crystallography, but it also provides a means to solve structures of proteins that cannot be crystallized, as is the requirement for X-ray analysis.17 Furthermore, to study small proteins that can be crystallized, by using microcrystal electron diffraction (microED) coupled with tomography, it is possible to solve crystal structures in three dimensions to subatomic resolution, with the highest resolution achieved to date being 0.6 Å.18 In short, electron microscopy allows us to view high resolution, global pictures of organisms as well as routine near-atomic resolution images of cellular ultrastructure.
Fundamentally, images are created in an electron microscope through the sample/beam interaction. This interaction causes countless events to occur, such as electron scattering, secondary electron scattering, and X-ray emissions to name a few, which allows us to collect many different forms of data. For example, by measuring the electrons ejected from the sample, we can gain topographical information from the sample as is routine for Scanning Electron Microscopy (SEM). The X-rays emitted from the sample can be used for elemental analysis with techniques like Energy Dispersive X-ray Spectroscopy (EDS). Finally, measurably scattered electrons allow us to view atomic-level structures, such as lattice planes in crystalline samples, and create high-resolution images in Transmission Electron Microscopy (TEM).19–24 To create such high-resolution images in biological TEM, it is vital to create contrast. Since low atomic number elements (i.e. the main components of biomatter: C, N, O) interact very little with the incident beam, exogenous elements with a drastically different atomic composition must be added, such as a heavy metal, to “stain” biological material.20,25–27 While common heavy metal staining provides
the necessary contrast, these stains only target common structures and functional groups (phospholipids, DNA, amines, etc.), making it impossible to visualize specific proteins.26,28
To improve contrast specificity, immunogold labeling was developed for by conjugating antibodies to gold nanoparticles.29–33 Even though antibodies can hypothetically localize specific proteins, in practice these proteins tend to lose their antigenicity during sample processing that leads to background labeling.34 In another aspect, the nanoparticle conjugates are too large to diffuse through the cell membrane (ca. 15 – 20 nm), requiring that the technique be used as a post-fixation step after the cell or tissue has been sliced open to expose the target.25,30–33,35,36 This limits our use of high contrast markers to room temperature EM analysis. With the extraordinary advances currently underway in cryo-EM, largely thanks to the development of direct electron detectors and high-end computing, it is a great disadvantage to be unable to use this technique efficiently in a living system.14
Alternatively, the label can be introduced into the organism at the DNA level by cloning the genetic sequence of the tag directly conjugated to the protein of interest, providing perfect specificity. Practically, clonable markers must be portable, small enough to not alter protein function, and must not require post-synthetic modification to be functional.37–40 The grand challenge to developing a clonable EM tag is that the label itself cannot be the contrast agent. The clonable tag must be able to produce the contrast agent. To date, the most promising biogenic tags, like APEX2, use radicals to generate a localized osmiophilic polymer that can be stained with osmium tetroxide.3,28,33,41,42 While there are some considerations to mind regarding the specificity of the metal stain, the main limitation with this method is that it cannot be done in vivo. The sample must be fixed in order to generate the contrast agent, which again neglects the opportunity for native cryo-EM imaging. Also, conventional fixation leads to artifacts and great perturbation of
cellular ultrastructure, which can cause misinterpretation of structural data. To date, our inability to use the few clonable EM tags that have been developed is greatly limiting.25
We believe a better approach would be to use enzymes capable of forming a metal nanoparticle so that a high contrast marker would be localized directly next to a target of interest (see Figure 1.2). Countless methods of biological nanoparticle synthesis have been developed that utilize either bioscaffolds for patterned mineralization or organismal extracts for metal reduction and nanoparticle production.43–56 However, no reports exist of single enzymes capable of reducing or oxidizing metals into nanoparticle form.57
Heavy metals pose a threat to living organisms, as they have been shown to exhibit great toxicity via mechanisms that either produce radical oxygen species or interfere with essential nutrient uptake.57–63 To alleviate these detriments, biological pathways have naturally evolved to handle heavy metal stress through small molecule chelation, protein adsorption, metal efflux, and immobilization.57–73 Of particular interest to us are pathways that have evolved to immobilize metals in the form of nanoparticles. Nanoparticles are easily distinguished from biological material in an electron microscope and can be cleared through the renal system of organisms at sizes less than 6 nm, greatly reducing their long-term toxicity.74,75 Therefore, by developing a clonable nanoparticle, i.e. by genetically encoding an enzyme capable of synthesizing a nanoparticle, it is possible to achieve EM contrast in situ while maintaining organism viability and target function.
We initiated a field study in the Colorado Mineral Belt collecting bacterial samples found in heavy metal contaminated waters.76 We hypothesized that these bacteria are likely surviving due to one of the detoxification pathways mentioned above. To this end, we can isolate and screen
Figure 1.2: Cartoon representation of a clonable nanoparticle tag synthesized by an enzyme linked to a protein of interest (POI).
various species against toxic levels of different metals found at the site and search for nanoparticle formation via an observed color change in the bacterial culture.
One strain, Pseudomonas moraviensis stanleyae, was isolated from the root of a Se hyperaccumulator Stanleya pinnata, or Desert Princes’ Plume. The strain was extremely tolerant to toxic levels of SeO32- and SeO42- (10 mM) and turned a brick red color, indicating the formation of zerovalent, amorphous Se as shown in Figure 1.3.57,76 The left image is a suspension culture of the strain when exposed to 10 mM SeO32- and the right picture is of the control where no SeO3 2-was added. In a separate study, it 2-was also shown that P. moraviensis is the fastest Se-reducing strain in the world.77
From this strain we isolated a single enzyme, a Glutathione Reductase-like Metalloid Reductase (GRLMR), that was responsible for reducing selenoxyanions into amorphous Se nanoparticles (SeNP) in a NADPH-dependent manner.57 As a homodimer capable of forming nanoparticles, we hypothesized that GRLMR would be a great springboard in a proof-of-concept
Figure 1.3: Bacteria grown with (left) and without (right) SeO32- supplementation in LB. Cultures under notmal growth
conditions appear yellow like the flask on the right. Because GRLMR reduces SeO32- to SeNPs, the culture changes collor
from yellow to red as seen in the right flask. Image reproduced from Ni, T. et al. (2015) with permission from RSC Publishing.
study showing the possibility of using clonable nanoparticle labeling technology for high resolution localization in biological electron microscopy.
CHAPTER 2: Characterizing the Size Control and Conjugation of a Clonable Selenium Nanoparticlea
Introduction
For this tag to be effective, three criteria must be met by the enzyme: reduction of the metal precursor, nanoparticle retention, and size control.57 While GRLMR innately meets the first criteria, it was not capable of conjugating to those particles once formed or effectively controlling the size of SeNPs. Retention of the nanoparticle is crucial so as to avoid nonspecific contrast in electron microscopy. Additionally, it has been suggested that a particle size of ~5 nm should be small enough to not disrupt native target function, necessitating enzymatic size control.57
For nanoparticle conjugation, we needed to modify the enzyme to contain a region that favored SeNP binding. We used a phage display assay, which has been done successfully by other groups to specifically bind metal salts, nanoparticles, and surfaces, to create a library of 12-residue peptides that specifically favored SeNP binding.57,78 These peptides were screened against 5 nm enzymatically produced particles, and from this library we found that the 12mer with the sequence LTPHKHHKHLHA worked as the best selenium binding peptide (SeBP).78 Because GRLMR functions as a homodimer, we first concatenated two copies of the wild type (WT) gene together using a flexible-rigid-flexible linker with the sequence (GGGGS)-(EAAAK)-(GGGGS) along with two copies of SeBP.57,78 The final construct is denoted as a clonable Selenium NanoParticle (cSeNP).
To characterize peptide-SeNP conjugation, we can use vibrational spectroscopy to probe specific side chains that we suspect are interacting with the nanoparticle by tracking known
markers for metal binding and backbone conformation. To avoid saturation from water modes, Raman spectroscopy was chosen for the vibrational study. For a molecule to be Raman active, the change in the polarizability of the bond must be nonzero. Raman scattering occurs when the photons of a monochromatic light source collide with the electrons of the molecule and become inelastically scattered. The intensity of the mode is dependent on the change in polarizability of the molecule, and the shift is due to the vibrational energy of the mode with respect to the wavelength of incident light. For example, highly polar molecules such as water will have a very weak signal in Raman spectroscopy due to the lack of polarizability of the OH bond. Because of the weak water signal, Raman spectroscopy is ideal for studying biomolecules.
Results and Discussion
Enzyme-NP conjugation of WT versus the variant (cSeNP) was initially tested using a Bradford assay to measure the amount of enzyme that remained associated with SeNPs. The results in Appendix A Figure A.1 demonstrate that only 13% of WT was bound to SeNPs whereas 82% of cSeNP bound to particles. This suggests that fusion of SeBP to GRLMR greatly improved the conjugation of the enzyme to nanoparticles.
To confirm that SeBP was forming a covalent bond with the SeNP surface, Raman spectroscopic analysis was conducted. Because histidine (labeled for clarity in Figure 2.1) has been shown to play an important role in coordinating metal ions such as Cu2+ and Zn2+, we believe that
Figure 2.1: Histidine labeled for clarity when discussing vibrational modes below. Structure generated using ChemDraw®.
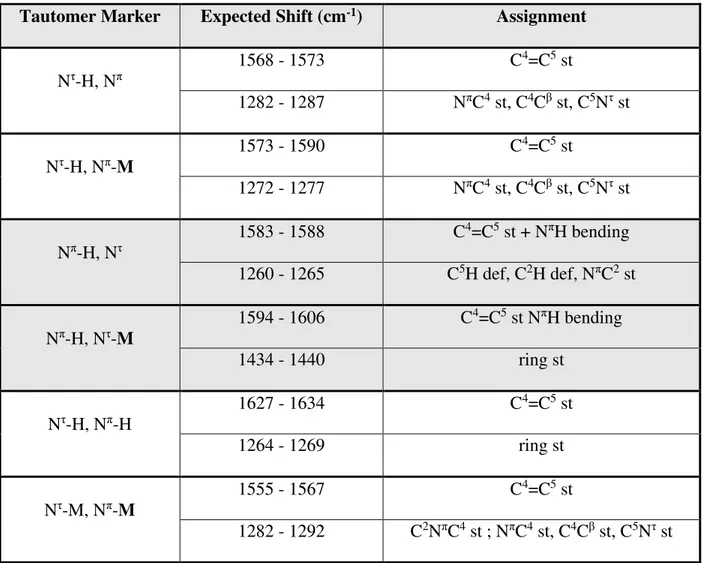
the SeBP binds favorably to SeNPs due to the abundance of His present.79–83 The nitrogen atoms of the imidazole ring at the first and third position are labeled Nτ and Nπ, respectively.15 The imidazole group is known to coordinate with metal ions, and tautomer markers in the 900 – 1630 cm-1 region have been previously used to identify His-metal binding.80–82,84 Depending on the protonation state of the ring, the 1565 – 1635 cm-1 region correlates with the C4=C5 stretching mode. This mode tends to upshift by 10 – 20 cm-1 upon binding to a metal ion.80,84 Key tautomer markers are listed in Table 2.1.
Table 2.1: Expected shifts and assignments of histidine tautomer markers in the vibrationally sparse region.
Because vibrational spectra can easily be convoluted due to the substantial number of bonds in a protein, the peptide-nanoparticle complex was measured with no enzyme present.
Tautomer Marker Expected Shift (cm-1) Assignment
Nτ-H, Nπ 1568 - 1573 C4=C5 st 1282 - 1287 NπC4 st, C4Cβ st, C5Nτ st Nτ-H, Nπ-M 1573 - 1590 C4=C5 st 1272 - 1277 NπC4 st, C4Cβ st, C5Nτ st Nπ-H, Nτ 1583 - 1588 C4=C5 st + NπH bending 1260 - 1265 C5H def, C2H def, NπC2 st Nπ-H, Nτ-M 1594 - 1606 C4=C5 st NπH bending 1434 - 1440 ring st Nτ-H, Nπ-H 1627 - 1634 C4=C5 st 1264 - 1269 ring st Nτ-M, Nπ-M 1555 - 1567 C4=C5 st 1282 - 1292 C2NπC4 st ; NπC4 st, C4Cβ st, C5Nτ st
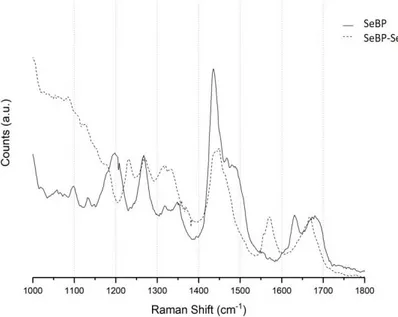
SeNPs were synthesized fresh for each measurement using a borohydride reduction method followed by a peptide conjugation step and subsequent purification. SeNPs were characterized using Raman spectroscopy and Dynamic Light Scattering (See Appendix A Figures A.2 and A.3). DLS showed that SeNPs formed with this protocol arrested around 40 nm in diameter, and Raman data show two characteristic vibrational modes at 234 cm-1 and 252 cm-1, indicative of amorphous SeNP formation.85 Raman spectra of the SeBP control sample and the SeBP-SeNP sample were collected as described in Appendix A and are show in Figure 2.2. We tracked the vibrational modes
of histidine that correlate with His-metal binding and of the SeBP backbone that have previously shown to correlate with secondary structure conformation.
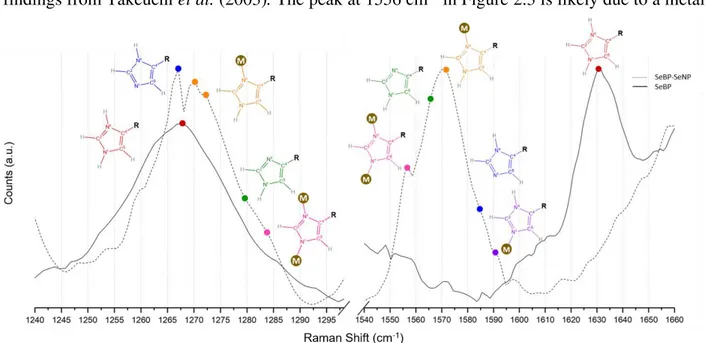
The spectra were expanded to regions of interest as shown in Figure 2.3. Above each peak is a representative His structure that is color coded according to the marks on the traces. The 1631 – 1636 cm-1 peak of the SeBP control sample correlates with the histidine C4C5 stretching mode (shown above in red) that indicates a Nτ-H/Nπ-H protonation state (HisH2+). This assignment is supported by the presence of the peak at 1268 cm-1, which also corresponds to a HisH2+
Figure 2.2: Raman spectra of a SeBP film drop-cast from a sample dissolved in pH 7.4 1x PBS (solid trace) and a SeBP-SeNP film drop-cast from a sample dissolved in pH 7.4 1x PBS (dashed trace).
imidazolium ion. Upon nanoparticle conjugation, observed in the SeBP-SeNP trace, the C4C5 stretching mode downshifts to a broad peak centered at 1571 cm-1. The region of the trace from 1565 – 1573 cm-1 corresponds to a neutral imidazole form (HisH) that is unbound with the Nτ tautomer protonated and the Nπ unprotonated (structure shown in green). The portion of the peak above 1573 cm-1 likely corresponds with a metal bound His in the form Nτ-H/Nπ-M (structure shown in orange). This assignment is supported by the shift in the band at 1268 cm-1 shown in Figure 2.3. Regarding the tautomer form Nτ-H/Nπ-M, upon metal binding the band splits into two sets of peaks with one at 1267 cm-1 and one set at 1271/1273 cm-1. The 1267 cm-1 band is attributed to HisH in the form Nτ-H and unbound Nπ (structure shown in blue), whereas the 1271/1273 cm-1 band correlates with a Nτ-H/Nπ-M form (structure shown in orange), which agrees with the findings from Takeuchi et al. (2003). The peak at 1556 cm-1 in Figure 2.3 is likely due to a metal
bridging form of His (Nτ-M/Nπ-M) with the corresponding peak arising at 1284 cm-1 (structure shown in pink).
Figure 2.3: Raman spectra of SeBP (solid trace) and SeBP-SeNP (dashed trace). The spectra are focused on regions of His tautomer markers. Specific His modes are shown above the spectrum and color coded with the marks (red = Nτ-H/Nπ-H; purple = Nτ-M/Nπ-H; blue = Nτ/Nπ-H; orange = Nτ-H/Nπ-M; green = Nτ-H/Nπ; pink = Nτ-M/Nπ-M).
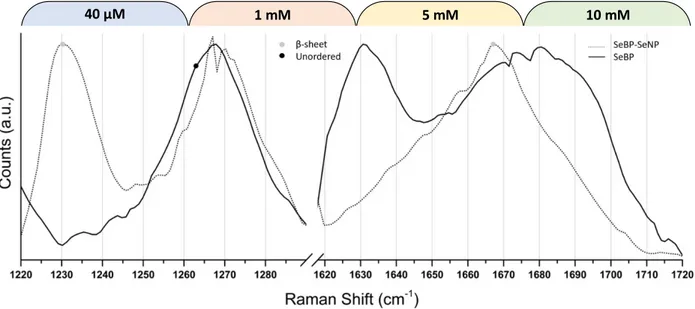
Additionally, we tracked the amide I and amide III backbone modes of SeBP to observe conformational changes that occurred upon conjugation to SeNP. The amide I backbone mode is located in the 1600 – 1700 cm-1 region and is comprised mainly of C=O symmetric stretching with contributions from an out-of-phase CN stretching, CαCN deformation, and NH in-plane bending.86–92 This mode is considerably influenced by transition dipole coupling, which describes the conformational dependence of the dipole interaction energy on spatial separation and orientation.86,92 The amide III mode, also sensitive to structural rearrangement is located in the 1200 – 1320 cm-1 region and mainly involves an in-phase combination of CN stretching coupled with NH in-plane bending with some influence from CαC stretching and C=O in-plane bending.86,91,92 Figure 2.4 has been expanded to these two regions. In the control trace (no SeNPs), the inherent broadness and location of the amide I mode from 1650 – 1710 cm-1 is suggestive of an unordered backbone structure. When SeBP is bound to SeNPs, the peak narrows and downshifts to 1667 cm-1, which correlates with a mainly β-sheet type backbone structure. The conformational assignment of the backbone mode before and after SeNP conjugation can be confirmed by observing the amide III mode in the 1200 – 1320 cm-1 region as also shown in Figure 2.4. In the control trace, when SeBP is not bound to SeNPs, the mode is convoluted by the His modes centered at 1268 cm-1 (Figure 2.3 solid trace). An amide III mode centered about 1260 cm-1 suggests an
unordered structure, and one that is centered at 1265 cm-1is suggestive of either an α-helix or a polyproline II (PPII) type structure as shown by the black mark on the solid trace in Figure 2.4. The presence of PPII structure is likely, since the peptide contains a Pro residue that causes this shift. Upon binding to SeNP, the amide III mode downshifts to 1230 cm-1 shown by the grey mark on the dashed trace in Figure 2.4, which confirms a β-sheet structure.
After confirming that cSeNP was capable of covalently binding to SeNPs via the SeBPs, we tested whether it also imparted size control to the functionality of the tag. We first measured the particles formed using the WT versus cSeNP with dynamic light scattering (DLS). From these experiments, it was observed that cSeNP was able to greatly control the size of the SeNPs formed (~80 nm) when compared to the WT that formed particles is the micron regime (see Appendix A Figure A.4).78
To correlate the size differences observed in DLS, S(T)EM was done on particles synthesized with a wide concentration range of HNaSeO3 (40 µM – 10 mM) using cSeNP and WT (Figure 2.5). Upon analysis, we observe that cSeNP forms particles with size distributions (PSD)
Figure 2.5: S(T)EM images of SeNPs synthesized with cSeNP (top row) and the wild type (bottom row) from 40 µM – 10 mM SeO2-. The particle size distribution for each sample is given in the top right of the representative
Figure 2.4: Raman spectra of SeBP (solid trace) and SeBP-SeNP (dashed trace) expanded to the amide I and amide III regions. The black and grey marks are centered upon modes correlated with an unordered structure or a β-sheet
of 37.38 ± 5.75 nm (n = 533), 32.60 ± 6.29 nm (n = 546), 37.34 ± 7.12 nm (n = 1288), and 45.89 ± 6.98 nm (n = 694) when reacted with 40 µM, 1 mM, 5 mM, and 10 mM HNaSeO3, respectively. Similarly, the WT PSD is 48.48 ± 17.63 nm (n =1078), 61.59 ± 24.99 nm (n = 846), and 59.92 ± 21.19 nm (n= 1172) when reacted with 1 mM, 5 mM, and 10 mM HNaSeO3, respectively. From the WT sample reacted with 40 µM HNaSeO3, no particle formation was observed and only salts remained as is seen in Figure 2.5E. From the PSD and S(T)EM images shown in Figure 2.5, we confirm that cSeNP is able to maintain much smaller SeNPs sized ca. 35 nm whereas the particles synthesized with the WT grow much larger (>80 nm) and cluster into micron sized aggregates.
The particle size distribution (PSD) can be explained both by the ability of cSeNP to act as a capping agent and by LaMer burst nucleation and growth. Firstly, a kinetics study was done to monitor the turnover number of the variant versus WT. Impressively, concatenation of the enzyme resulted in an increased turnover number, kcat = 40 (min-1) for the cSeNP compared to kcat = 23
(min-1) for the WT.78 Because cSeNP can produce reduced Se much faster, there are many more selenide species available as burst nucleation sites. The increase in nucleation sites causes a much quicker depletion of the remaining selenide species during growth, ultimately leading to smaller particles.93,94 This can also explain why the WT is unable to produce SeNPs at 40 µM HNaSeO3 shown in Figure 2.5 panel E compared to the cSeNP in panel A, which is able to produce particles at that concentration. The WT is unable to produce enough reduced Se quickly enough to reach the critical concentration required for burst nucleation, and the Se species are oxidized back to a more soluble form rather than nucleating.94
In sum, we demonstrated that SeBP improves the ability of GRLMR as a cSeNP tag by imparting both NP conjugation and size control. The SeBP is able to covalently bind to those particles via the imidazole ring of histidine by forming both monovalent and divalent His-SeNP
complexes coupled with conformational changes in backbone structure. It also allows the enzyme to better conjugate to the particles, improving retention from 13% to 82%. Furthermore, because cSeNP acts as a ligand and the kinetics of SeO32- reduction the concatemer are apparently faster, it also is able to better control the size of the particles formed. Over a wide range of selenite concentrations, cSeNP arrests the size of the particles to ca. 35 nm.
Outlook
As demonstrated above, cSeNP meets the requirements we have set forth as a viable clonable nanoparticle label. It is able to form SeNPs, conjugate to those SeNPs, and control the size of SeNPs. Moving forward, we hypothesized that upon satisfactorily designing and characterizing the cSeNP, it could be used in a proof-of-concept study to test whether this construct would successfully localize a well-studied protein of interest.
CHAPTER 3: Optimization of a Clonable Nanoparticle Label
The model system we chose for a proof-of-concept study is filamentous temperature sensitive protein Z (FtsZ), a bacterial tubulin homologue that, along with at least 13 other division proteins, aids in cleaving a parent cell into two daughter cells during binary fission through Z ring formation.95,96 The structure of FtsZ is highly conserved across species, albeit their sequences vary greatly.95,97 While the C-terminal end is responsible for recruiting small molecules and other division proteins, such as FtsA and ZipA, to tether the filament to the membrane, the N-terminal end is responsible for polymerization with other FtsZ monomers.95,97,98 The ratio of FtsZ and other division proteins must remain in a delicate equilibrium for cells to divide. If these ratios are altered, membrane cleavage cannot progress.
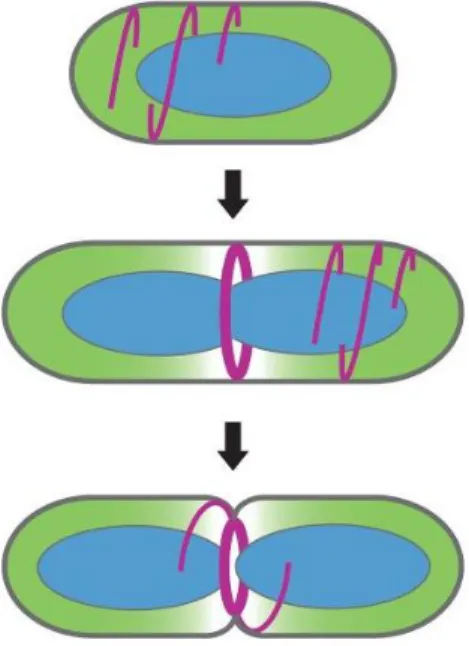
FtsZ is a GTPase that polymerizes with other FtsZ monomers into 30 – 80 subunit protofilaments that randomly align the cell membrane. When a cell undergoes binary fission, these protofilaments migrate to the midpoint of the elongated cell into a structure known as the Z ring. During Z ring formation, the protofilaments loosely align into disordered helical bundles along the midsection of the cell as shown in Figure 3.1, reproduced with permission from The Annual Review of Biochemistry, Lutkenhaus (2007).95,99 The Z ring acts as a scaffold for other division proteins to bind and provide the constrictive force that cleaves the parent cell into two daughter cells.100,101 After division, the units disassemble and return as randomly oriented helical protofilaments running along the membrane.
Structurally, the assembly of protofilaments into a Z ring in vivo is largely debated. In E. coli, some cases show a ring structure composed of several assembled protofilaments, while others argue the protofilaments are loosely arranged along the membrane yet disassembled.95,98,102,103 Furthermore, there are cases showing the Z ring is composed of a single strand of protofilaments
arranged into the Z ring, while others show multiple filaments stacked several units wide arranged at the midpoint.97 Nonetheless, it is apparent that, on average, FtsZ monomers within the protofilaments are arranged ~7 nm apart and protofilaments are about 16 nm from the inner membrane of the cell and typically extend to 100 nm.95,103,104
In fusing cSeNP to FtsZ, we expect to observe filaments decorated with SeNPs as depicted in Figure 3.2. From the studies mentioned, we anticipate that these particles will be closely packed and will traverse the membrane of the cell at the midpoint. We expect that this extensive crowding will cause SeNPs to remain quite small (ca. < 7 nm). Importantly, since we will be using an IPTG inducible T5 expression system, we expect to overproduce the cSeNP-FtsZ chimera within the cell. As mentioned above, affecting the delicate balance of division
Figure 3.1: Cartoon representation of how FtsZ migrates toward the midpoint of the cell curing binary fission. Reproduced from Lutkenhaus 2007 with the permission of Annual Reviews.
proteins can disrupt Z ring formation and cause cells to become extremely elongated (on the range of 20 – 30 µm compared with the normal phenotype ca. 3 – 5 µm).29,105 Therefore, in addition to Z rings, we expect to see much larger cells with segments of helical protofilaments forming wave-like patterns along the membrane.95
Results and Discussion
The cSeNP-FtsZ chimera was fused using (EAAAK)2 as the linker. The construct was inserted into a pD441-CH expression vector and transfected via heat shock into BL21 (DE3) competent E. coli and grown in petri dishes on antibiotic-containing solid LB medium. After growth, several stabs of cells were taken and grown up again to confluency in liquid LB containing antibiotics. Cultures were then taken and stored as glycerol stocks until needed. Details of culture growth and storage can be found in Appendix B.
Two cSeNP-FtsZ constructs were made by labeling either the C-terminal end or the N-terminal end of FtsZ. As noted previously, both termini play important roles in the function of FtsZ. Also, it has been observed that constructs made with GFP were not always functional. Thus, it was necessary to label both ends since we could not be sure that by tagging one end we would not disrupt the function of FtsZ.
For in vivo induction experiments, beginning with the construct where cSeNP is fused to the C-terminal end of FtsZ (FtsZ-cSeNP), we set our parameters based on previous studies of FtsZ as well as on SeNP formation. As was seen in Chapter 2, because cSeNP is able to synthesize SeNPs within 30 minutes (see Appendix A Figure A.4), we ensured that IPTG expression was initiated for at least 30 minutes. As a visual confirmation, once the cells are pelleted, a color change from yellow to red is observed in the culture. On the other hand, because we do not want to perturb the function of FtsZ with an excessively large SeNP, our ideal particle growth would be 5 nm. To
this end, cultures may not appear as vibrant red as was observed in the original studies where particles averaged ca. 80 nm.57
Several factors were tested towards optimizing chimera expression and nanoparticle formation (i.e. the “Goldilocks” parameters). Initially, we screened induction times and temperatures that would produce the most division points within cells analyzed with SEM. Times from 5 minutes up to 16 hours were tested. When these screens were performed at 37 °C, it was difficult to isolate cells during binary fission across all times tested. We attributed this to rapid cell growth and dropped the temperature to 28 – 30 °C to slow that growth rate. When this change was made, we easily isolated dividing cells during log phase growth.
Next, an induction screen was done to determine the optimal IPTG concentration that would allow us to isolate both protofilaments and Z-rings. As had been noted, overexpression of FtsZ can disrupt proper cell duplication due to the imbalance of division proteins. This results in an abundance of protofilaments running throughout the cells in wave-like patterns. To control FtsZ expression, 1 mM, 100 µM, and 10 µM IPTG inductions were performed for 1 hour in the presence of 1 – 2 mM SeO32- (1 mM was used for the 10 µM IPTG sample to avoid metal stress) during log phase growth. Both 1 mM and 100 µM IPTG expression produced cells with noticeable contrast in SEM that was distinct from control samples, whereas the 10 µM IPTG sample likely did not produce enough of the chimera to observe obvious contrast in regions where we expected (Appendix B Figure B.2). Comparing the 100 µM sample with the 1 mM sample, we observe a difference in FtsZ expression level by the morphology of the cells. The 100 µM sample results in a moderate expression level of the chimera, where cells are elongated up to 10 µm but not excessively extended to 20 – 30 µm as is shown previously with FtsZ overexpression.29,105,106 These hyper-extended cells are indeed present in the 1 mM IPTG high expression level sample,
where we also see long filamentous structures with high contrast running throughout the cell (see Appendix B Figure B.3).
Next, we tested optimal selenite concentrations that would produce the most contrast in an electron micrograph while maintaining cell viability. Shown in Figure 3.3 are S(T)EMb data of samples overexpressing the chimera in the presence of 250 µM, 1 mM, and 2 mM SeO32-. As a control, we grew one sample with no SeO32- present shown in Figure 3.3A. Bacteria in the presence of greater than 2 mM SeO32- began to appear stressed, and thus the concentration of selenite used for subsequent protocols did not exceed 2 mM (See Appendix B Figure B.4).
From Figure 3.3, we see that by incrementally increasing the concentration SeO32-, there is a gradual increase in the contrast observed at the pinch point of the cell. Most notable is the sample
b A note on S(T)EM and (S)TEM acronyms. In the text, when S(T)EM appears, it represents data collected on a JEOL
JSM-650 FE-SEM in scanning transmission mode. The resolution of EDS data collected from this microscope is low with respect to the size of the sample (0.5 µm resolution at best). (S)TEM signifies that the data was collected on a JEOL JEM2100F TEM in scanning transmission mode. Resolution of EDS data collected on this microscope is greatly improved (theoretically, the resolution would be the size of the spot probe, though electron scattering and sample motion reduce this).
Figure 3.3: Selenite concentration screen. (A) Control incubated with no SeO32- (B) sample incubated with 250 µM SeO32- (C) sample
incubated with 1 mM SeO32- and (D) sample incubated with 2 mM
incubated with 2 mM SeO32-, in which cells appear healthy with distinctive contrast not seen in the control sample. Combining these results, we deciphered the “Goldilocks” parameters, in which incubating the samples with 100 µM IPTG and 2 mM SeO32- for 30 – 180 minutes at 30 °C produced optimal growth and contrast within samples. The optimization parameters that were tested are summarized in Table 3.1.
Table 3.1: Parameters for the optimization of FtsZ expression and nanoparticle formation.
To confirm that the observed contrast was due to Se, we used Energy Dispersive X-Ray Spectroscopy (EDS). Even though the resolution of SEM-EDS is about 500 nm, which is much larger than the average pinch point (about 200 nm), we only looked for an indication that Se was present in the sample. Using micromolar amounts of Se seemed to be insufficient to generate a signal using EDS. By mapping the samples that had been incubated with 2 mM Se in S(T)EM-EDS, we were able to observe a Se gradient (data not shown). We moved this sample to (S)TEM-EDS, and the elemental overlay map is shown in Figure 3.4. The EDS spectrum shows a small amount of Se present by observing the K line close to 11.2 keV (see Appendix B Figure B.5). The individual elemental maps are shown in Appendix B Figure B.5. It is clear that a localized concentration of Se is present at the division point of the cell as we expect. Along with the obvious
[IPTG] (µM) Induction Time (min) Temperature (°C) [SeO32-] (µM)
10 5 37 1 100 30 28 – 30 10 250 45 22 – 25 100 500 90 1000 1000 135 1500 180 2000 240 2500 300 3000 360 4000 5000
points of contrast observed in EM images, using EDS we were able to conclude that the tag was retaining Se and was associated with FtsZ at the expected locations.
Noticeably, while samples incubated with higher concentrations of SeO32- would exhibit
high contrast areas at locations we expect, the particles were indistinct. Thus, a “Red Sonja” protocol favoring the growth of large SeNPs was conducted to ensure particle formation in vivo. In the presence of 1 mM SeO32- and 100 µM IPTG, cells were induced for 3, 4, 5, and 6 hours seen in Figure 3.5. From this experiment, obvious particle formation was not observed until hour 5, and importantly, the formation of particles was inconsistent as seen in Figure 3.5D, where particles are quite punctate in the center cell but indistinct in the surrounding cells. It is possible that the inconsistency in particle formation was due to the extended induction time, as previous experiments have shown that FtsZ begins to degrade after 3 hours. However, from Figure 3.5A we do not notice large, punctate particles as we expect given the time allowed for particle formation.
Figure 3.4: (S)TEM-EDS analysis of an in vivo sample prepared with 100 µM IPTG and 2 mM SeO32-. Maps: yellow indicates
We mentioned that GRLMR is the fastest Se-reducing enzyme in the world, and in our studies confirmed that the recombinant variant can form 40 nm particles in 30 minutes, which indicates that we should be forming SeNPs under these conditions. Of note, it has been observed in literature that FtsZ-GFP fusions labeled from the C-terminus are not fully functional in vivo, which could be due to the inability of FtsZ to properly tether to the membrane.95 Thus, if FtsZ is not properly functioning, the degraded protein could also cause hinder the function of cSeNP and formation of SeNPs.
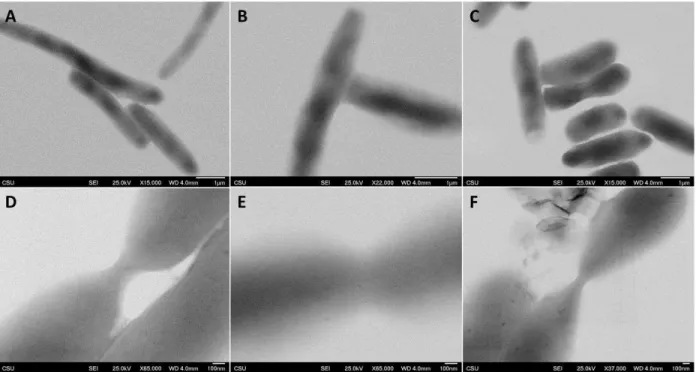
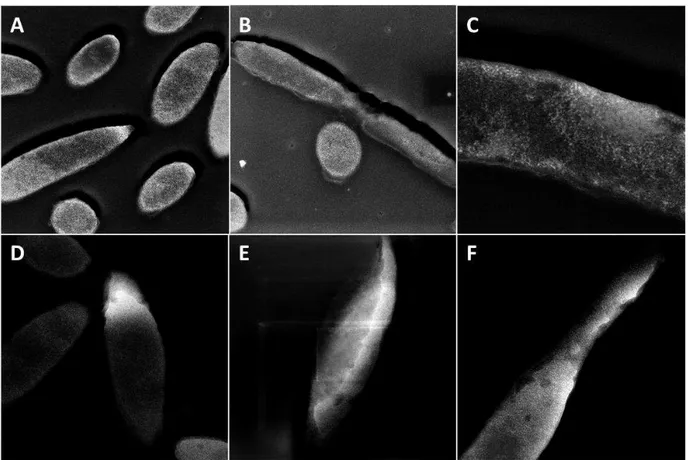
To improve the activity of the chimera, we moved the cSeNP from the C-terminus to the N-terminus of FtsZ (cSeNP-FtsZ). Experiments were repeated by inducing cultures with 1 mM IPTG and 2 mM SeO32- for 1 and 2 hours and are shown in Figure 3.6. The control sample does not contain any SeO32- and is shown in Figure 3.6A and 3.6D, in which we see no distinct particle formation. One sample was incubated with SeO32- for 1 hour as seen in Figure 3.6B and 3.6E, in which we begin to see small particles forming throughout the cell and also at the pinch points. In
Figure 3.5: Extended induction in 1 mM SeO32- and 100 µM IPTG
the sample marinated with SeO32- for 2 hours, particles become much more distinct as illustrated in Figure 3.6C and 3.6F.
Elemental analysis was done using (S)TEM on a sample induced in the presence of 1 mM SeO32- and 100 µM IPTG for 1 hour, where both large internal particles and pinch points were analyzed. We confirmed that both maps contained Se as is shown in Appendix B Figure B.7.
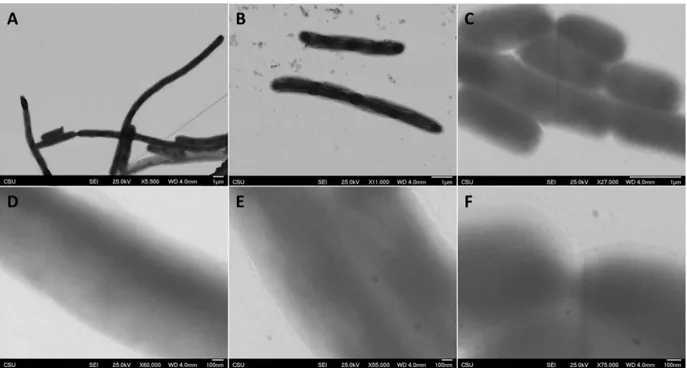
Inspired that the chimera was now functional, an additional experiment was conducted to test whether expressing the chimera for an extended period of time before adding SeO32- would have a significant impact on particle formation. To test this, cells were grown in 10 µM IPTG and 1 µM SeO32- overnight for low expression of the chimera. Following, a ramp up was done where either 250 µM or 100 µM IPTG and 2 mM SeO32- (none for the control) were added to cultures for approximately 2 hours. The two different concentrations of IPTG represent two distinct levels of expression as was tested previously.106 High expression level is shown in Figure 3.7A (control) and 3.7B, where cells are elongated and extremely filamentous determined by apparent cell
Figure 3.6: N-Terminal construct induction. (A&D) control (B&E) sample incubated with selenite for 1 hour (C&F) sample incubated with selenite for 2 hours.
thickness. In Figure 3.7C, cells are also elongated but are not as filamentous, as is deducted by the lower level of contrast throughout the cell and at specific points where cleavage furrows seem to be forming.
Shown in Figure 3.7D-F are higher magnification images of the high express control (D), the high express sample (E), and the low express sample (F). In the control, it is possible that ultrasmall SeNPs are being formed, since it was necessary to supplement the medium with 1 µM SeO32- to avoid cell death due to the prolonged expression period. Nonetheless, there is far less contrast in the control compared with the high express sample incubated with 2 mM SeO32-. As is apparent in Figure 3.7E, obvious SeNP formation is observed along the edge of the membrane and also along the filaments as expected. Finally, in the low expression sample, the particles are much more distinct along the membrane and at the division points within the cell (Figure 3.7F).
Figure 3.7: Extended expression experiment. Low magnification images of the control (A), the sample induced with 100 µM IPTG (B), and the sample induced with 250 µM IPTG (C) are shown in the top row. Higher magnification images of the control (D), the sample induced with 100 µM IPTG (E), and the sample induced with 250 µM IPTG (F) are shown in the bottom row.
While the extended expression greatly affects the number and length of filaments within the cell, it is unclear whether or not there is a significant impact on particle formation. In both Figure 3.6 and 3.7 we observe punctate particles in areas that we expect. Thus, we determined that either method could be used for the next phase of the project, which ultimately entailed generating tomograms of particle-aligned filaments. Accomplishing this required that we slice open the bacteria to better resolve the particles within. Because the cells are 500 – 800 nm thick, even at our maximum available accelerating voltage of 200 kV, the electron beam cannot transmit completely through the sample. Therefore, we must prepare the cells in resin that can be cured into plastic blocks. This process involves a serial dehydration, normally done in acetone, followed by infiltration in resin and curing under low heat (37 – 60 °C) over a 1 – 10 day period depending on conditions. Experimental details can be found in Appendix B.
We prepared samples induced with 100 µM IPTG and 2 mM SeO32- for 2 hours. After the induction period, we performed a high-pressure freeze followed by freeze-substitution into a glutaraldehyde/acetone cocktail for simultaneous fixation and dehydration. After dehydration, the sample was infiltrated using an epoxy-based resin followed by a low temperature cure. The results from this experiment are shown in Figure 3.8. The overview of the sample is given in panel A, where we see a typical view of the sample in light grey along with a few odd cells appearing as dark grey entities. During sample processing, it is possible for some cytoplasmic bodies to pop out of their cellular membranes, resulting in smaller anomalies appearing on top of the sections that have not been exposed to acetone or glutaraldehyde. Viewing Figure 3.8B and 3.8C, it is clear that in the normal cell bodies, there do not appear to be punctate SeNPs like we saw previously in Figures 3.6 and 3.7. However, upon inspection of the cytoplasmic bodies shown in Figure 3.8D and 3.8E, we do observe ~5nm particles running throughout the entity. SEM-EDS was done on
the cytoplasmic bodies, as one is boxed in white shown in Figure 3.9. Looking at the elemental maps, these anomalies are Se rich and P poor, which further supports that these bodies are cells that contain SeNPs and that have popped out of their membranes.
Comparing the samples prepared using high pressure freeze-substitution (HPFS) and embedment versus chemically fixed samples, it is clear that somewhere downstream during sample processing, the SeNPs are degrading. We suspected that acetone could be causing this degradation, since this solvent was not present during the initial whole cell experiments. To test the stability of SeNPs in acetone, a dissolution study was performed, mimicking a typical freeze substitution temperature ramp. SeNPs were synthesized via a borohydride reduction method as described in
Figure 3.8: (A) Low magnification overview of the sample. (B) higher magnification view of a midpoint where we expect FtsZ to localize. (C) The pinch point of a cell is in full view where FtsZ is expected to localize. (D&E) Images of cytoplasmic bodies. (F) A particle distribution graph of a small sample of particles (n = 70) observed in the cytoplasmic bodies.
and immediately placed in a -80 °C freezer for 5 days. At this temperature, particles remained stable and unchanged. Once the particles were brought back up to room temperature, they dissolved in acetone within 1 – 2 hours as denoted by a color change from red to colorless.
To understand why the particles are dissolving, we need to understand their structure. Amorphous SeNPs are composed of polymeric Sen chains and Se8 rings that pack together via van der Waals forces, and the charge state of Se atoms within these polymeric chains is either 0, -1, or -2.94,107,108 Se0, the predominant species, is insoluble in water, which is likely attributed to the dominating forces in water being dipole-dipole interactions.76,107 If the water is removed from the system and replaced with a nonpolar solvent like acetone, the dominant forces become dispersive. As acetone intercalates into SeNPs, polymeric Se subunits experience these dispersive interactions and slowly dissolve into the acetone. At low temperatures, it is possible that polymeric Se packs more tightly together, negating the diffusion of acetone into the particles. However, it is clear that once a certain temperature is reached, the space between Se subunits is great enough for acetone to again intercalate into the particles.
Figure 3.9: SEM-EDS analysis of cytoplasmic bodies boxed in white. Elemental mapping shows that the bodies are Se rich and P poor, indicating that these bodies have popped out of their membranes and contain SeNPs.
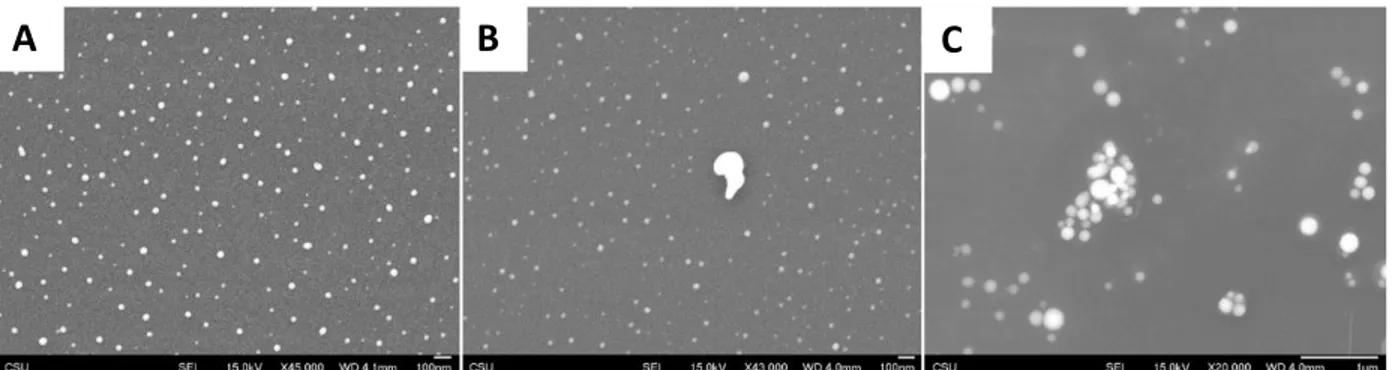
To observe this dissolution, an experiment was done to test the degradation of the SeNP surface when exposed to acetone for 5 minutes and 20 minutes. Shown in Figure 3.10, when comparing SeNPs that have not been exposed to acetone (Figure 3.10A) versus those that have been exposed for 5 minutes (Figure 3.10B), the acetone-exposed particles appear to contain much less mass as is obviated by the lesser contrast. When further comparing the SeNPs exposed to acetone for 5 minutes versus 20 minutes (Figure 3.10C), we see that particles begin to aggregate and grow, as it seems at this point most of the smaller particles have either dissolved or fused into larger particles following an Otswald ripening mechanism. We suspect that eventually these larger particles will also dissolve in accordance with the visual observations noted previously.
Subsequently, it was necessary to modify the preservation procedure to avoid SeNP dissolution. Ethanol is another common solvent used in embedment procedures; however, it is not miscible with the epoxy-based resin use in this study. Instead, a transition solvent that is miscible with the resin must be used following dehydration. Thus, we repeated the induction experiments above by adding 1 mM IPTG and 1 mM SeO32- to cultures (1 µM SeO32- to the control) for 3 hours. For preservation, we replaced acetone with ethanol for dehydration and propylene oxide was used as a transition fluid to resin followed by curing.
Figure 3.10: Acetone dissolution trials. (A) SeNPs before exposure to acetone, (B) SeNPs exposed to acetone for 5 minutes, and (C) SeNPs exposed to acetone for 20 minutes.
Results are shown in Figure 3.11, in which the top row depicts the control sample, and the bottom row shows the sample incubated with 1 mM SeO32-. Upon inspection it is clear that there are not punctate particles. However, as is apparent in the bottom row, long filamentous structures seem to be highlighted compared to the control. We suspect this is a form of Se that has been transformed from a particle structure to something that resembles a localized metal stain. To confirm that the contrast was due to some form of Se, (S)TEM-EDS was done on one of the high contrast cells as is shown in Figure 3.12. From the data, Se is in fact present within the high contrast
region of the cell. From this we hypothesize that SeNPs are still degrading, albeit more slowly, despite switching from acetone to an ethanol/propylene oxide solvent system. We believe at this point the propylene oxide is causing the more significant dissolution of particles. Therefore, we
Figure 3.11: Results from the modified embedment procedure using propylene oxide as a transition solvent. (A-C) Images of the control and (D-F) images of the sample incubated with 1 mM selenite are shown.
modified the infiltration step by omitting the propylene oxide transition fluid, despite the immiscibility of the resin in ethanol.
The importance of the transition solvent is to ensure proper infiltration of the resin. This usually occurs with 3 changes of a gradual dilution of the transition fluid into complete resin over the course of 3 – 6 hours depending on the sample. By omitting this solvent, we must greatly increase the amount of time the sample spends in the exchange from ethanol to complete resin to ensure proper infiltration. Thus, the sample is taken from 100% ethanol to a 1:1 mixture of 100% ethanol to uncatalyzed resin, in which the ethanol is allowed to slowly evaporate off over the course of 16 – 18 hours followed by an additional 4 – 8 hours in uncatalyzed resin before moving the sample into complete (catalyzed) resin. In sum, we turn a 3 hour step into a 20 hour step
by omitting the transition solvent.
The sample was made using the method described above. In this instance, propylene oxide was omitted from the embedment process and the results are shown in Figure 3.13. It does appear that by omitting the transition solvent we are able to preserve the larger SeNPs being formed as can be seen in the images. Notably, there do not appear to be many particles in the 5 nm regime.
Figure 3.12: Image from the sample incubated with 1 mM selenite. The inset is a higher magnification view of the high contrast area, with the contrast a brightness greatly decreased to avoid saturation. To the right is an X-ray spectrum of the area boxed in red of the inset image.
versus discrete particles. It is possible that the now metal stain once was composed of many ultrasmall particles (5 nm or less in diameter) but has since somehow degraded into the contrast seen. Additionally, to confirm that the larger particles are composed of Se, EDS was employed on the cluster boxed in white as shown in the example in Figure 3.13D along with the spectrum shown. A trace amount of Se is observed, and the Se elemental map is shown in the inset of the spectrum. It is possible that these small particles are degrading in ethanol during the greatly extended time required by the modified procedure to ensure proper resin infiltration.
On the other hand, it has been shown previously that the surface of amorphous SeNPs can “soften” above 40 or 50 °C.109 This is shown in Figure 3.14, reproduced from Jeong et al. (2005).109 In Figure 3.14A are 300 nm SeNPs and in panel B are the same particles that have been annealed at 40 °C for several hours. Over time it appears that the particles have begun to fuse together as
Figure 3.13: Images of the sample incubated with 1 mM seleniite preserved using an ethanol only embedment protocol (A-D). Also shown is an X-ray spectrum and the Se elemental map of the white boxed area shown in D.
seen by the necks forming between the particles. Therefore, looking back at Figure 3.13C, it could also be possible that curing, which occurs at 60 °C for 16 hours, is causing the ultrasmall SeNPs that are packed closely together to slowly “soften” and fuse. However, it is unclear how the presence of the resin would affect the fusing of particles, and it is uncertain whether it is actually the elevated temperature that is causing the appearance of hazy structures or if ethanol is promoting a slow dissolution of particles.
Thus, we repeated the sample preparation from before and employed a lower temperature cure (42 – 45 °C over 3 days). The results of this experiment are shown in Figure 3.15. In both cases, we begin to make out ultrasmall, ~2 nm particles arranging into the wave-like patterns that we expect. However, the particles are not very distinct against the background of the cell. This could be due to the thickness of the section, which is 100 nm in A and 50 nm in B. The particles do appear a bit brighter in the 50 nm slice. However, in both cases still the particles are not as
Figure 3.14: (A) SeNPs before thermal annealing and (B) SeNPs after annealing at 40 °C for several hours. Reproduced with permission from Jeong et al. (2005) and Advanced Materials of Wiley Publishing.
obvious as is desired since when viewing the sample at low magnification, the particles are not apparent.
In sum, through an exhaustive optimization of induction parameters, particle formation parameters, and preservation trials, we only seem to be able to distinguish either ultrasmall, 2 nm particles running throughout the cell or much larger, ca. 20 nm particles. It is likely that the 20 nm particles are too large and hinder the function of FtsZ, preventing it from polymerizing with other FtsZ monomers and possibly from tethering to the membrane. This could explain why when larger particles are observed, at times they are not surrounded by other particles. Nevertheless, it is apparent that traditional cellular preservation methods are not suitable for amorphous SeNP preservation. Therefore, we must find alternative ways of protecting SeNPs from the processing liquids used therein.
Outlook
The ultrasmall particles would indeed meet the size criteria to allow FtsZ to function normally, and it may well be that if a tilt series is collected, they would be much more
Figure 3.15: Sample preparation cured at a lower temperature (42 – 45 °C) for 3 days. (A) Circled in yellow are what appear to be ultrasmall particles from a 100 nm semi-thin section. (B) Boxed in white are other ultrasmall particles, blown up in the inset, from a 50 nm thin section.
distinguishable. In this case, it would be worthwhile to collect tomograms of this sample. On the other hand, if the ethanol is dissolving some (but not all) of the particles, the tomograms might reveal incomplete evidence for FtsZ filamentation. Therefore, it is crucial to repeat the experiments done to date with nanoparticles that will not dissolve in the processing medium.
CHAPTER 4: Stabilization of Amorphous SeNPs via Disproportionation into MSeNPs Introduction
From the studies detailed in Chapter 3 and from previous reports, it is clear that amorphous SeNPs are quasi-stable particles that will either degrade or convert to the stable trigonal phase over time.107 In continuation of developing a clonable nanoparticle tag, it is important to ensure that the particles will remain intact throughout the duration of the experiment. We are left with two options: either 1) we post-synthetically crystallize the amorphous Se into trigonal Se or 2) we synthesize a metal selenide material in situ.
Pursuing option 1 is not ideal, since typical crystallization protocols require temperatures that would destroy biological materials.110,111 Thus we are left with option 2: to synthesize a metal selenide nanoparticle rather than amorphous SeNPs. In previous work, we have shown that GRLMR is able to reduce Se4+ all the way down to the 2- state before being swiftly oxidized to zerovalent Se, which allowed us to nucleate Se2- with Cd2+ to form CdSe quantum dots in vitro.112 When transferring this reaction in vivo, Se2- species are quickly oxidized by other small molecules such as O2 and glutathione, which greatly impedes the rate of the reaction (30 minutes in vitro versus 16 hours in vivo), and the required redox state for spontaneous Cd2+/Se2- nucleation is lost. What also may affect QD formation is the effect of dual metal stress. In higher organisms, it has been observed that increased concentrations of certain trace elements affects the uptake of other metals.113 Thus, the simultaneous addition of Cd2+ to the culture medium could hinder the uptake of SeO32- in vivo and vice versa.
Another approach could be to post-synthetically transform GRLMR-produced SeNPs into metal selenide (MSe) NPs under mild conditions. In reviewing traditional MSeNP syntheses, and in particular CdSe, ZnSe, and Ag2Se, most rely on either a co-reduction approach in organic
solvents at relatively high temperatures or laser ablation (>100 °C).114–118 There have been few reports that use trigonal SeNWs as templates for transformation into a shelled SeNW@MSe, and in the case of Ag this reaction is possible at room temperature.119–124 While this approach is mild, Ag can be difficult, yet not impossible, to work with in a biological setting. It can precipitate with either Cl or inorganic P, and it is easily reduced with GSH.125 Consequently, it is appealing to synthesize MSe particles from metals that are more biologically relevant.
What has not been extensively explored is reactions that use amorphous SeNPs (a-SeNP) as precursors in an aqueous medium. It is known that a-Se is composed of Se8 rings and Sen chains in an intraparticle quasi-equilibrium of one and two electron propagation causing constant breakage and reformation of Se-Se bonds.85,126 The instability of a-Se results in the eventual rearrangement of the amorphous allotrope to either a trigonal or monoclinic crystalline phase. To this extent, we hypothesized that it is possible to post-synthetically modify a-SeNPs by forming either a metal selenide (MSe) shell or nanoparticle using metals that tend to crystallize with Se through a disproportionation-type reaction. The proposed chemical equation is as follows:
Results and Discussion
As our end goal is biological imaging, we focused these experiments on synthesizing fluorescent ZnSe and CdSe particles that could potentially be used for Correlative Light and Electron Microscopic (CLEM) imaging. We took particular interest in Zn, as it is far less toxic
described in Appendix A.127 The growth of a-SeNPs was observed using UV/Vis spectroscopy. We see that about 30 seconds after we add borohydride to selenite, we start to form a-SeNPs (Appendix C Figure C.2).
After SeNP formation (2 – 5 minutes), various metal salts were added to the particle solution. The molar ratio of the metal precursors varied from 1:1, 1:2, 1:4, 1:10, and 1:100 of SeO32-:Mn+. With most metals, a 1:10 ratio was used except in the cases of Zn and Cd where a 1:100 ratio was used and Ag where only a 1:2 ratio was needed. Experimental details can be found in Appendix C, and the empirical results are shown in Table 4.1.
Table 4.1: Metal disproportionation trials. The ratios of precursors used are specified above and in Appendix C.
Precursor Observation
a-SeNP + Pb(OAc)2 Black precipitate
a-SeNP + CoCl2 Black precipitate
a-SeNP + Ce(SO4)2 Pink/red particles
a-SeNP + Na2WO4 no change
a-SeNP + CuCl2 Black precipitate w/ metallic blue luster
a-SeNP + Sb-tartrate Grey precipitate
a-SeNP + AgNO3 Black precipitate
a-SeNP + Cd(OAc)2 Orange fluorescent particles
a-SeNP + Zn(OAc)2 Orange/yellow fluorescent particles
a-SeNP + KMnO4 Brown particles
The transformation of a-SeNPs was also observed initially using UV/Vis spectroscopy. Because ZnSe and CdSe particles will crash out of solution upon conversion, we can continue to monitor absorbance at 375 nm over time (see Appendix C Figure C.2). We allow SeNPs to grow for 5 minutes before adding either Zn(OAc)2 or Cd(OAc)2 in a 100:1 molar ratio of Zn/Cd:Se. In