Applying subsurface drainage and windbreaks to control dryland salinity
H. Steppuhn1Semiarid Prairie Agricultural Research Centre, Agriculture & Agri-Food Canada, Swift Current, Saskatchewan, Canada
Abstract. The reclamation of salinized soil involves lowering ground water levels, draining the
vadose zone, and leaching the salts from the root zone. Plastic drain tubing placed 1.5 to 1.8 m below the land surface can lower watertables and drain phreatic water, but irrigation is usually required to leach the offending salts. The leaching process in non-irrigated drylands depends on natural precipitation. Rows of tall wheatgrass, Thinopyrum ponticum (Podp.) Lui & Wang, (1.2 m mean height) spaced on 15.2-m centers across saline fields can retain blowing snow, augment water for leaching salts, and moderate evapotranspiration when grown in conjunction with subsurface drainage. The mean salinity of saturated soil paste extracts from sets of soil samples taken every fall from such a site in southwestern Saskatchewan averaged 14.1 dS m−1 during
1985-90 before the drainage was installed, 13.0 dS m−1 for 1991-92 after drainage but before the grass
windbreaks became established, and 9.6 dS m−1 for 1993-98 with both drainage and windbreaks in
place.
1. Introduction
Salinity has plagued agriculture in arid and semiarid climates for thousands of years. Whenever near-surface waters containing dissolved salts encounter drainage impediments in soils, subsoils, or parent materials, a possibility exists for the concentrations of the solutes to increase. In very arid lands, salinization stems mostly from the distribution and collection of irrigated waters in amounts incompatible with the water-holding and drainage capacities of the soils. In semiarid regions, such as found across western North America, salinity also results from the convergence of natural waters.
The geologic sediments underlying the Great Plains and Canadian Prairies are typical of subsurface media in arid and semiarid climates in that they contribute solutes (mostly sulfates, chlorides, and carbonates) to the waters which move through them (Nielsen 1973). When these soil and ground waters approach or intersect land surfaces,
evapotranspiration causes the solutes to concentrate and enrich root-zone solutions. Soil salinization will result unless countered by processes in which natural or irrigated waters dissolve and leach the excess salts out of the root zone (U.S. Salinity Lab. Staff 1954; Steppuhn 2006).
The installation of subsurface drainage systems is one method recommended for lowering watertables, removing dissolved salts, and reducing salinization by purging excess water from root and vadose zones (Rhoades 1974; Beke et al. 1993). Subsurface drainage on irrigated lands usually lowers watertables and reduces soil salinity (Rapp 1968). Tests in semiarid climates where subsurface drains are installed, but the land not
1 Research Scientist, Semiarid Prairie Agricultural Research Centre, Agriculture & Agri-Food Canada ,P.O. Box 1030,
Swift Current, SK S9H 3X2, Canada Tel.(306)778-7243 Email: steppuhnh@agr.gc.ca
irrigated, give mixed results. Initially, drainage lowers watertables but not salinity (Buckland and Hendry 1992). However, at some sites, drainage systems placed in non-irrigated, saline soils have, after many years, lowered the electrical conductivity of soil solutions in the top 0.3 m of soil (Vander Pluym et al. 1985).
Black and Siddoway (1971) suggest that rows of tall wheatgrass, (Thinopyrum ponticum (Podp.) Lui & Wang), offer an alternative to tree and shrub windbreaks
commonly planted throughout the Great Plains and Canadian Prairies. Tall wheatgrass, a salt-tolerant perennial bunchgrass, typically develops seed culms averaging 1.2 m tall when placed in double-row wind-barriers spaced on 15.2-m centres across fields producing dryland crops. Research has shown that this grass shelterbelt system reduces ground windspeeds, controls soil erosion, deepens snowcovers, extends the geographic range of overwintering crops, conserves water, increases or stabilizes grain production, and minimizes the need for summerfallow (Aase and Siddoway 1974; Black and Aase 1986; Steppuhn and Nicholaichuk 1986). The soil water enrichments resulting from windbreaks are attributed to greater snow catch in the shelter than in the open field and to reductions in evapotranspiration of the wind-sheltered crop (Siddoway 1970).
The objectives of the study described here were: (1) to lower watertable levels, (2) to enhance snowcover for greater leaching of salts from the saline soil, (3) to reduce root-zone salinity, and (4) to increase agricultural production in a cold, semiarid climate using a combined subsurface drainage system and tall wheatgrass windbreaks to augment natural precipitation and reduce evapotranspiration.
Approximately 100 million years ago, oceans covered all of the Great Plains and Canadian Prairies (Nielsen 1973). These ancient seas left saline marine deposits which provide the salts contributing to today’s root-zone salinity found throughout the region (Miller et al. 1981). A series of non-marine sedimentary deposits followed these inland seas and, wherever not subsequently eroded, now cover the marine deposits. During the passing eons, the Rocky Mountains were born, and the land surface developed a generally decreasing slope toward Louisiana and Hudson’s Bay. Water moving down these slopes formed valleys through which the marine salts began moving back to the oceans. Within the last two million years, continental glaciers covered and scraped the more northern landscapes.
The marine deposits consist primarily of silt-stones, shales, and unconsolidated clays through which water passes very, very slowly. The subsequent non-marine deposits include coarser particles and generally transmit water and dissolved salts much more readily. The glacial deposits (mostly till) feature a mix of the marine and non-marine material across which the ice traveled. Consequently, water transmission rates through glacial tills vary from place to place and from layer to layer, leaving ample quantities of marine salts in today’s till deposits.
Spring on the North American plains and prairies brings increases in day length, temperature, snowmelt, and on average, yearly peaks in precipitation. At this time, more
wet subsurface environment, recharged yearly with snowmelt and early rains and occurring intermittently with dry periods, encourages salinization. When the accumulated ground water approaches or intersects land surfaces, evapotranspiration causes the solutes to concentrate in soil root zones. Soil salinization naturally results unless the process is countered by other natural processes or anthropological practices, such as irrigation, which dissolve, leach, and move the excess salts out of root zones (U.S. Salinity Laboratory Staff 1954).
2. Methods 2.1 Study Site
This study was conducted on a site located 3 km southwest of Swift Current,
Saskatchewan, (50.3o N, 107.8o W). The long-term mean annual precipitation equals 359 mm, with as much as one-third falling as snow. The growing season (May, June, July, August) precipitation and Class A pan evaporation averages 210 and 883 mm,
respectively, reflecting a semiarid climate. Winter-to-summer air temperatures range within -40 to +40 oC. Two parcels of severely salinized land, aligned north and south, characterize the site (Figure 1). The parcels, each about one hectare in area, form part of a slightly undulating plain sloping 3.4% to the southeast; a slight rise in topography
separates the two parcels.
The soil of the plain is mapped as a degraded, salinized Swinton silt loam (Ayres et al. 1985) and is classified a Saline Brown Chernozem (Salic Aridic Haploboroll in the U.S. nomenclature). The topsoil developed from a partially-eroded veneer of loess overlying glacial till. Cretaceous Bearpaw marine shale underlies the till at depths below land
surface ranging from 6 m along the west boundary of the saline parcels to 1.5 m on the east side. The texture of the till and subsoil changes from a silty loam with sand lenses on the west side to a loamy clay on the east side. The transition occurs along a line trending north-south transecting both parcels of saline soils. The shallower bedrock and textural discontinuity have created a “textural dam” behind which ground water accumulates and causes the root-zone salinity associated with both parcels.
2.2 Study Methods
Soil sampling in the two parcels began in 1985 followed by watertable measurements in 1987 after the observation wells were installed. A grid of ten soil sampling points and well locations west of the textural transition was established in each parcel (Figure 1). A 30-mm, perforated, plastic pipe surface-sealed within a hole augured just above bedrock at each location served as the observation well for weekly depth-to-watertable measurements. Every fall (October or November) from 1985 through 1996, a cylindrical core of soil, 50 mm in diameter, was removed from the upper 900 mm of the root zone within a 2 m radius of each sampling point. The core was sectioned into 150-mm depth increments, and the soil electrical conductivity of the saturated soil paste extract (soil-EC) was determined for each increment following Rhoades (1982).
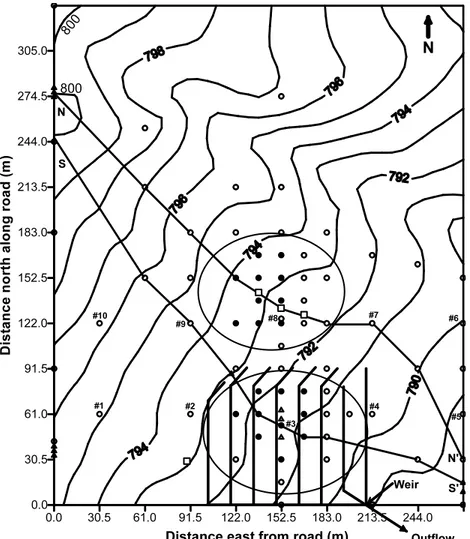
Figure 1. Topographic view of the study site near Swift Current, Saskatchewan
(50.3o N, 107.8o W) showing elevation contours in meters above sea level (1 m contour interval), South and North Parcels, subsurface drain lines, weir measurement station, outflow, observation wells (○), piezometers (△), backhoe sites (□), selected well and soil sampling locations (●).
In August and September of 1990, plastic drain-tubing covered with a polyester filter was buried on grade within 1.5 and 1.8 m of the surface of the South Parcel using a laser-controlled trencher; the North Parcel was left untreated. The drain system consisted of north-south oriented, 100-mm, louvred tubing spaced on 15.2-m centers feeding an east-west, non-perforated, 150-mm collector conduit (Figure 1). Where possible, drain lines were placed approximately 5 m west of the water wells and soil sampling points. In October, 1991, a dormant-season seeding of tall wheatgrass (variety: Orbit) was expected to form single rows located parallel and 3.8 m west of each drain line. Dry conditions during the following spring limited establishment of the wheatgrass. A second row about 150 mm adjacent the first was seeded in the spring of 1992. This resulted in effective windbreaks spaced 15.2 m apart across the South Parcel averaging 0.7 m in
The accumulated snowcover on each parcel was surveyed at about the time of peak accumulation each year beginning in January 1993, except in the snow-limited winter of 1998. Each survey included approximately 220 observations of snowcover depth and 35 measurements of the specific gravity from vertical snow cores taken across each parcel. After each survey, the observations were used to calculate the mean snowcover water equivalent for each parcel according to the method described by Steppuhn (1976). The mean depth-to-watertable and soil-EC values from the South Parcel obtained during the pre-treatment period (1985-1990) were regressed with those from the North Parcel using a linear model (SAS 1995). The regression statistics for watertable depths and for each sampled soil layer and three combinations of layers (0-450, 450-900 & 0-900 mm) provided comparisons for selecting the most reliable predictors. Predicted pre-treatment soil-EC values for the South Parcel from the selected regressions were analyzed covariantly with the measured values resulting in differences statistically evaluated with the pre-treatment-based least-significant-difference (LSD). Differences in measured post-treatment EC values for the parcels compared to the LSD allowed statistical inferences pertaining to the merits of the treatment.
During the study, Bonanza barley was seeded across the entire site every year. Each land parcel provided square-meter hand samples for grain yield comparisons before and after treatments. The samples were threshed, and the grain oven-dried and weighed.
3. Results and Discussion
The annual precipitation during the six pretreatment years exceeded the long-term mean (359 mm) in two years out of six in comparison to five out of the eight post-treatment years. Precipitation volumes averaged less before the drainage system was installed (316 mm) than after installation (412 mm).
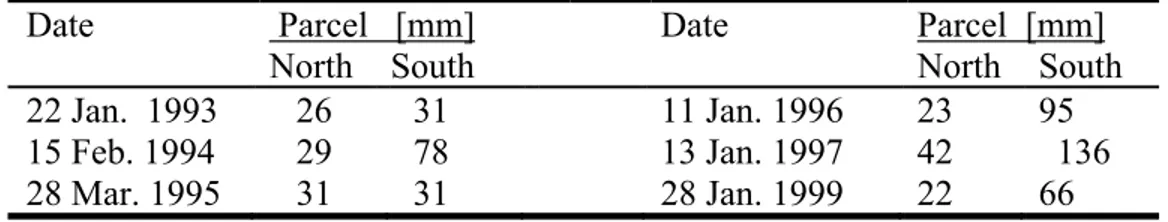
Once established, the tall wheatgrass windbreaks accumulated more snow on the wind-sheltered (South) parcel than collected across the open (North) parcel (Table 1). Over the six surveys (1993-99), the mean peak, areal water equivalent averaged 72.8 mm on the South Parcel and 25.5 mm on the North Parcel. But, the snowcover over the sheltered parcel was usually not uniform, accumulating in the usual wind-foil pattern behind the windbreaks.
Table 1. Mean snowcover water equivalents from surveys across saline land parcels
located near Swift Current, Saskatchewan.
Date Parcel [mm] Date Parcel [mm]
North South North South
22 Jan. 1993 26 31 11 Jan. 1996 23 95
15 Feb. 1994 29 78 13 Jan. 1997 42 136
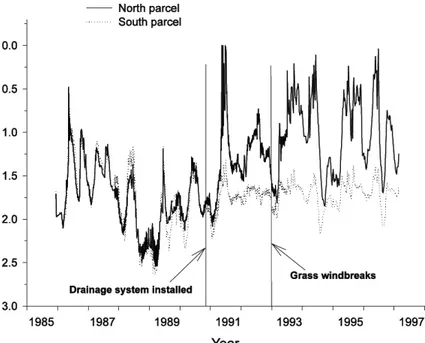
Surface-to-watertable measurements (n=559) taken at least weekly throughout the year during the pre-treatment period (1986-90) correlated closely between the two parcels (r2=0.887, se<0.006 m) and showed considerable variability within and between years (Figure 2). After the subsurface drainage system was installed in the South Parcel, but before the tall wheatgrass windbreaks became effective in 1993, the average depth-to-water (n=331) in the ten wells within each of the parcels equaled 1.744 and 1.298 m for the South and North, respectively. After the snow-trap grass windbreaks became effective (from 1993 through 1997), the South depths averaged 1.716 m and the North 1.070 m (n=261). The differences in the
measured and predicted (based on the North Parcel measurements) depths averaged across the South Parcel for the drainage only and the drainage plus windbreak treatment periods equaled 0.478 and 0.693 m (lsd(0.01): "0.038 and "0.056 m), respectively.
Figure 2. Average depths from ground surface to watertable with time for
the ten wells each in the North and South Parcels.
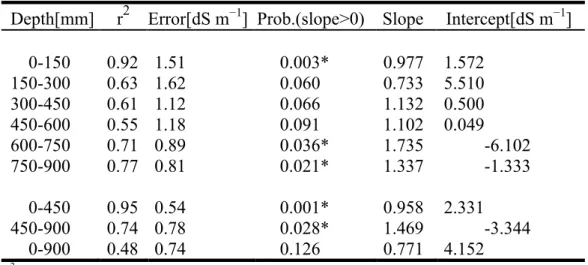
The soil-EC covariance between the North and South Parcels during the six pre-drainage years (1985-1990) showed significant correlation in the 0-150, 600-750 and 750-900 mm soil layers only (Table 2). Salts typically move with varying ease from layer to layer within a soil profile during periods of snowmelt infiltration. The results were combined into mean soil-EC values for the 0-450, 450-900, and 0-900 mm depth units. The 0-900 mm unit did not correlate well (r2 = 0.48), but the splits into the 0-450 and 450-900 mm units did (r2 = 0.95 and 0.74). The covariant linear regression slope for the 0-450 mm unit approached unity (0.958), and the intercept indicated that the South Parcel, on average, was more saline (by 2.3 dS m−1) than the North Parcel during the pre-treatment years.
Table 2. Parameters and statistics from linear regressions between the electrical
conductivities of saturated soil-paste extracts (soil-EC) from the South Parcel with those from the North averaged from ten soil cores per parcel sampled each fall during 1985-1990 (n = 6) and stratified by soil layers and depth
units to 900 mm. Depth[mm] r2 Error[dS m−1] Prob.(slope>0) Slope Intercept[dS m−1]
0-150 0.92 1.51 0.003* 0.977 1.572 150-300 0.63 1.62 0.060 0.733 5.510 300-450 0.61 1.12 0.066 1.132 0.500 450-600 0.55 1.18 0.091 1.102 0.049 600-750 0.71 0.89 0.036* 1.735 -6.102 750-900 0.77 0.81 0.021* 1.337 -1.333 0-450 0.95 0.54 0.001* 0.958 2.331 450-900 0.74 0.78 0.028* 1.469 -3.344 0-900 0.48 0.74 0.126 0.771 4.152 r2 = coefficient of determination Error = standard error of the regression
Prob.(slope>0) = error probability that the slope does not equal zero * The slope is significantly greater than zero at an "-error probability ≤0.05.
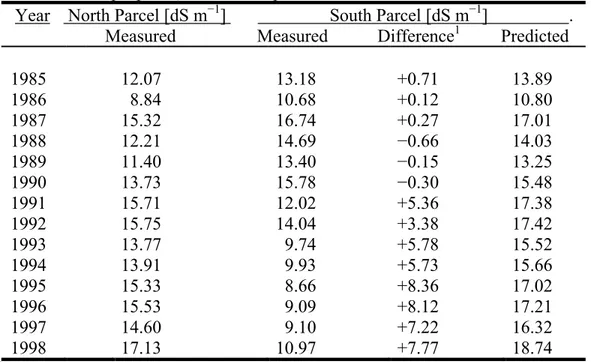
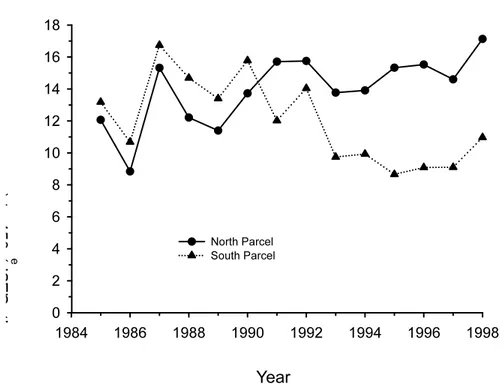
The least significant difference at a statistical "-error probability (p) less than 0.05 for predicting the 0-450 mm, fall-measured soil-EC in the South Parcel based on the North EC-measurements prior to drainage equaled "0.66 dS m−1 ("0.86 dS m−1 at p<0.01). This implies that, if all else is equal between the two parcels, results from imposing a subsurface drainage and concomitant grass windbreak system on the South Parcel could be evaluated in comparison to that parcel's predicted behavior based on its pre-treatment covariance with the North Parcel. Table 3 contains: the mean fall soil-EC values for the 0-450 mm depth unit by year; the measured North and South EC-values; and, the predicted South EC-values. The average post-treatment difference between the measured and predicted South soil-EC equaled 6.46 dS m−1 and exceeded the 0.86 dS m−1 LSD seven fold. These changes in mean measured EC-values with time after drainage are visually evident in Figure 3 for the 0-450 mm depth unit.
Barley grain, harvested from either parcel during 1984-1990 (before treatments), yielded 330 kg ha─1 or less per parcel. After installation of the subsurface drainage system, grain yields averaged 2413.6 (43.3) and 140.4 kg ha─1 (2.1 bushels per acre) from the South and North Parcels, respectively.
Table 3. South Parcel soil salinity (soil-EC) averaged from actual fall-season measurements
and from regression-predictions based on North Parcel measurements; ten soil
cores per parcel, 0-450 mm depth. Year North Parcel [dS m−1] South Parcel [dS m−1] .
Measured Measured Difference1 Predicted 1985 12.07 13.18 +0.71 13.89 1986 8.84 10.68 +0.12 10.80 1987 15.32 16.74 +0.27 17.01 1988 12.21 14.69 −0.66 14.03 1989 11.40 13.40 −0.15 13.25 1990 13.73 15.78 −0.30 15.48 1991 15.71 12.02 +5.36 17.38 1992 15.75 14.04 +3.38 17.42 1993 13.77 9.74 +5.78 15.52 1994 13.91 9.93 +5.73 15.66 1995 15.33 8.66 +8.36 17.02 1996 15.53 9.09 +8.12 17.21 1997 14.60 9.10 +7.22 16.32 1998 17.13 10.97 +7.77 18.74
1 The Difference equals the South predicted minus the South measured.
Based on the 1985-1990 regression, the least significant differences equal: "0.66 dS m−1 at p
"<0.05 and "0.86 dS m−1 at p
"<0.01.
4. Conclusions
This study has led to four inferences: (1) that snow management can increase the water available to leach salinized root zones, (2) that engineered subsurface drainage can lower watertable elevations, especially at the critical time just before spring seeding, (3) that a combination of subsurface drainage and grass windbreak technologies in semiarid, non-irrigated environments can result in a gradual reduction of salinity in the top 450 mm of soil, and (4) that the combined drainage-windbreak treatment can increase barley grain yields 20-fold. The windbreak system in our study covers a limited area of 1.1 ha. If this system, because of its size and upwind fetch, allowed extra measures of snow to
accumulate in it, a larger windbreak system may not prove as beneficial. Also, if the subsurface water volumes or their dissolved salt concentrations discharging from the drainage system are large, additional disposal techniques may be necessary.
Acknowledgements
This study was conducted on the Smith Brothers Farm. The author, on behalf of Agriculture and Agri-Food Canada, gratefully acknowledges and thanks Murray, Allan, Stuart, and Doug Smith for allowing the use of their land and their contributions to this study. Extra thanks and appreciation are also extended to Ken Wall, Ken Deobald, Don Sluth, Evan Powell, Darcy Schott, Tom Olfert, Gary Winkleman, Rod Ljunggren, and many other contributors at the Semiarid Prairie Agricultural Research Centre.
Figure 3. Average soil-EC to a depth of 450 mm for each year. The drain tubing in the South Parcel was installed during 1990. Soil samples were extracted in October or November of each year.
References
Aase, J.K. and Siddoway, F.H. 1974. Tall wheatgrass barriers and winter wheat response. Agric. Meteorology 13: 321-338.
Ayres, K.W., Acton, D.F and Ellis, J.G. 1985. The soils of the Swift Current map area 72J Saskatchewan. Sask. Institute Pedology, Extension Publ. 481, Extension Division, Univ. of Saskatchewan, 226 p., Saskatoon, SK.
Beke, G.J., Graham, D.P. and Entz, T. 1993. Effects of a subsurface interception drainage system on soil moisture regime in a saline-seep area. Canadian Agricultural Engineering 35(3): 175-181.
Black, A.L. and Siddoway, F.H. 1971. Tall wheatgrass barriers for soil erosion control and water conservation. J. Soil Water Cons. 26: 104-111.
Black, A.L. and Aase, J.K. 1986. Cropping system's dependence on snow management. Pages 461-475 in H. Steppuhn and W. Nicholaichuk, eds. Symposium proceedings: Snow
Management for Agriculture, Great Plains Agricultural Council Publ. No 120, Swift Current, SK.
Buckland, G.D. and Hendry, M.J. 1992. Buckland, G.D. and Hendry, M.J. 1992. Groundwater response and salt removal in a saline-seep soil in southern Alberta. Canadian Agricultural Engineering 34(2): 125-134.
Miller, M.R., Brown, P.L., Donovan, J.J., Bergatino, R.N., Sonderegger, J.L. and Schmidt, F.A. 1981. Saline seep development and control in the North American Great Plains - Hydrological aspects. Agric. Water Management 4: 115-141.
Nielsen, G.L. 1973. Geology and macro-ground water movement, saline lands, Alberta. Pages 16-40 in Proceedings Alberta Dryland Salinity Workshop, Soils Branch, Alberta Department of Agriculture, Lethbridge, AB.
Rapp, E. 1968. Performance of shallow subsurface drains in glacial till soils. Transactions American Society of Agricultural Engineering 11: 214-217.
Rhoades, J.D. 1974. Drainage for salinity control. Chap. 16, pages 433-461 in J. van
Schilfgaarde, ed. Drainage For Agriculture, Agronomy Monograph 17, American Society of Agronomy, Madison, WI.
Rhoades, J.D. 1982. Soluble salts. Pages 167-179 in A.L. Page, ed. Methods of Soil Analysis, Part 2: Chemical and Microbiological Properties, 2nd edition. American Soc. Agronomy, Soil Sci. Soc. of America, Madison, WI.
SAS Institute, Inc. 1995. JMP (Version 3.2.1) Statistical Discovery Software. SAS Statistical Analysis System Institute Inc., Cary, NC 27513, 593 pp.
Siddoway, F.H. 1970. Barriers for wind erosion control and water conservation. J. Soil Water Cons. 25(5): 180-184.
Steppuhn, H. 1976. Areal water equivalents for prairie snowcovers by centralized sampling. Pages 63-68 in Proceedings 44th Annual Meeting, Western Snow Conference, Calgary, AB.
Steppuhn, H. 2006. Combining subsurface drainage and windbreaks to control dryland salinity. Can. J. Soil Sci. 86: 555-563.
Steppuhn, H. and Nicholaichuk, W. 1986. Managing snow to extend the areal range of winter wheat production. Pages 30-40 in Proceedings 54th Annual Meeting, Western Snow Conference, Phoenix, AZ.
U.S. Salinity Laboratory Staff. 1954. Diagnosis and improvement of saline and alkali soils. (L.A. Richards editor), Agriculture Handbook 60, United States Department of Agriculture,
Washington, DC.
Vander Pluym, H.S.A., Livergood, C. and Healy, L. 1985. Development of agricultural subsurface design standards for Alberta. Final Report, Farming For The Future Project 83-2042, Alberta Agriculture, Lethbridge, AB.