Retention of the restaurants‟ customers
Authors: Iuliia Shcheglova© Sergii Shcheglov© Subject: Master Thesis in Business Administration 15 ECTS
Program: Master of International Management Gotland University Spring semester 2010 Supervisor: Ola Feurst
English title: ”Retention of the restaurants‟ customers” Swedish title: “Bibehållande av restaurangerna kunder” Authors: Iuliia Shcheglova and Sergii Shcheglov Institution: Gotland University
Completed: June 2010 Supervisor: Ola Feurst Abstract:
Aim of this paper is to describe and analyze why customers come back to the restaurants, what influence their decisions. During the research we formulate 2 hypotheses.
Hypotheses 1 – most reasons of the restaurants‟ customers retention can be associated with restaurants‟ service elements adapted from the 8Ps of Service Marketing Model.
Hypotheses 2 - retention and loyalty have unidirectional relation – loyalty means retention of the customer, but retained customer doesn‟t mean loyal.
The results of empirical research support both hypotheses. Also during the empirical research we have highlighted some interesting results which are visualized in Illustration 5.1, Illustration 5.2 and Illustration 5.3.
In research qualitative and quantitative approaches are used. Data collection method is interview. One deep interview was conducted with restaurant manager in order to enhance the quality of results interpretation.
The results of the research can be used by marketers especially in restaurant sphere in order to better understand what influence customers‟ behavior and why they come back to the service provider. Also restaurants‟ managers can use our findings as a tool to increase the retention rates by adjusting relevant restaurants‟ service elements within their restaurant.
3
TABLE OF CONTENTS
1. Introduction ... 1
1.1. Background and problem discussion... 1
1.2. Research question and aim ... 2
1.3. Disposition ... 3
2. Methodology ... 4
2.1. Limitations and critics ... 6
3. Theoretical background ... 8
3.1. Main perspectives on the retention of the customers problem ... 8
3.2. Other perspectives on the retention of the customers problem ... 12
4. Empirical investigation and results ... 13
5. Analysis and discussion ... 16
5.1. Hypotheses 1 analysis ... 16
5.2. Hypotheses 2 analysis ... 18
5.3. Analysis of defection reasons ... 18
5.4. Analysis of restaurants‟ service elements as a retention reasons ... 19
5.5. Frequency of restaurant visits and duration of being a regular client analysis ... 24
5.6. Discussion of research results with restaurant manager... 24
6. Conclusions ... 27
Reference list ... 30
1
1. INTRODUCTION
In everyday life we face lots of marketing and sales campaigns in newspapers, TVs, radios, which are directed at acquisition of new customers. A good example of such marketing and sales campaigns can be telecommunication companies which propose to buy a phone at a price below market if a consumer will become their customer for a set period of time. In this perspective a question arises: is it a good idea to focus on acquiring new customers instead of retaining the existing ones?
In our master thesis we research retention of the restaurants‟ customers. We have chosen restaurant sphere because there are researches of retention in banking, airline, hotels and other spheres1, but not so many in restaurant sphere and because of the personal interest. We think that development of the restaurant sphere is quite important as restaurants are the part of the service sector, which is the most interesting for economy of the high developed countries because of its contribution to the GDP. For instance, the contribution of the service sector in Sweden to the GDP in 2008 was 70.5 percent (Index Mundi, 20102). According to SCB 3 from 2005 to 2009 turnover index of Swedish restaurants, catering establishments and bars increased almost by 20 present (SCB, 2010). Restaurants, catering establishments and bars are in top 20 by growth tendency within 59 industries on which Swedish service sector is divided (SCB, 2010). 1.1. Background and problem discussion
There are various studies which state that focus on customer retention is less expensive than acquisition focus and can be more profitable (Reichheld, 1996; Wiegran and Koth, 1999; Reichheld and Sasser, 1990; Fornell and Wernerfelt, 1987; Blattberg and Deighton, 1996; Vandermerwe, 1997; Heskett, Sasser, Schlesinger, 1997; Payne and Frow, 1999 etc.). Yet, the research of Payne and Frow (1999) highlights that some organizations spend only one quarter of their marketing budgets on the retention of the customers.
Reichheld and Sasser (1990) stress the importance of customer retention through highlighting that retaining of 5 additional percent of the company‟s customers can increase profits by almost 100 percent. Mentioned authors also emphasize that 5 percent decrease in defection can lead to 85 percent increase in profits for banking sphere companies, 50 percent increase in profits for insurance companies, 30 percent increase in profits for auto service companies (Reichheld and Sasser, 1990).
Heskett, Sasser and Schlesinger (1997) in their book highlight successful retention strategy experience of the MBNA credit card company. MBNA called each of its clients who stopped using their card service and additionally collected feedback from its defected customers in order to adjust the service processes. After eight years of such strategy MBNA increased its profits by sixteen times and company dropped from being thirty-eight to fourth within its industry without any acquisitions. (Heskett, Sasser and Schlesinger, 1997)
The report of the Bain & Company, consulting firm, in Asian banks sphere states that retaining a customer into active one will worth two to three times more in profits as just to acquire a new
1 Reichheld, 1990; Reichheld, 2003; Colgate et al., 2007; Ahmad and Buttle, 2001; Roos, 1999; Anton et al., 2007; Jones et al., 2007; White, Lemon and Hogan, 2007; Lemon, White and Winer, 2002; Keaveney, 1995; Dawes, 2009; Berne et al., 2001; Yi and La, 2004 etc.
2 Index Mundi is web-site which contains detailed country statistics, charts, and maps. 3 Statistiska centralbyrån.
2 one and that only around 50 percent of the acquired customers will stay with the company
enough to cover all acquisition costs (Lin and Way, 2003).
Ahmad and Buttle (2001) in his research state that retention of the customers focus should be a part of the strategic marketing planning process.
Rank Xerox in Denmark made a survey and asked customers to rank their satisfaction level from 1 to 5 (5 means best satisfaction) and the following observations show that 93 percent of those who measured their satisfaction as 5 returned to make new purchases, while from those who have chosen 4th level of the satisfaction returned only 60 percent (Bergman, Klefsjö, 2003, p.330). From this example we conclude that the level of satisfaction directly influences customer‟s retention.
Overviewed researchers highlight the connection between customer retention and company profit. They prove the views on customer retention focus that it can be less expensive than acquisition focus and can be more profitable. We think that it is very difficult to make accurate calculations of expenses which are directed to the acquisition or retention of a customer. For instance, a big complex marketing campaign can be directed both to acquisition and retention and, therefore, it can be very difficult to accurately associate the costs which acquire a new client or retain the old one. It is difficult to say how much profit will bring retention strategies. We believe that proportion of acquiring versus retaining expenses and benefits depends from lots of factors such as industry, market, company strategy, product and so on. Therefore, no general figures can be calculated. But still, there is a fact, which is proven by amount of researches (see above), that retention of the customers strategy is less expensive and more profitable. This is why in our master thesis we have decided to research retention of the customers.
1.2. Research question and aim
Our master thesis focuses on the customer retention in restaurant sphere. The research question is:
Why restaurants’ customers come back?
The aim of our thesis is to describe and analyze why customers come back to the restaurants, what influence their decisions. We are going to define what is important for the restaurants‟ customers in order to come back and, therefore, what restaurants can do to increase retention of the customers (reasons to come back provided by the respondents at the same time are retention reasons from the restaurants‟ perspective).
The results of the research can be used by marketers especially in the restaurant sphere in order to better understand what influence customers‟ behavior and why they return to the service provider. Also restaurants‟ managers can use our findings as a tool to increase the retention rates by adjusting relevant restaurants‟ service elements within their restaurant.
3 1.3. Disposition
In chapter 2 of the thesis we describe the method used in the research and present the limitations and critics of the study.
Chapter 3 is related to the theoretical background of the retention of the customers problem. In this part we gather, analyze and interpret the existing theories.
Chapter 4 is related to the description and organization of the data which was collected during the empirical research.
In Chapter 5 we conduct the analysis and interpret the results of the research. Chapter 5 gives answer to the research question and checks the Hypotheses.
4
2. METHODOLOGY
The empirical research has to highlight reasons why customers come back to the restaurants. To find out these reasons we use quantitative approach of empirical research. The results will be discussed with the restaurant manager during the deep interview (qualitative approach) in order get professional comments on our findings and to increase the quality of results interpretation. Quantitative method is used to explain, predict measurable phenomena with measurable variables (Leedy, Ormrod, 2001, p. 101). Thus, it is focused on known variables. Quantitative research is deductive, therefore we try to explain one phenomenon (retention of the restaurant customers) with the sample of variables (Bryman & Bell, 2007). Also quantitative method gives us the opportunity to cover bigger, comparatively to the qualitative method, sample of
respondents which creates more possibilities to make any kind of generalizations. For empirical research we have chosen interview method with closed and open questions. According to the Bryman & Bell (2007) open questions give the opportunity for respondents to answer in their own words and, thus, for researches, to get unusual responses which can help to extend their knowledge within desired area. Closed questions are easy to process during the analysis and this type of questions enhances the possibility to compare the answers (Bryman & Bell, 2007). At the theoretical background part we formulate Hypotheses 1that most reasons of the
restaurants’ customers retention can be associated with restaurants’ service elements adapted from the 8Ps of Service Marketing Model. The Traditional 4 Ps Model was extended by the
Lovelock and Writz (2007) by additional 4 Ps and was called the „8 Ps of Service marketing‟ (hereinafter 8Ps Model): product, place and time, price and other user outlays, promotion and education, physical environment, process, people, productivity and quality elements (Lovelock and Wirtz, 2007). Therefore, second part of the interview consists from the closed questions which are directed to measure the importance of each restaurants‟ service element adapted from 8Ps for the restaurants‟ customers to come back (Annex A).
First five sections of the interview consist from the open questions. At this stage respondents can formulate their “come back” reasons with their own words. Open questions will precede closed questions part, because we want to make respondents to formulate reasons in their own words and then to rank importance of restaurants' service elements adapted from 8Ps Model as a “come back” reasons. The results will give us the opportunity to analyze the importance and weight of each restaurants‟ service element in perspective of customer retention and also to compare the answers to open questions with adapted from 8Ps model restaurants‟ service elements to see whether our assumption mentioned above is true or not. Also in the first part of interview we ask respondents to specify the name of the restaurant they come back in order to avoid the
uniformity of the sample by restaurants criteria.
As defection of the customer is directly opposite to the retention phenomena in fifth section of the interview we also try to highlight reasons which make customers to think about defection (to switch to another restaurant). This will give us a valuable data which can be used to decrease the defection rates and increase retention rates.
The sixth section of the interview contains closed questions. The 8Ps Model we adapted to the 13 restaurants‟ service elements which are, from our perspective, more relevant to the restaurant sphere (Table 2.1). To measure the importance of “Product P” for customers to come back we follow Lovelock and Writz (2007) in the perspective of augmented product – core product and supplementary services. Thus, first two questions (food, additional services) of the section six of
5 questionnaire we associate with the „Product P‟. The “Location of the restaurant” restaurants' service element should be associated with „Place and Time P‟. “Price” restaurants' service
element is associated with the „Price and other User Outlays P‟. By “other outlays” Lovelock and Writz (2007) understand additional expenses over price, extra time efforts etc. To make easier our research and to speed up the data collection we abstract from other “other outlays”.
According to the Lovelock and Writz (2007) “Promotion and Education P” can be used to create “immediate trial purchases” or to boost the consumption when demand is low. We associate with “Promotion and Education P” restaurants' service element “Special offers, discounts etc.” With the “Process P” we associate next restaurants' service elements: “Easy and fast order taking process”, “Easy table reservation process”, “Payment process”, “Service delivery speed”. “Physical environment P” is associated with the “Atmosphere (music, interior etc.)” restaurants' service element. To the “People P” we refer “Friendly and helpful staff”, “Who other clients are” and “Recognition by the staff” restaurants' service elements. We assume that for some restaurant customers it can be important who other clients in the restaurant are (e.g. gender, age, social class, culture etc.) in order to make a decision to come back. Recognition by the staff reflects some kind of loyalty of the restaurant to the customer when the restaurant staff, for instance, knows the name of that customer.
8Ps of service marketing element (Lovelock and Writz, 2007)
Restaurants' service elements associated with 8Ps of service marketing model
Product Food
Additional services (free newspapers, parking etc.)
Place and time Location of the restaurant
Price and other User Outlays Price
Promotion and Education Special offers, discounts etc Physical environment Atmosphere (music, interior etc.)
Process Easy and fast order taking process
Easy table reservation process Payment process
Service delivery speed
People Friendly and helpful staff
Who other clients are Recognition by the staff
Productivity and quality Integrated in all restaurants‟ service elements Table 2.1 – Adapted from 8Ps restaurants‟ service elements
We don‟t ask the question which is directly associated with the „Productivity and quality P‟, because we want to be precise as much as it possible and if we take a closer look at the 7 Ps mentioned above we assume their performance can reflect the productivity and quality of the service (e.g. the service delivery speed can reflect the productivity of the service and it‟s quality as well).
In addition section eight of the interview contains a question proposed by Reichheld4 (2003) which categorizes the customers into detractors, passively satisfied customers and promoters. This will give us the opportunity to touch the relation between retention and loyalty of the customer. Our assumption reflected in the theoretical background is that retention and loyalty
4 “How likely is it that you would recommend restaurant x to a friend or colleague?” Where 1 is „not at all likely‟, 5 is „neutral‟ and 10 is „extremely likely‟ (Reichheld, 2003). The interpretation of the results according to Reichheld are: 1-6 – detractors; 7,8 - passively satisfied; 9,10 – promoters (Reichheld, 2003).
6
has unidirectional relation – loyalty means retention of the customer, but retained customer doesn’t mean loyal.
The process of empirical research has next structure: a) Interview of the restaurants‟ customers (Annex A) b) Reporting of collected data.
c) Organization of results.
d) Analysis and interpretation of the results (Annex B)
e) Deep interview with the professional manager of the restaurant 2.1. Limitations and critics
Our sample can be seen, as limitation of our research, because it‟s limited by respondents questioned in Visby (still among them are visitors from another cities and tourists) and by the size of the sample of 100 respondents. Also chosen sample limits our generalization to the population and restaurants of Visby.
According to the Bryman & Bell (2007) closed questions of the interview create a loss of spontaneous responses. This disadvantage we compensate by asking respondents to answer the open questions in the first part of the interview. Another limitation of the closed questions part is that researchers cannot guarantee that respondents interpreted all questions in the same way. In the open questions part some respondents can answer the questions with “rules of thumb”, e.g. the high service quality is a reason of the customer retention. In such cases the real retention reason can be different (e.g. the customer likes waitress) or be much more specific than just high service quality (e.g. good quality of food). Maybe in such cases the qualitative approach would be more appropriate as it gives opportunity for the researchers to go into deep interviews, go by feel and develop patterns (Easterby-Smith et al., 2007). However, we think that long deep interviews can burden respondents, which can make them to speed up the interview process by starting to give answers without thinking. The interview will take place outside and we can‟t ask respondents to go through long interviews on the street.
Also we do not pay attention to the categorization of the restaurants. For different kind of
restaurants general customer preferences could be different (e.g. preferences to the fast-food and elite restaurants). The preferences among the customers of each type of restaurants could be also different. In our work‟s perspective categorization of the restaurants makes retention of the customers problem much more complex as we will need to look at the preferences of the customers to each type of the restaurant and also to define the preferences of each customer within each category of restaurants. Thus, we abstract from the restaurant categorization within this paper.
In our research we analyze the data we have got from customers which state that they regularly come back to the particular restaurant. In such cases we assume that respondents are honest and sincere which is not always the case. For further research it can be better to look from another side at the retention of the customers problem – service‟s viewpoint (view from company‟s perspective). Thus, it will give the possibility to analyze the factors which generate real retention rates changes. But, it is challenging to find the company which is really able to monitor the rates of its clients‟ retention (especially restaurant with sufficient number of customers in order to get desirable sample size).
7 To find out the loyalty level of the customer we use question which was identified by Reichheld (2003). Evidently, we can‟t expect that only with Reichheld‟s question we can measure the loyalty of the customer, but it will give us the opportunity to deeper analyze retention of the restaurant customers problem.
In our research we use partly each element of 8Ps Model in particular and not all elements in general. Our questions designed for the restaurant customers can‟t reflect all complexity of each 8 Ps Model element.
The conducted research could not pretend to investigate all the complexity of the restaurant customer‟s retention phenomena.
8
3. THEORETICAL BACKGROUND
In our master thesis we research retention of the restaurants‟ customers problem. First, we need to define what retention of the customers is.
Zineldin (2000) defines customer retention as a rate – percentage of the customers at the beginning of the period which are still remaining customers at the end of the period. Dawes (2009) defines retention simply as a number of customers who stay with the service during the set period of time.
Newell (2000) describes customer retention as the return on customer relationship marketing. Swift (2001) in his definition highlights that the retained customers has to be also loyal and profitable. Later, in this paper, we assume that retention of the customers and their loyalty have unidirectional dependency. This means that loyal customer is retained customer while retention of the customer doesn‟t always demonstrate loyalty of that customer.
Fill (2005) describes customer retention as a phase where deep relationships have been
established and parts meet individual and joint goals. Jones et al. (2007) highlight that retention can be also caused by the situation when customers are locked in the relationship with the
service provider because of the switching barriers (e.g. lack of alternatives, price benefits). Thus, customers in such situation come back not because of the deep relationships with the service provider as Fill (2005) states.
There is an opinion that customer retention is a strategic orientation of the relationship marketing which is focused to keep and learn existing customers (Zeithaml, Bitner, 2002).
Heskett, Sasser and Schlesinger (1997) define retention as active relationships between customer and service provider which create revenue from the sale of the initial product or service.
Revenue becomes more profitable with time as existing customers become easier to serve (Heskett, Sasser and Schlesinger, 1997).
Gummesson (1999) defines the customer retention as a rate, as Zineldin (2000) does, but also mentions that it is a measure of the customer loyalty. As we mentioned above we will check the relation between loyalty and retention of the customers in our empirical research.
Based on the mentioned above definitions we define, within this paper, retention of the
customers as a stable repurchase behavior provided by the customers of the service company. 3.1. Main perspectives on the retention of the customers problem
There are various researches which investigate the retention of the customers problem
(Reichheld, 1990; Reichheld, 2003; Colgate et al., 2007; Ahmad and Buttle, 2001; Roos, 1999; Anton et al., 2007; Jones et al., 2007; White, Lemon and Hogan, 2007; Lemon, White and Winer, 2002; Keaveney, 1995; Dawes, 2009; Berne et al., 2001; Yi and La, 2004 etc.) Some of the authors look at the retention of the customers from the switching barriers scope (Colgate et al., 2007; Ahmad and Buttle, 2001; Roos, 1999; Anton et al., 2007; Jones et al., 2007; White, Lemon and Hogan, 2007 etc.). Let‟s take a closer look at some of such theories. Colgate et al. (2007) in their work, research customers who decided to stay with their present service provider after serious consideration of switching to another service provider. Colgate et
9 al. (2007) conducted a big empirical research which covered big variety of service industries (banks, insurance companies, doctors, electricity companies, dentists, mobile phone companies, fitness centers, hairdressers, Internet service providers, telephone companies, airlines, credit card companies, auto mechanics, video stores, and opticians) but not the restaurant service industry. The final reasons to stay according to the Colgate et al. (2007) are categorized into the switching barriers and affirmatory barriers5. Research of Colgate et al. (2007) gives the understanding of broad categories which influence the customers‟ retention (e.g. satisfaction), but don‟t specifies these categories (i.e. the satisfaction with which determinants of the service increases retention?). Indeed, if the customer answers that he or she is satisfied with the current service provider this will not help us to understand deeper the satisfaction with which factors makes customers come back.
White, Lemon and Hogan (2007) propose marketers of the non-contractual services (as restaurant services are) to highlight customers‟ flexibility to leave when they want and to
highlight customers‟ possible regret if they leave service in order to increase customer retention. We think that among the strategies that highlight possible regret of the customers if they defect can be strategies that create different kind of switching bonds.
Han, Back, and Barrett (2009) research relationships between consumption emotions, customer satisfaction, switching barriers and customer retention. They identified next switching barriers for the restaurant customers: switching costs, relational investment, lack of alternatives, preference. Authors state that these switching barriers significantly related to repurchase intentions, and they explain why customers come back even when they experience low level of satisfaction or unfavorable emotions at the restaurant. Han, Back, and Barrett (2009) highlight that there are positive relationship between customer satisfaction and customer retention, also customer satisfaction highly influenced by emotional factors such as comfort and annoyance. (Han, Back, Barrett, 2009)
Another researcher who looks at the customers retention from the scope of switching barriers is Roos (1999). Roos (1999) defines switching determinants as pushing (what makes customers to switch to another provider) and pulling (what makes customers come back). The pushing determinants according to the Roos (1999) are price, range of goods, product mix, location, failure of system, design, policy (terms of payment), variation (a natural need of people for variation). While pulling determinants are variation, location, range of goods, habit, pleasure and policy (Roos, 1999).
Within our research we formulate Hypotheses1: most reasons of the restaurants’ customers retention can be associated with restaurants’ service elements adapted from the 8Ps of Service Marketing Model (hereinafter restaurants‟ service elements).
Let‟s compare the restaurants‟ service elements with the switching determinants presented by Roos (1999). “Product P” can be associated with the range of goods, product mix, variation; “Place P” is reflected by the location; “Physical environment P” can be associated with design; “Process P” (payment part of it) with policy. Interesting determinants presented by Roos (1999) are pleasure, habit and failure of the system. It is challenging to compare mentioned
determinants with the restaurants‟ service elements, but we think that satisfaction with, for
5
Switching barriers are time and effort needed to switch to another provider, alternatives evaluation problem, emotional bonds, switching costs. Affirmatory factors are confidence (satisfaction, familiarity, history with current service provider etc.), social bonds (emotional bonds with the service provider staff), service recovery (successful service recoveries experience) (Colgate et al., 2007)
10 instance, “Physical environment” and “People” Ps can create pleasure. Failure with delivering of some or all of the restaurants‟ service elements can create a service failure. We assume that stable satisfaction with the restaurants‟ service elements desired by the customer can create a habitual (routine) process of buying. Also we can look at the restaurants‟ service elements from the creating of switching barriers scope. We think that the restaurants‟ service elements could be used to create different kind of economical, social and emotional switching barriers.
In order to theoretically support our Hypotheses 1 let us look at some other customers‟ retention theories.
Jones et al. (2007) propose three switching costs dimensions: social, lost benefits and procedural. The behavioral outcome of creating these types of costs according to the Jones et al. (2007) could be repurchasing intentions and Negative World of Mouth (if customers are locked in the relations they don‟t want to be involved in by the switching costs they can start generating Negative WOM). Social switching costs Jones et al. (2007) relate to the potential loss of friendship with the service provider. This type of switching costs we associate with the “People P” of the 8 Ps Model. Lost benefits switching costs Jones et al. (2007) relate to the economical loses of the customer such as special offerings and price. We assume that lost benefits switching costs can be associated with the “Price” restaurants‟ service element and “Special offers,
discounts etc.” restaurants‟ service element. Procedural switching costs Jones et al. (2007) relate to the time and efforts needed to find and adapt to a new service provider.
Anton et al. (2007) analyze how poor service quality, unfair pricing, low perceived commitment, anger incidents and satisfaction affect the switching intentions of the customers in the car
insurance industry. Their research concludes that direct impact of the poor service quality and low commitment on the switching intentions of the customers is not significant and weak (Anton et al., 2007). At the same time they positively influence the customer dissatisfaction which directly influence the customer switching intentions (Anton et al., 2007). The service quality according to the Anton et al. (2007) is founded on such dimensions as the service outcome, interaction between service and customer, and physical environment qualities. We assume that the service outcome can be associated with the “Food” and “Additional services” restaurants‟ service elements, interaction – with the “Friendly and helpful staff” restaurants‟ service element, and “Physical environment” qualities respectively - with the “Atmosphere” restaurants‟ service element. Commitment according to Anton et al. (2007) are willingness to invest, shared
information, loyalty and commitment to the customer, or perceived desire to continue. The unfair pricing and anger incidents according to Anton et al. (2007) strongly affects switching intentions of the customers both directly and indirectly through satisfaction. We think that unfair pricing can be also analyzed through the “Price” restaurants‟ service element. The anger incidents according to Anton et al. (2007) are related to the customers‟ experience when they become upset and lose confidence in the firm. There could be lots of factors generating lose in the firm‟s confidence. At this stage we assume that dissatisfaction with some or all of the restaurants‟ service elements can be one of such factors which makes customers upset.
Lemon, White and Winer (2002) state that when customers decide whether or not to come back they consider not only current and past evaluations of company‟s performance (service quality, satisfaction) they also evaluate future expectations (future benefits and future regret). Authors state that firms should put more emphasize on customer expectations of future benefits in order to achieve retention and suggest to marketers to take into consideration how marketing mix elements (for instance, pricing strategy) influence customers‟ current usage levels and
11 Keaveney (1995) defined reasons of switching behavior of the customers within the service industries: price, inconvenience, core service failures, failed employee responses to service failure, ethical problems, involuntary factors, competitive issues and service encounter failures. In his model are present such elements of 8 Ps Model like “Product”, “Price”, “People”, “Physical environment” etc. Also Keaveney (1995) stated that six of the eight causes of
switching behavior can be controlled by the service provider.
Ahmad and Buttle (2001) emphasize that the Marketing Mix model is the tool of traditional marketing approach which is directed to acquisition of the new customers, at the same time it can be used to achieve higher rates of customers retention. Ahmad and Buttle (2001) propose three types of potential retention increase strategies for three types of consumers: consumers of fast moving consumer goods (FMCG), consumers of services, businesses as users of physical goods and services. In all strategies they propose adjustment of particular elements which can be associated with Marketing Mix Model.
Dawes in 2009 presented his hypotheses which he proved by the empirical study that regular clients are less sensitive to the changes in price then ordinary clients. This notion we will be able partly support or deny with results of our empirical research (we will see the weighted
importance of the Price restaurants‟ service element for the regular restaurant clients among other restaurants‟ service elements).
Berne et al. (2001) see retention of the customers as a function of the customer satisfaction while customer satisfaction is a function of the service quality (SQ-CS-CR model). Also he adds to this model variety seeking determinant which influences the customer retention directly (Berne et al., 2001). The variety seeking determinant we can try to associate with the “Food” restaurants‟ service element as the big variety of products can satisfy the natural need of customer for variety seeking process. Furthermore, to the determinants of customer satisfaction Berne et al. (2001) relate: personnel and cleanliness, food, atmosphere, fast service. Personnel and cleanliness we can associate with “Friendly and helpful staff” restaurants‟ service element, Food – with “Food” restaurants‟ service element, atmosphere – “Atmosphere” restaurants‟ service element, Fast service – “Easy and fast order taking process” and “Service delivery speed” restaurants' service elements.
Based on the overviewed theoretical background in our empirical research we want to find out which role each restaurants‟ service element plays in retention of the restaurant customers. Another important view on the customer retention was highlighted by the Yi and La (2004). Their study research the impact of the loyalty factor on customer satisfaction and repurchase intention (Yi, La, 2004). Authors concluded that for loyal customers satisfaction has a direct impact on repurchase intentions, when for non-loyal customers adjusted expectations
(expectations formed after consumption) play leading role in forming repurchase intention (Yi, La, 2004). Therefore, researchers highlight that when failure happens, repurchase intentions of loyal customers are less affected than repurchase intentions of non-loyal customers (Yi, La, 2004).
Looking for the loyalty measurement tool we have directed our attention at the research of Reichheld (2003). He has presented the set of questions directed to the loyalty measurement and
12 identified one question6 which was the most effective tool of loyalty measurement among other questions (Reichheld, 2003). Reichheld (2003) justified the correctness of his question by the notion that those customers, who recommend the service, are highly likely to be the loyal customers. This gives us the opportunity to touch the relation between retention and loyalty of the customer. Also this leads us to our Hypotheses 2 - retention and loyalty have unidirectional relation – loyalty means retention of the customer, but retained customer doesn’t mean loyal.
3.2. Other perspectives on the retention of the customers problem
In this chapter we present some of the theories within the customers‟ retention problem which were not discussed in the previous part, because they cannot be analyzed within our empirical research. These studies are important part of the customers‟ retention problem and can be used for further researches.
The research of Fruchter and Zhang (2004) analyze strategic use of targeted promotion for acquisition and retention of customers. Authors stress that choice of strategy: defensive targeted promotions for retention and offensive promotions for acquisition depends on market share of a company. Fruchter and Zhang (2004) highlighted that for companies with larger market share offensive promotions targeted on acquisition generate less “bang on sales” than defensive promotions. Therefore, researchers state that if market share of company increases it should spend more on customer retention; if market share of company decreases it should spend more on customer acquisition. This research highlights when marketers should put emphasize on retention or acquisition, but it doesn‟t provide retention increase strategies and reasons for retention. ( Fruchter and Zhang, 2004)
Lee and Heo (2009) highlight that Corporate Social Responsibility (CSR) activities can increase satisfaction/retention rates of customers in hotels and restaurants. Lee and Heo (2009) have found that positive CSR activities increase hotels‟ customers‟ satisfaction.
Hogan, Lemon and Libai (2003) discuss changes of the customer‟s value during the product life cycle. Authors stress the value of retained customer (free positive WOM) and impact of the lost customer on company‟s profitability (Hogan, Lemon and Libai, 2003).
Kumar (1999) highlights that relationship oriented service firms have higher level of trust and more repeated service encounters with their clients, therefore, such firms get higher level of profitability and lower expenses over time.
Desai and Mahajan (1998) argue that affect-based attitudes (appeal to fillings, wishes, emotions, etc.) can play a strategic role in helping brands to acquire, develop, and retain customers.
6 “How likely is it that you would recommend restaurant x to a friend or colleague?” Where 0 is „not at all likely‟, 5 is „neutral‟ and 10 is „extremely likely‟ (Reichheld, 2003). The interpretation of the results according to Reichheld are: 0-6 – detractors; 7,8 - passively satissfied; 9,10 – promoters (Reichheld, 2003).
13
4. EMPIRICAL INVESTIGATION AND RESULTS
Empirical results of our research consist of 100 interviews which were collected in order to find out reasons why customers come back to the restaurants. Investigation was conducted in Visby during the April 2010. Among our respondents 13 percent are tourists which add more diversity to our findings. Respondents were selected randomly on the street. The important condition to start interview was requirement to the respondent to be a regular client of some particular restaurant. Thus, our sample consists of 100 interviews with regular customers of some restaurants.
On the average interviews were conducted only with each 4th - 5th person, as only each 4th - 5th person admitted to be a regular client of some restaurant. Each interview lasted on the average 15 minutes with appropriate respondent and 2-3 minutes with those who were ready to answer, but appeared to be not regular clients. Some problems appeared with respondents‟ understanding of the term “regular client”, thus we had to explain them that if a client visits one particular
restaurant more often than other restaurants or if client doesn‟t visit restaurants often, for instance once per year, but each year visits one particular restaurant than for our research this client is regular client of some restaurant. Some of the respondents, even those who are loyal according to the Reichheld‟s (2003) types of customers, had troubles with remembering the actual name of the restaurant to which they come back.
Our sample presented by the diverse range of respondents with different age, gender, frequency of visiting and duration of being a regular client. Among 100 respondents 59 are women and 41 are men. During the data collection women were more ready to answer and participate than men, but still we have more or less equal amount of both gender respondents.
In Table 4.1 we present distribution of the respondents among age categories. We used five categories to define the respondents‟ age in order to make easier the analyses and simplify choice for respondents, as we think that some respondents, especially women, can feel uncomfortable when it is required to specify their age. From Table 4.1 can be seen that the biggest amount of respondents in the sample are presented by „56+‟ category, but, nevertheless, all other categories presented with more or less equal amount of respondents.
Age range category Amount of respondents
15-25 15 26-35 15 36-45 21 46-55 20 56+ 29 Total 100
Table 4.1 - Distribution of the respondents through the age range categories.
In Table 4.2 we present visiting frequency data, which describes how many times respondents visit their restaurants per year. The visiting frequency question had open form, thus respondents could tell us how often they visit restaurant in their own words. The open question form for this information was used in respect that we have limited knowledge about the visiting frequency of restaurants‟ customers, thus we were not able to form an appropriate categories of this variable before the research. In order to make possible the work with visiting frequency data we reduced the data “to a common denominator” (amount of restaurant visits each respondent makes per year) after collecting it. The range of visiting frequency was so broad that we decided to
14 categorize visiting frequency data into five categories. From Table 4.2 can be seen that the majority of the respondents visit their restaurants from 11 to 50 (39 respondents) and 1 to 10 (31 respondents) times per year.
Restaurants visiting frequency, times per year Amount of respondents
1 - 10 31 11 - 50 39 51 - 100 17 101 - 200 10 201 + 3 Total 100
Table 4.2 - Distribution of the respondents through restaurants visiting frequency categories. In Table 4.3 we present data which describes how many years regular clients come back to their restaurants. Respondents answered in free form, so for analyses we have to reorganize this data. When respondents were not sure whether they return to the restaurant A or B years we took average value for the analysis (e.g. answer 2 or 3 years was interpreted as 2.5 years). When we reorganized this data the range of years was broad, thus we organized this data into seven categories. From Table 4.3 can be seen that top categories by amount of respondents are second and sixth and respondents within these categories are respectively a regular clients of some restaurant during 1.5-2 years and 5.5-10 years.
Duration of being restaurant regular customer, years Amount of respondents
0 - 1 15 1.5 - 2 22 2.5 - 3 9 3.5 - 4 6 4.5 - 5 14 5.5 - 10 21 10.5 + 13 Total 100
Table 4.3 - Distribution of the respondents through duration of being restaurant regular customer categories
Among 100 interviews we asked customers of 38 restaurants in Visby and 13 restaurants from other places. This gives more diversity to our sample. We collected this data in order to be sure that our respondents are clients of different restaurants and as a result we have different views and perspectives.
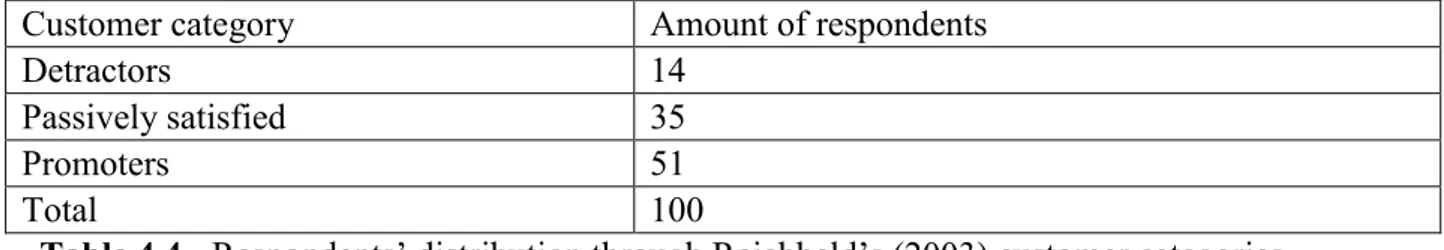
In respect to our Hypotheses 2 we have added in our questionnaire question presented by Reichheld (2003) which helps to evaluate customers‟ loyalty. We have organized collected data into three categories: detractors, passively satisfied and promoters (Reichheld, 2003). In Table 4.4 we present respondents‟ distribution according to Reichheld‟s (2003) categories. Among 100 respondents 51 are “promoters”, which are according to Reichheld (2003) the most loyal
15
Customer category Amount of respondents
Detractors 14
Passively satisfied 35
Promoters 51
Total 100
Table 4.4 - Respondents‟ distribution through Reichheld‟s (2003) customer categories
In respect to our Hypotheses 1 at the second part of the questionnaire we asked respondents to define extend to which each restaurants‟ service element is important for restaurants‟ customers to come back on the scale from 1 to 10, where 10 means the most important and 1 means not important at all (Annex C).
In the Table 4.5 we present the rating of all restaurants‟ service elements from highest rating to lowest. We rated restaurants‟ service elements answers within the sample according to their weights7. Highest rating has “Food” element of the restaurants‟ service. Such result was expected as good food is a core service of the restaurant business and it should be high quality. Among 100 respondents 42 have weighted importance of “Food” as 10. No respondents have weighted “Food” as 1-3. The second highest rating has “Friendly and helpful staff” restaurants‟ service element. The highest amount of respondents weighted this element as “most important” mark. The lowest rating has “Additional services” restaurants‟ service element. This restaurants‟ service element 77 percent of respondents marked from 1 to 6.
Restaurants‟ service element Rating
Food 8,60
Friendly and helpful staff 8,29
Atmosphere 7,61
Service delivery speed 7,24
Location of the restaurant 7,07
Price 7,07
Payment process 7,02
Easy and fast order taking process 6,97
Easy table reservation process 6,56
Recognition by the staff 5,73
Special offers, discounts etc. 5,55
Who other clients are 5,48
Additional services 4,39
Table 4.5 - Rating of restaurants‟ service element from closed questions
7 We calculate the rate of each element as
N n weight Rate i i 10
1 , where n- number of respondents which have
16
5. ANALYSIS AND DISCUSSION
5.1. Hypotheses 1 analysis
To check our Hypotheses 1 we have to analyze respondents‟ “come back” reasons from open questions section in order to associate or not them with restaurants‟ service elements. In Table 5.1 we present dispersion of the respondents by amount of reasons which we were able to associate with restaurants‟ service elements. As we can see, only reasons of four respondents we were not able to associate with restaurants‟ service elements. Thus, 96 percent of the respondents presented at least one “come back” reason which we can associate with restaurants‟ service elements (Annex D).
Amount of retention reasons which we associated with restaurants‟
service elements Amount of respondents
0 4 1 44 2 33 3 16 4 2 5 1 Grand Total 100
Table 5.1 - Amount of retention reasons which we associated with restaurants‟ service elements Table 5.2 shows performance of coded retention reasons from open questions section after association with restaurants‟ service elements. Leading “come back” reasons of the respondents according to our research are respectively food, atmosphere, price, location, friendly and helpful staff.
Retention reason Amount of respondents
Food 77
Atmosphere 32
Price 19
Location 17
Friendly and helpful staff 12
Easy and fast order taking process 5
Service delivery speed 5
Special offers, discounts etc. 3
Who other clients are 1
Table 5.2 - Coded retention reasons after association with restaurants‟ service elements Next retention reasons we couldn‟t associate with restaurants‟ service elements: only option, good service, children like it, serving good, know owner, just like it, always get what you want, good to go with friends, don‟t need to cook, quality, best restaurant, outstanding.
We assume that within our research most of these reasons were not associated with restaurants‟ service elements because respondents couldn‟t express what exactly make them come back. Indeed, “good service”, “serving good”, “just like it”, “always get what you want”, “quality”, “best restaurant”, “outstanding” are very abstract definitions and can mean lots of positive sides
17 of the service, e.g. kind staff, fast service delivery, good atmosphere etc. “Children like it” reason tells us why our particular respondent returns to the restaurant, but nothing why his/her children like that restaurant. “Good to go with friends” retention reason also is very abstract as it can mean, for instance, that atmosphere in the restaurant is good to have a talk with friends or, for instance, a respondent can return to that particular restaurant only because his/her friends like that restaurant. Another interesting retention reason is “don‟t need to cook”. “Only option” retention reason can be associated with some unique for the particular customer element of the restaurant (for instance, Jamaican food). This finding is consistent with the authors who explain retention of the customers from the switching barriers point of view8, but still doesn‟t change the fact that these switching barriers in our research are one or several restaurants' service elements. “Know owner” retention reason is also consistent with Jones et al. (2007) and can be associated with the social switching costs – a potential loss of friendship with the service provider. Also it can be associated with affirmatory barriers for switching to another provider presented by Colgate et al. (2007) – familiarity and history with current service provider.
Respondents didn‟t mentioned retention reasons which we could associate with “Payment
process”, “Easy table reservation process”, “Recognition by the staff” and “Additional services”. As we can see in the open questions section of the interview the most frequently mentioned retention reason is “Food” (Table 5.2). In the previous section we have ranked each restaurants‟ service element within the closed questions (Table 4.5) of the interview and “Food” restaurants' service element also is placed on the first place. The results are predictable as food is a core service of each restaurant and has to be high quality. “Atmosphere” restaurants' service element is on the second place in the open questions section of the interview and it has third place in the closed questions section of the interview. With “Atmosphere” restaurants' service element we have associated such retention reasons as charming, comfortable, sea view, cozy, silence, jazz club, music etc (Annex C). “Price” restaurants' service element is on the third place in the open questions section of the interview while in the closed questions section of the interview
respondents have put it only on the sixth place. The reasons of such difference can be in bigger amount of retention reasons in the closed questions section of the interview – when respondents saw so many retention reasons “Price” could become less important than “Service delivery speed” and “Location of the restaurant” which has respectively the fourth and the fifth place in the closed questions section of the interview (Table 4.5).
We are aware that such comparison between the ranks of retention reasons we have got from the open and closed questions is not entirely correct. In the closed questions section of the interview we asked respondents not only to chose which of the restaurants‟ service elements are important for them to come back, but also to rank their importance level (Annex A). Then we calculated the rank of each retention reason according to the amount of respondents have chosen particular reason and its importance. In the open questions section of the interview respondents just mention what makes them come back to the restaurants, which gives us only frequency of the mentioning – ranks from this section are not weighted with the importance of each retention reason. Therefore, this comparison we have conducted on the “noteworthy” rights.
Total amount of the retention reasons we have investigated during the research is seventy. Twelve retention reasons among seventy we couldn‟t associate with the restaurants‟ service elements (17.14 percent).
8Colgate et al., 2007; Ahmad and Buttle, 2001; Roos, 1999; Anton et al., 2007; Jones et al., 2007; White, Lemon and Hogan,
18 Our findings support Hypotheses 1: “most reasons of the restaurants’ customers retention can be
associated with the restaurants’ service elements adapted from the 8Ps of service marketing model” as within researched sample 82.86 percent of the retention reasons we were able to
associate with restaurants‟ service elements and only retention reasons of 4 percent of the respondents we haven‟t associated with the restaurants‟ service elements.
5.2. Hypotheses 2 analysis
During the theoretical research of customers retention problem we have formulated Hypotheses 2: “retention and loyalty have unidirectional relation – loyalty means retention of the customer,
but retained customer doesn’t mean loyal”. According to the Reichheld (2003) the loyal
customers are those who promote the service they consume. Therefore, to confirm or disconfirm our Hypotheses 2 we have to analyze how many promoters are among retained respondents. As we mentioned earlier the important requirement to the respondent to start an interview was being a regular client of a particular restaurant, which means that all respondents within the sample are retained customers.
In previous chapter in Table 4.4 we have summarized the distribution of the respondents among Reichheld‟s (2003) types of customers. According to our research there are 51 percent of the respondents which are, according to Reichheld (2003), promoters and, therefore, loyal
customers. Thus, 49 percent of the respondents according to Reichheld (2003) are not loyal. In respect to our Hypotheses 2 within the researched sample of the respondents, we can say that all loyal restaurant customers (promoters) are retained customers, but 49 percent of retained
customers are not loyal (passively satisfied and detractors). From our perspective, some of non-loyal customers return because there are some “only option restaurants” in Visby such as
chinese, jazz, thai, fish restaurants etc. Another reason can be location of the restaurant – a lot of students and teachers of the Gotland University eat in the restaurant, which is situated in the University, as it is the closest place where they can have lunch or a cup of coffee during the break.
We have confirmed our Hypotheses 2.Within our research, the results don‟t support the
customers‟ retention definition presented by the Gummesson (1999) and Swift (2001), which say that customer retention is a measure of the customer loyalty as only 51 percent of retained
customers within our sample are loyal. 5.3. Analysis of defection reasons
Within our research 79 percent of the respondents couldn‟t specify the defection reasons to another restaurant because they either didn‟t change the restaurant or couldn‟t formulate the actual reasons (Annex E). In Table 5.3 we present defection reasons which we associated with restaurants‟ service elements. From Table 5.3 we can see that the major reason of defection to another restaurant is “Food”. Some of the respondents mentioned that they want to try new tastes and another food. Some other respondents mentioned that they want to eat food of higher quality than in the restaurant they come back. One of the respondents mentioned that he defects to another restaurant because of travelling. One interesting defection reason, which we have
associated with the “Price” restaurants‟ service element, is that respondent want “more expensive service”. From our experience, some people have a “rule of thumb” that higher price means better quality – this can be one of the reasons why customer may want to have more expensive service. Another reason, from our perspective, can be a need of our respondent to be associated with a high expensive restaurant by other people in order to adjust his/her image in the eyes of others.
19
Defection reason Amount of respondents
Food 13
Location 2
Price 3
Atmosphere 2
Who other clients are 2
Easy and fast order taking process 1
Service delivery speed 1
Table 5.3 - Resulting defection reasons after association with restaurants‟ service elements Next defection reasons we didn‟t associate with restaurants‟ service elements: need for variety, internet ranks, friends want another restaurant, will defect if owner of the restaurant will be changed, service, children like another restaurant.
As in the case with retention reasons we assume that most of the defection reasons are not associated with restaurants‟ service elements because respondents couldn‟t express what exactly makes them defect. “Need for variety”, for instance, can be successfully associated with desire of the respondent to try new food or to change atmosphere. Also “Need for variety” defection reason is consistent with Roos (1999) who defines “variety” as a pushing determinant – factors which make customer to change the service provider. “Friends want another restaurant” and “children like another restaurant” tell us why particular respondents defect, but don‟t tell us why those friends and children like another restaurant (e.g. which restaurants‟ service elements?). “Service” defection reason is very broad and can mean any of the restaurants‟ service elements. Interesting defection reason is “internet ranks” – respondent looks at the ratings of the
restaurants in the internet and then decides where to go. But still, that respondent has his favorite restaurant to which he comes back. “Will defect if owner of the restaurant will be changed” is a reason which we didn‟t associated with “Friendly and helpful staff” restaurants‟ service element because, we think, it can only be partly associated with this element and reflect, to some extend, loyalty to the owner of the restaurant.
5.4. Analysis of restaurants’ service elements as a retention reasons
Analysis of the restaurants‟ service elements as a retention reasons was conducted in two major steps. In first step, we use linear regression to analyze how gender of the respondent, frequency of visits, duration of being a customer, age and loyalty level to some restaurant influence customers‟ attitudes towards restaurants‟ service elements as a retention reason9 (Annex F). During the second step of the analysis we analyze and define, with the help of correlation analysis, how attitudes towards one service restaurants‟ element are correlated with attitudes towards other restaurants‟ service elements for particular respondents (Annex G).
To make analysis possible, loyalty is measured from one to ten. Age range is presented by a figure from one to five (where one is “15-25” and five is “56+” categories). Gender is a dummy variable and means zero for women and one – for men. Frequency of visits to the restaurants is presented in “times per year” and duration of being a regular client is presented in years. For the data analysis we used Excel Analysis ToolPak.
9 n X X X1 2 2 n 1 ... =
y , where y is dependent variable (restaurants‟ service element as retention reason); β1…βn –
coefficients , X - gender of the respondent, frequency of visits, duration of being a customer, age, and loyalty level, Xn effects y, λ
20 During the analysis we pay attention only to those relations which are statistically significant at 0.01, 0.05 and 0.1 levels of significance. In Illustrations 5.1 and 5.2 can be seen visualized major regression results which are the most interesting from our perspective.
Customer’s loyalty Food Friendly and helpful staff Atmosphere Additional services Price Who other clients
are
Special offers and discounts
Positive relation (The more loyal respondent is the more important for him/her is this restaurants’ service element) Negative relation ((The more loyal respondent is the less important for him/her is this restaurants’ service element)
Illustration 5.1 – Major results of regression analysis (Customer‟s loyalty – independent variable).
Friendly and helpful staff
Who other clients are Special offers and
discounts Duration Recognition by the staff Easy table reservation process
Easy and fast order taking process Frequent clients Older Clients Women Older clients
The older respondent is the more important this restaurants’ service element is for him/her
Duration The longer respondents is a client of the restaurant the more
important for him/her is this restaurants’ service element
The more frequently respondent visits the restaurant the more important for him/her is this restaurants’ service element
Frequent clients
Restaurants’ service element is more important for women than for men
Women
Illustration 5.2 – Major results of regression analysis (Duration, gender, age, visiting frequency – independent variables).
During the regression analysis we defined how loyalty of the respondents to some restaurant, respondents‟ age, gender, frequency of restaurant visits and duration of being a regular client of some restaurant influence his/her rates of restaurants' service elements importance as a retention reason. Therefore, the dependent variables in our research are respondents‟ rates of restaurants' service elements importance as a retention reasons. We don‟t analyze the reversed dependency between restaurants' service elements and loyalty as, in such case, this will show us how attitudes towards restaurants' service elements influence loyalty of the customers and loyalty is not the scope of our research.
21 Regression analysis has shown positive relation of loyalty level of the respondent with “Food”, “Atmosphere” and “Friendly and Helpful staff” restaurants' service elements. In other words the more loyal client is the more important for him/her are “Food”, “Atmosphere” and “Friendly and Helpful staff” as the reasons to come back. Thus, arises a question: why higher loyalty of the customer means higher importance of food, atmosphere, friendly and helpful staff? In our research some respondents ranked the importance of restaurants‟ service elements in general, others – “kept in mind” their favorite restaurant while ranking. Thus, for instance, the positive relation of the respondents‟ loyalty to the importance of food can be explained that when customer is loyal to the food of one particular restaurant then when he/she visits another
restaurant his/her expectation for the food are quite high as he/she could have perceptions of the food quality and taste from his favorite restaurant much higher than they actually are. From our perspective the same explanation is relevant to the positive relation of the respondents‟ loyalty level and importance of atmosphere as a retention reason as well. We also assume that such relation can be explained that sometimes more loyal client asks for more attention and special treatment as a reward for his/her loyalty.
Negative relation according to our findings has loyalty level of the respondent with “Additional services”, “Price”, “Who other clients are” and “Special offers and discounts” restaurants' service elements. The interpretation is that the more loyal customer is the less he/she ranks mentioned above restaurants' service elements as “come back” reasons to the restaurants. From our perspective, this can take place because “Who other clients are” and “Special offers and discounts” are not in the top of restaurants‟ customers‟ retention reasons (table 4.5) and loyal customers care about these reasons less than non-loyal – in some cases they can see service better than it actually is or such customers may need less than non-loyal in order to become satisfied. Also this finding is partly consistent with the Dawes‟s (2009) notion that regular clients are less sensitive to the price than ordinary clients. According to our research the more loyal client is the less sensitive to the price he/she is.
According to our regression analysis, women rank importance of “Friendly and Helpful staff”, “Who other clients are” and “Special offers and discounts” as reasons to come back, higher than men. We think that women are naturally and generally more communicative and emotional than men and, thus, care more about interactions with other people. The same reason, we think, makes them rank “Special offers and discounts” higher than men – they may require more special treatment than men.
During the regression analysis we have discovered that the older respondent is the more he/she ranks the importance of “Who other clients are”, “Recognition by the staff” and “Easy table reservation process” as a reason to come back. From our experience we can assume that younger generation naturally has more active life than older generation, which tends to value comfort more than activity. This can be one among lots of explanations to such relations.
Another positive relation shows that the more frequently respondent visits the restaurant the higher he/she ranks importance of the “Easy and fast order taking process” restaurants' service element as a reason to come back. Indeed, it is logically to assume that the more frequent
respondents visit restaurants the more they can face situation when they have to wait to make an order and, therefore, the higher their want to decrease this procedure in time (which increases their rank of this restaurants' service element importance).
The last relation we have discovered from our first step regression analysis is a positive relation of being a regular client duration to the “Special offers and discounts” restaurants' service element. Thus, the longer respondent is a client of some restaurant the higher he/she ranks the
22 importance of “Special offers and discounts” as a reason to come back. We think that when respondent is a client of some restaurant for a long period of time, a need for some kind of reward for being a regular client can arise. “Special offers and discounts” restaurants' service element can play such reward role.
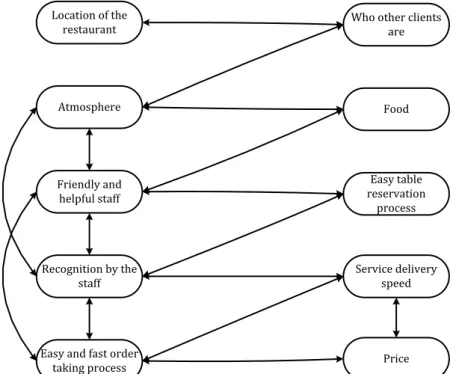
During the second step of the analysis we conduct a correlation analysis of the respondents‟ restaurants' service elements ranks as retention reasons. As in previous step, in this step we analyze only those correlations which are statically significant at 0.01, 0.05 or 0.1 levels of significance. In Illustration 5.3 can be seen visualized major correlation results which are the most interesting from our perspective.
Who other clients are Food Atmosphere Friendly and helpful staff Location of the restaurant
Easy and fast order
taking process Price
Recognition by the staff Easy table reservation process Service delivery speed
Illustration 5.3 – Correlations among restaurants‟ service elements importance rankings as a retention reasons.
During the correlation analysis we have discovered positive correlation among rankings of restaurants' service elements within Product P (Food, Additional services), People P (Friendly and helpful staff, who other clients are, recognition by the staff) and Process P (Easy and fast order taking process, easy table reservation process, payment process, service delivery speed) groups of restaurants' service elements. Therefore, within our sample, when respondent ranks one of the restaurants' service element with high mark he/she also ranks high other restaurants' service elements within a group (element of 8Ps Model). The significance of correlation among restaurants' service elements within each element of 8Ps Model strengthen our restaurants' service element adapted model.
Statistically significant correlation is between rankings of “Location of the restaurant” and “Who other clients are” restaurants' service elements. For instance, if a respondent goes to the
restaurant which is located on the beach he/she, could happen, doesn‟t want to see there business people in black suits who will remind the respondent his/her own job. Vice versa, targeted clients of the restaurant can cause its location. For instance, if target clients are students then restaurant might be placed in or near the University and clients of such restaurant might desire to see other clients of the restaurant as students and, maybe, teachers.