ISBN: 978-91-88898-64-7
11
Test-analyses comparisons of a stabilizing glulam truss for a tall building
Pierre Landel†‡*, Andreas Linderholt† and Marie Johansson‡†Linnaeus University, name.name@lnu.se ‡Research Institutes of Sweden, name.name@ri.se
Nowadays, timber buildings are rising and their wind induced dynamical loads are thereby increasing. Tall and light buildings become sensitive to wind loads. Adding extra mass, damping or both constitute solutions [1]. In a recent study, the dynamic behavior of a large glulam truss with slotted-in steel plates and dowels connection types found from vibrational tests and finite element (FE) models were compared [2]. From forced vibration tests (FVTs) on the truss, used as a stabilizing element in a tall timber building, five significant eigenmodes, i.e. the natural frequencies, the damping values and the mode shapes with scaling, were estimated and compared to results from calibrated FE models, named A-models in Table 1. Two aspects for the modelling of a timber truss structure subjected to wind-induced loads were highlighted. First, the importance of including the finite stiffness in the connection instead of modeling the connection as being either pinned or clamped. Second, the accuracy of the Eurocode model aimed for estimates of the slip moduli for groups of fasteners in steel-to-timber connections. In this new study, Euler-Bernoulli beam element models have been developed by use of two FE codes: RFEM which is commonly used by structural engineers and the more advanced MSC NASTRAN. The geometry, density and stiffness properties of the glulam elements were set according to the production drawings, but the weight of the connections was ignored. Similar methods and analyses as the ones presented in [2] were performed to compare the natural frequencies and the mode shapes from the FE models with the experimental results. The RFEM and NASTRAN models had the same number of linear beam elements (1D).
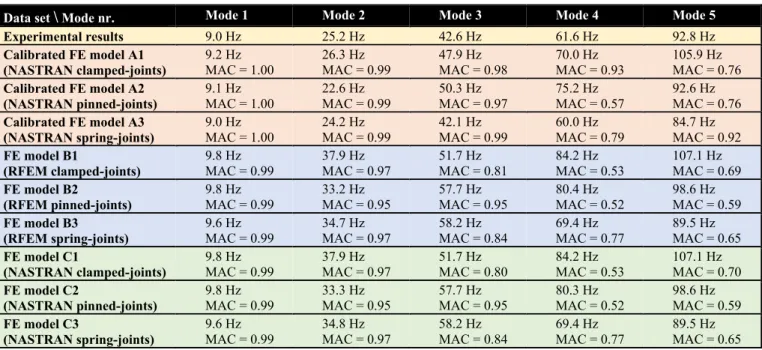
Table 1: Experimental and analytical natural frequencies with MAC values comparing measured and FE eigenvectors.
Data set \ Mode nr. Mode 1 Mode 2 Mode 3 Mode 4 Mode 5
Experimental results 9.0 Hz 25.2 Hz 42.6 Hz 61.6 Hz 92.8 Hz
Calibrated FE model A1 (NASTRAN clamped-joints)
9.2 Hz
MAC = 1.00 26.3 Hz MAC = 0.99 47.9 Hz MAC = 0.98 70.0 Hz MAC = 0.93 105.9 Hz MAC = 0.76 Calibrated FE model A2
(NASTRAN pinned-joints) 9.1 Hz MAC = 1.00 22.6 Hz MAC = 0.99 50.3 Hz MAC = 0.97 75.2 Hz MAC = 0.57 92.6 Hz MAC = 0.76 Calibrated FE model A3 (NASTRAN spring-joints) 9.0 Hz MAC = 1.00 24.2 Hz MAC = 0.99 42.1 Hz MAC = 0.99 60.0 Hz MAC = 0.79 84.7 Hz MAC = 0.92 FE model B1 (RFEM clamped-joints) 9.8 Hz
MAC = 0.99 37.9 Hz MAC = 0.97 51.7 Hz MAC = 0.81 84.2 Hz MAC = 0.53 107.1 Hz MAC = 0.69 FE model B2
(RFEM pinned-joints) 9.8 Hz MAC = 0.99 33.2 Hz MAC = 0.95 57.7 Hz MAC = 0.95 80.4 Hz MAC = 0.52 98.6 Hz MAC = 0.59 FE model B3 (RFEM spring-joints) 9.6 Hz MAC = 0.99 34.7 Hz MAC = 0.97 58.2 Hz MAC = 0.84 69.4 Hz MAC = 0.77 89.5 Hz MAC = 0.65 FE model C1 (NASTRAN clamped-joints) 9.8 Hz
MAC = 0.99 37.9 Hz MAC = 0.97 51.7 Hz MAC = 0.80 84.2 Hz MAC = 0.53 107.1 Hz MAC = 0.70 FE model C2
(NASTRAN pinned-joints) 9.8 Hz MAC = 0.99 33.3 Hz MAC = 0.95 57.7 Hz MAC = 0.95 80.3 Hz MAC = 0.52 98.6 Hz MAC = 0.59 FE model C3 (NASTRAN spring-joints) 9.6 Hz MAC = 0.99 34.8 Hz MAC = 0.97 58.2 Hz MAC = 0.84 69.4 Hz MAC = 0.77 89.5 Hz MAC = 0.65 Table 1 presents the old and the new results. On one hand, the natural frequencies and mode shapes from the models named B, which were calculated using RFEM, and the models denoted C, which were calculated using MSC NASTRAN, are identical. On the other hand, the new models predict higher natural frequencies than the calibrated models. In the new numerical models, the glulam members are of quality GL30c according to EN 14080:2013 and they have a Young´s modulus of 13 GPa which is 18.5 % higher than for four of the tested beams ( , = 11 GPa and
, = 1.9 %). The total weight of the modelled truss is 3 880 kg which is 9.4 % lower than the tested one. Natural
frequencies of vibrating structures are proportional to the square root of the modal stiffness to modal mass ratios. The deviations in mass and stiffness explain the numerical models’ higher natural frequencies. Finally, the rotational and translational springs in the model 3 seem to be valuable parameters when evaluating natural frequencies. Using correct masses and stiffnesses for both structural elements and fasteners in FE-models is crucial to mimic the real structure’s behavior.
References
[1] Foster, R.M. and Reynolds, T.P.S. (2018) “Lightweighting with Timber: An Opportunity for More Sustainable Urban Densification”, J. Arch. Eng., 24(1), 02518001, https://doi.org/10.1061/(ASCE)AE.1943-5568.0000301 [2] P. Landel, A. Linderholt and M. Johansson, 2018. Dynamical properties of a large glulam truss for a tall timber