How does foreign aid
associate to the economic
growth in Tanzania?
BACHELOR
THESIS WITHIN: Economics NUMBER OF CREDITS: 15hp
PROGRAMME OF STUDY: International
Economics
AUTHOR: Amena Abdelhafiz & Danayt Mogos JÖNKÖPING May 2019
Acknowledgements
We, Amena Abdelhafiz and Danayt Mogos, would like to take this opportunity and acknowledge our beloved families for their encouragement and inspiration.
Foremost, to our supervisors Paul Nystedt and Toni Duras. We thank you for your immerse efforts and guidance that greatly contributed to writing our paper.
We would also like to express our deepest appreciation towards our beloved friends Demiana, Denusha, Katleho, Kristen and Sherin. Your constant support could never go unnoticed, you will always be our home away from home.
Amena Abdelhafiz Danayt Mogos
Jönköping International Business School May, 2019
Bachelor Thesis in Economics
Title: How does foreign aid associate to the economic growth in Tanzania? Authors: Amena Abdelhafiz & Danayt Mogos
Tutor: Paul Nystedt & Toni Duras Date: 2019-05-20
Key terms: Foreign Aid, Economic Growth, Effect, Corruption, Developing Countries, Two-Gap Model
Abstract
Foreign aid’s effect in developing economies has been a discussed topic for decades. Many scholars have been debating on whether foreign aid increases or decreases economic growth in the recipient country. Yet, this debate may never be put to rest as the conclusions may vary depending on the study. There are different types of aid which yields different outcomes depending on the social- economic status of the recipient country. Historically, Tanzania has been under major economic and political reforms since the 1970s which enhanced the country to benefit from foreign aid tremendously on the recent decades. Therefore, this arises the question of how does foreign aid associate to the economic growth in Tanzania? The purpose for this paper is to understand how effective foreign aid is on Tanzania’s economy but also to understand what role aid can have on recipient countries. To be able to analyze this, a cross sectional analysis was done on 6 Sub-Saharan African countries including Tanzania over the time period of 1980-2017. Previous studies discussed the effectiveness of foreign aid on the economy, thereby our theoretical framework suggests foreign aid could be used as tool to increase economic growth through different factors of growth such as investments and capital. Our results conclude that foreign aid have a negative association on the economic growth in Tanzania. Although other variables such as corruption showed significant association on the economic growth.
Table of Contents
1. INTRODUCTION 1
1.1 DEFINITION OF FOREIGN AID 2
1.2 FOREIGN AID’S HISTORY 2
1.3 TYPES OF AID 2
1.4 SUB-SAHARAN COUNTRIES HISTORY WITH FOREIGN AID 4
1.5 TANZANIA’S HISTORY WITH THE AID 5
1.6 HISTORY OF CORRUPTION AND NET ODA IN SUB-SAHARAN AFRICA 5
1.7 PROBLEM 6 1.8 PURPOSE 7 1.9 DELIMITATIONS 7 2. THEORETICAL FRAMEWORK 8 2.1 TWO-GAP MODEL 8 2.2 SOLOW MODEL 10 2.3 PREVIOUS STUDIES 10
3. METHODOLOGY AND DATA 14
3.1 COBB-DOUGLAS 14
3.2 GRANGER CAUSALITY TEST 14
3.3 UNIT ROOT TEST 15
3.4 METHOD 16
3.5 CHOSEN VARIABLES AND THEIR DESCRIPTION 17
3.6 DESCRIPTIVE STATISTICS 20 3.7 CORRELATION 21 4. RESULTS 22 5. ANALYSIS 25 6. CONCLUSIONS 27 7. REFERENCE LIST: 29
1.
Introduction
Foreign aid is a heavily discussed topic by many scholars however its impact in the developing countries remains still unclear. While some scholars discuss aid is necessary for the recipient countries to increase their economic growth. Others may argue that it does more harm on some of the recipient countries due to weak governance. Foreign aid is a financial aid given by governments, international organizations, global and regional unions to assist the development of developing countries. This paper creates a linkage between the research done and the practice by making a precise description of how the effects are derived. It further analyzes the economic development of Tanzania in the last 30 years in terms of Foreign Direct Investment (FDI) inflows and the amount of Official Development AID (ODA) given each year .
To begin with, Tanzania has been one of the largest recipients of aid in Sub-Saharan Africa. In 2010-2011, approximately 33% of government spending was financed by foreign aid; however, the value of donor financing has dropped to 14% in 2014 and to 10% in 2016 Development Group (DPG,2014).This report explains that the positive outcomes of aid on Tanzania’s economy has led the country to become less dependent on aid. This further implies that the country’s experience with financial aid has led to an improvement in the country’s economic performance making it inquire less financial assistance. In addition, if a developing country receives large amounts of aid for a long period of time without its economy improving and decreasing the aid flows, it’s an indicator of high corruption or inefficiency of the aid policies. However, aid
management in Tanzania is guided by the Joint Assistance Strategy Tanzania (JAST) that plans, tracks and reports the process of receiving the aid to ensure transparency and effectiveness of the aid (Worldbank 2007).
One of the main reasons that led to Tanzania’s attainment with foreign aid was that it was less prone to any corruption. The Tanzanian government had the incentive to improve the country’s economic situation, by promoting its openness to foreign assistance unlike its neighboring countries where corruption exists within their governments and does not have an upright system. The reasons mentioned above are
sufficient to proclaim Tanzania’s economic potential which further advocates Tanzania as a suitable candidate for our study of how effective foreign aid on the economy is.
1.1 Definition of foreign aid
Foreign aid is money, equipment, or services that are provided for people, countries or organizations that need them but cannot provide them for themselves (Cobuild, 2019). The world consists of both developing and developed countries. Therefore, aid enhances the collaboration between these countries in a way that help the developing ones. Aid can be explained and delivered in many ways as it serves different causes and attains different outcomes. Foreign Aid is mainly distributed by technical and financial assistance which are devoted for endorsing the economic and social journey for the developing economies. Yet, this occurs efficiently under the assumption that the government in the recipient country does not utilize their power into their own benefits and no corruption exists (“Development aid - New World Encyclopedia", 2019).
1.2 Foreign aid’s history
The history of foreign aid started with the Marshall plan when in 1947, suggested to support the European countries after the end of the World War II. Therefore, that was seen as the first humanitarian act towards the countries that would be recognized as “third world” (Eichengreen, Uzan, Crafts & Hellwig, 1992).This aid program becomes an American and European cooperation where the resources from the United States where complementing the local sources in Europe. Despite the fact that aid has been an ideology during colonization, it solidly began to develop when the World Unions and Organizations were created towards the end of world war II. The United States was considered the major country to implement such a strategy of helping the developing countries by being a source of aid.
1.3 Types of aid
The foreign aid could be bilateral where it is given from one country directly to another or it could be multilateral where it is given from donor countries to international
Thereafter, it could be distributed through World Bank or United Nations agencies among the recipient countries . However, the type of aid could differ depending on the conditions and purpose the aid is required to fulfill (Foster & Leavy, 2019).
For instance, the types of aid could be:
Balance of payments support: This type of aid is a balance of payments assistance
where it allows finance support of a program of policy reform measures that is done by the government with International Monetary Fund (IMF) and World bank. Its aim is to correct the problem of debt, trade imbalances and exchange rate overvaluation.
Aid Funded Debt relief: The main effect of this aid is to help the country’s
government to reduce the amount of obligations which government is expected to meet in future which has a positive effect on its economy.
Project aid using government aids: This type of aid provides specialized earmarking
of expenditures to a set of activities which are sufficient to the objectives, inputs and outputs required to achieve them (Foster & Leavy 2019). World Bank projects are often implemented this way despite the additional support of expenditure that might be needed by the government to accomplish them.
Project aid through NGO/private providers: Non-Governmental Organization
(NGOs) play a major role in the international aid community such they translate private and corporate funding into humanitarian projects overseas. They are also considered important recipients of official government funding such as United States Agency for International Development (USAID) and world bank.
According to our data collection, Tanzania has been receiving official Development Aid is considered as flows to developing countries and multilateral institutions aid given by official institutions and DAC countries (OECD,2019). The type of aid it receives include foreign direct investment where the FDI flows originate from the Development Assistance Committee’s countries and project aid through private providers. The average amount of aid it received from private providers from 2008 to 2017 was equal
to 166.6 million US dollars and the average amount of FDI it received as an aid was equal to 130.9 millions US dollars (OECD,2019)
1.4 Sub-Saharan countries history with foreign aid
Sub- Saharan Africa (SSA) have been receiving about US$ 39,48 billions in foreign aid since 1970s and many scholars argue that most of these countries are becoming more dependent on the aid rather than seeing a progress in their economic growth. This raises questions about how the association of aid is in practice.
A paper by Mallik (2008) argues that early economists believe the low to non-existent economic growth is due to the lack of capital and foreign exchange constraints, therefore financial aid can help fill these gaps to gain economic growth. Furthermore, when Burke and Ahmet (2006) analyzed the South east Asian countries, in particular Thailand, Indonesia and Philippines impact of the financial aid in their economic growth between the time period 1970-2000. They reached inconclusive results as the aid did not have a significant effect on economic growth for these countries. There have been many economic programs driven by multilateral agencies and donors, to contribute to the economic growth of the countries in SSA and specifically Tanzania. This was done in the hopes of assisting the SSA countries to move away from poverty, political instability and gain financial prosperity. The IMF and World Bank have used donor programs in Tanzania in order to improve the macroeconomic framework in the country. These programs usually increased the financial aid and debt reliefs (Burnell,1998).
This makes the association of aid an interesting topic to study, specifically, the Sub-Saharan Africa. The main reason we chose that region was because it caught our interest how most of these countries are still considered low income economies despite of the huge amount of aid they have received throughout the decades.
1.5 Tanzania’s history with the aid
Tanzania had extensive control policies established during the late 1960s through the
mid-1980’s which led Tanzania’s economy to experience declines in most of its sectors. Tanzania’s history with financial aid started with the economic crisis in 1979-85, coupled with shortened foreign aid inflows, the government of Tanzania realized that it had to institute and implement economic reforms, the most successful of which was the economic recovery program which started in 1986. Associated with the implementation of the reforms was a massive inflow of foreign aid that jumped, in real terms, from US$ 266.20 million in 1985 to US$ 522.27 million in 1992 (Nyoni, 1998).The net annual inflows of net official development assistance to Tanzania increased from an average of US$ 316 million during 1967-85 to US$ 1 billion during 1986-93.
1.6 History of corruption and net ODA in Sub-Saharan Africa
Looking deeper into the relationship between the economic growth and the inflows of foreign aid, we analyze that Tanzania’s history with these two variables shows that there is a positive relationship between them. For instance, looking at both variables of net Official Development Aid per capita and Tanzania’s GDP per capita and how the net ODA increased drastically in 1988 without hurting Tanzania’s economy, however Tanzania’s GDP increased from 0.163% in 1989 to 3.692 % in 1990 showing that the country’s recipient of aid does not negatively impact the economy. Whether the effect of the aid is positive or neutral depends on other factors such as how the country has used the aid and the country’s corruption index during that period. In addition, in Kenya the GDP was -0.472 % in 1999 with a 10.171 net ODA per capita however the net ODA per capita kept increasing every year after that until it reached 73.76 in 2013 along with a GDP improving up till 5.4% in 2010. This further implies that Kenya’s economic response to the net ODA is similar to that of Tanzania’s but with respect to other factors that play a role in this positive outcome.
Comparing it with other countries, we can find that the relationship between financial aid and the economic growth could be different than the one in Tanzania. For example, Nigeria’s economy has always been going through fluctuations that was not in its favor,
looking at the country’s history with financial aid, the country was not receiving much of financial aid until 2008. However, the country managed to receive 80.16 net ODA per capita which was considered a big amount compared to what it was in 2003 (2.348). Despite the increase in the country’s aid inflows, the country’s economy only worsened leaving the country GDP per capita to be equal 1.476 in 2012. This shows that the aid’s impact on the economy could have different outcomes which rely on various factors such as corruption and the restrictions applied to the aid usage (World Bank, 2018).
Moreover, the Sub-Saharan Africa is known for having high corruption, the region’s average CPI is 32/100 which is considered high when compared to other regions. This might be one of the main obstacles for the region’s countries to benefit from the amount of aid it receives. On the other hand, the CPI differs from one country to another. For instance, Nigeria’s CPI varies between 12 to 27 whilst compared to Tanzania that has a higher CPI which varies between 22 to 36 making it a better candidate for receiving aid (Transparency International, 2019). This could further explain the reason that Tanzania’s economy has been responding better to the aid inflows it has been receiving while countries such as Nigeria may not.
1.7 Problem
Geographically, the sub-Saharan African region has high levels of corruption and contains many of the poorest countries in the world. Therefore, foreign aid can
sometimes lead to more harm than benefit to these countries. Furthermore, by looking at different macroeconomics variables and economic theories, we can analyze this subject deeper. We believe aiming on Tanzania as our main country in this study will be interesting for our analysis. Even though, we will be using other Sub-Saharan countries as examples to illustrate and compare how foreign aid has contributed to their economic growth and Tanzania’s economic growth. Thus, the research question is:
1.8 Purpose
The purpose of this study is to analyze how foreign aid associate to the economic growth in Tanzania. It will contribute to an understanding and knowledge on what impact it has on a developing country’s economic growth. This will be shown by analyzing how the aid can have various outcomes on growth stimulation through the appropriate variables we chose for this study. This study will create a link between the research done and the practice by making a detailed description of how the effects are derived.
Tanzania is considered the shining star of the sub-Saharan Africa (SSA) and one of the emerging markets in the African continent. According to the International Monetary Funds’ (IMF), the average real growth rate of gross domestic product (GDP) of the Sub-Saharan Africa was 1.4% in 2016 and went up to 2.7% in 2017(World bank, 2018) . On the other hand, The United republic of Tanzania has recorded an annual average growth rate of more than 6% over the past decade and maintained its growth rate up to 6.5% in 2017 making it the second fastest growing economy in SSA after Côte d’Ivoire. In addition, by looking into Tanzania’s foreign direct investment we realized that Tanzania has attracted a greater share of FDI inflows in recent years than its regional peers. For instance, Tanzania’s FDI projects increased to 25% in 2015 making it the 10thcountry in
Africa by number of FDI projects. Furthermore, investments in Tanzania account for over 30% of the country’s GDP and this ratio is expected to increase following the government’s encouragements to increase international investments and ODA projects that have efficient long run impacts on the economy (DPG, 2014).
1.9 Delimitations
In the region Sub-Saharan Africa, there are over 45 countries that might require
different developing programs to improve their weak economic performance. One of the main reasons that causes the weak economic performance of the Sub-Saharan Africa is how many of its countries endure drought, ethnic wars, diseases and high levels of corruption (Oketch,2006). This was a challenge for our study since these pernicious factors differed from one country to another. Therefore, it was hard to establish concrete conclusion without acknowledging that these factors might impact the variables which further alter the results of the study.
Moreover, another limitation would be how the impact of foreign aid is often portrayed as long-run effect on the economic growth of a country. For instance, the amount of ODA a country receives and its impact on the country’s real GDP might not be seen instantly. This is due to the constraint of the time it takes to contribute to the
endowments of economic growth such as investments and human capital. ODA can also be measured as FDI projects where the outcomes cannot be seen by this study’s
timeframe.
2. Theoretical Framework
The relationship between developing economies such as Tanzania and the aid received has been debated since the 1960s. Therefore, the debate about the effectiveness of aid goes back to the economist’s RF Harrod and ED Domar in 1930s who discussed on how investments and savings affect the economic growth of a country. The Harrod Domar model explains how the economic growth in a country might increase by the productivity of capita to output ratio and national saving. Furthermore, the model suggests an increase in domestic savings or an improvement in the quality of labor, shall result in economic growth (Bacha, 1990). However, many of the low-income economies such as Tanzania lack sufficient funds in domestic savings and the development aid is often used to support the consumption or relief debts. The Harrod-Domar model implies, that a country that increases savings would increasing their investments which gives the country a higher capital stock that leads to economic growth, ceteris paribus.
2.1 Two-gap model
An extension of the Harrod-Domar model is the two-gap model, that emphasizes more on the investment gaps hindering countries from economic growth. The two-gap model has an assumption that the gaps are either going to be binding or dominant for any
to import capital goods. The savings constraint is when there is a gap between the capital inflows and domestic savings. This constraint between the investment and savings can be written as, where I denote investments is less than F denote capital inflows plus sY denote domestic savings.
I≤ 𝑭 + 𝒔𝒀 (1)
The second constraint is referred to as the foreign exchange, when an economy is low on foreign reserves caused by the low value on export earnings, might be inadequate to support the level of growth that is required for the country to gain economic growth. Todaro and Smith (2009) many developing economies have a dominant foreign exchange constraint as they have an abundance of labor and domestic resources but require external finance assistance. Where m1 and m2 denote the marginal import share
and E denote is the level of exports.
(m1 -m2)I + m2Y- E≤ F (2)
The foreign exchange gap can be filled by imported investments, in combination with domestic investment resources. Bacha (1990) emphasized on the great impact aid has on investment and concluded that it is easier to relax the foreign exchange constraint rather than the savings constraint. Because of the foreign exchange constraint are low on foreign reserves then the domestic resources are underutilized, hence investment is then aid plus the unutilized domestic resources which would give the country enough “push” to gain economic growth. However, this only holds if the foreign exchange constraint is binding therefore the aid can be in form of imported capital goods which would increase investment.Bacha (1990) emphasized on a “three gap model” the third gap being fiscal deficit gap, which arises when countries are highly indebted developing countries. The gap indicates an existent inefficiency in revenue allocation.
This theory is using the gap approach to explain that with sufficient aid would relax the binding constraint then growth could increase. However, it is important to understand that the relationship is more complicated in reality than theory hence if the aid is not
apparent (Morrissey, 2001).By filling these constraints through aid, the theory believes it can boost investments and lead to growth. However, these models are very simple and are often criticized on whether aid really affects growth as explained in theory.
Furthermore, in this case developing countries may encounter repayment issues when borrowing money to fulfill their savings constraint.
2.2 Solow Model
Growth models have started with the neoclassical models (Solow and Swan) in the 1960s and relied on capital and labor. In neo-classical growth models FDI is seen as a part of the foreign aid which increase the capital stock and finance capital formation contributing to economic growth. For instance, foreign investment has the ability to influence the growth factors such as labor (L), physical capital (C) and technological progress(K). Although these models predict only a short run effect on economic growth, due to the diminishing returns of capital, FDI is assumed to have a positive impact on economic growth both in short and long term.(Herzer, Klasen, Howak-Lehmann, 2008, pp. 793-910).
2.3 Previous studies
The subject financial aid has met a lot of skepticism and heavily discussed whether it actually promotes social and economic development. Mostly, because since the 1970s, over $300 billion has been given to financial aid and still regions such as Sub-Saharan Africa have difficulties with catching up growth.Therefore, it remains a subject that has many different outcomes and controversial ("Humanitarian aid versus development aid | The New Zealand Initiative", 2019).
The European commission has also discussed on the development department goal is to reduce total poverty by various ways. Although there is been progress by global poverty has decreased by half the size it was in 2015. The European commission believe that financial aid alone is not sufficient to end total poverty. Therefore, for the 2030 millennium development goals to run smoothly, it will require effective institutions, good political governance in combination with social and economic peaceful societies
Rajan and Subramanian(2005) concluded in their cross-sectional study, that there was no evidence of foreign aid positive impact on economic growth. The results obtained from this study does not necessarily state aid functions better with good policies nor does it deny. They found little evidence on this matter. furthermore, despite their success in correcting the bias in the OLS estimations that is present when looking at the negative effects of aid with growth. There is still little evidence on aid’s positive
contribution to economic growth. The reasoning behind foreign aid negative effects on growth is due to countries that receive aid after having natural disasters. They also discussed the different kinds of aid are fungible and discussed the parallel effects on growth. Strategic aid was analyzed across countries such as Indonesia, Chile, Israel where the growth has thrived, equally strategic aid on for instance Ghana and Kenya has not experienced strong growth. Therefore, the effect of aid cannot be generalized. To sum up, the study states for aid to be effective the process have to be clearly thought out of, that is from distribution of aid, recipient countries requirements and conditions and so forth. They found that aid in physical capital accumulation might be more effective, hence how the usage of aid will determine the amount of growth.
Studies show that financial aid acts as an essential catalyst for developing economies as it provides with the money supply needed to enhance productivity in these countries. Developing countries have natural resources that when used efficiently can boost its small economies however, they don’t have the sufficient funding for these resources to be used. For instance, different types of capital contribute to a country’s development therefore, financial aid can be an essential tool for developing countries that lack the capital needed for that economic development. There are six different types of capital that are major for the production of growth in which the financial aid can be invested in such as: human capital, physical capital, infrastructure, natural capital, public and institutional capital and knowledge capital (Sachs, 2006).
Recent discussions among donor institutions on how to raise development finance have emphasized the importance of using aid for leverage purposes, in order to optimize its impact (United Nations, 2003). Practical ways for aid agencies to encourage investment are through guarantees for private sector borrowing and through public-private
capital and the private sector are key players in balancing investment risk and
development needs. The country knowledge amassed in aid agencies can also be used to reduce perceived risks by investors. Such usage of aid money includes improved
information about the recipient state and introduction of a business climate (rules, practices and systems) that is familiar to the source country firms (Kimura and Todo, 2009). Aid projects proven to make a difference may be scaled up by soliciting private capital, allowing good projects to have a larger impact in these developing countries (United Nations Conference Trade And Development , 2014).
Burnside and Dollar(1997) argued the gains of foreign aid in relation to economic growth is fully utilized when the recipient countries have good policy environment. Their conclusion was inappropriate government policies may decrease the productivity of investments and reduce the incentives for savings. Which harms the effectiveness of aid, Burnside and Dollar (1997) basically conclude that poor macroeconomic
performance. However, the results from their study, agreed with many other authors, that on average there was no significant relation between aid and economic growth.
Kosack (2003) found a strong positive relation between the quality of life whereby aid when the recipient country had a democratic rule. (Kosack 2003) analyzed the aid effectiveness through the quality of life, aid effectiveness is measured usually through the GDP per capita growth. Because, an increase in income does not necessarily improve the quality of life. However, even if there is a significant increase in income per capita, it does not describe the distribution of income. The quality of life might still be very low for the majority of the population. On contrary, a low income per capita that is spread evenly and invested in resources to develop education and healthcare, it would increase the income which would raise GDP per capita. To sum up, Kosack (2003) main finding was quality of life increased with aid in a democratic regime while it decreased in autocratic regime. Although, this study is narrated in the past it is still valid, as it shows the different requirements where aid has been effective.
game theory in his discussion of growth and foreign aid. The study concluded that there is no positive impact on economic growth based on aid. (Knack 2000) found in his study that with as the aid inflows increases the quality of governance decreases therefore bureaucracy and corruption can negatively affect the growth process in a country.
Several studies have shown that for development aid is most efficient when combined with policies such as good governance, low corruption and lower infant mortality. Therefore, if it has a weak governance it will more likely have a weaker or/ nonexistent result in health, education and infrastructure. This would result to inefficient outcomes of the development aid (Wolfensohn, world bank 2002).
(Easterly et al., 2003) used a larger sample size and reexamined Burnside and Dollar’s study and reached different conclusion. (Easterly et al., 2003) emphasizes on how aid is not ineffective, but it is making a limited claim. They believe by adding more data the results raise doubts on whether foreign aid and good policy environment is positively contributing to the economic growth in the countries.
In Burnside and Dollar (1997) study in their growth regression models had an interaction variable such as Aid x Policy. They concluded that in 10 out 14 of those regression, that aid does have a positive impact when there is good governance. Furthermore, certain policies that are in place does make a difference in affecting the aid effectiveness. Burnside and Dollar (1997) realized that the positive effect is only detected when the suitable policies are applied in the country.
Bacha(1990) discusses the importance of government fiscal policy for the usage of aid to influence economic growth. Generally, Albiman (2016) realized that in discussing the empirical evidence on the relation between aid and economic growth, some studies found a direct and positive impact on the economic growth. However, in some cases for aid to have an apparent positive correlation with growth, good economic policies are a required criterion. Furthermore, several studies have found no direct relation between foreign aid and the economic growth and some found negative relation between them. Most empirical studies conclude that FDI as a financial aid for developing countries contributes to both factor productivity and income growth in host countries, beyond what domestic investment normally would trigger. Regardless, even where crowding
out does take place, the net effect generally remains beneficial, not least as the
replacement tends to result in the release of scarce domestic funds for other investment purposes. The least developed economies, FDI seems to have a somewhat smaller effect on growth, which has been attributed to the presence of “threshold externalities”.
Imperfect and underdeveloped financial markets may also prevent a country from reaping the full benefits of FDI. Yet, the overall benefits of FDI for developing country economies are well documented. Given the appropriate host-country policies and a basic level of development, a preponderance of studies shows that FDI triggers technology spillovers, assists human capital formation, contributes to international trade integration, helps create a more competitive business environment and enhances enterprise
development. All of these contribute to higher economic growth, which is the most potent tool for alleviating poverty in developing countries (OECD, 2002).
3. Methodology and Data
3.1 Cobb-Douglas
In this paper the Cobb-Douglas production function is used to analyze the effect of foreign investment as an ODA which further impacts the GDP value. The Cobb-Douglas production function used is expressed by the following formula:
Yt= aLtb Ctc (3)
where Y is output; L stands for labor ; C represents physical capital and a represents total factor productivity where the parameters c and b are constants determined by available technology.
3.2 Granger causality test
Granger Causality test is used to check the dynamic relationship between time series variables. It is specifically used to test the direction and magnitude of the relationship between two variables, for instance GDP and other macroeconomic variables such as FDI
values of X can further validate this relationship (Hoover, 2001). Since that, the definitionof Granger-Causality is simply how X Granger-Causes Y, if past values of X can explain or predict variations in Y.
The test is done using the following bivariate regressions for variables X and Y: Yt=β1+∑Pi=1 αYt-1 + ∑Pi=1 µiXt-1 +ɛ1t (4)
Xt= β1+∑pi=1α Xt.-I + ∑pi=1 µIYt-i+ɛ2t (5)
The bivariate regression involves analyzing two variables and detect the relationship between them. For our model, we are using the NETODA and GDP per capita as sour bivariate variables. For equation (4), the null hypothesis that X does not Granger-Cause Y (H0: µ1=µ2=…=µp= 0) is tested against the alternative hypothesis that X does
Granger-Cause Y (H1: at least one µi ≠ 0) As a consequence, if the null hypothesis of no causality
is rejected, then we can say that X does Granger-Cause Y. The same procedure performed for equation (5).
3.3 Unit Root Test
There are several ways to test whether a series is stationary or non-stationary, in our methodology we will be using The Augmented Dickey-Fuller (1981) unit root test is to test the stationarity of the series as shown below:
∆Xt= α+ β1Xt-1+∑p ʎi ∆ Xt-I + ɛt (6)
∆Xt=α+β1Xt-1+β2t+∑pʎi ∆Xt-I +ɛt (7)
Where ∆ Xt= Xt- Xt-1 are the first difference of the series, β1 β2 are constant parameters,
ɛt is white noise error term, it is time or trend variable and p is the number of lagged
variables.
This is achieved under assumption that a unit root exists (i.e. the series are nonstationary); the null hypothesis states that the series are nonstationary (H0:β= 0) and the alternative
hypothesis states that the series are stationary (H0: β< 0). If the calculated statistic is
higher than the critical value, then we do not reject H0 and the variable is nonstationary.
3.4 Method
In this study to analyze the association of foreign aid to Tanzania ‘s economic growth we chose to applicate a panel data analysis where we looked at several variables and observed them over multiple time periods. The time frame chosen for this study is 1980-2017. We chose this time frame as it would be the most reliable and significant data that exists. It captures Tanzania’s recent growth after the economic policy changes post economic crisis. While the regression model used is the fixed effects model. The data used is secondary data from world bank. The dependent variable is GDP per capita and the independent variable that we are interested in is the foreign aid. We began with analyzing the impact of net official development aid (foreign aid) as our only explanatory variable and our dependent variable is GDP per capita, thereafter adding additional variables. An issue that is common when using time series is that we encounter a non-stationary process. That is because the variance changes over time so it could be more prone to a spurious relationship between the two variables, when they are regressed on each other (Granger & Newbold,1974). The solution to this problem would be to take the first difference or log of the variables that are non-stationary to make them stationary. For this study we chose to focus on the economic growth in Tanzania as previously mentioned, we will use other sub-Saharan countries as examples and to emphasize on the accuracy of our analysis of the foreign aid in the economic growth. Thereafter we chose 5 sub-Saharan countries that are mostly regionally related. These countries are considered Sub-Saharan countries and 3 of them are neighboring countries to Tanzania. Reasoning behind these countries was based on data availability and reliability as well as somewhat similar economic situation. By analyzing different countries, we hope to reach more concise understanding of the effect of foreign aid on the economic growth in Tanzania.
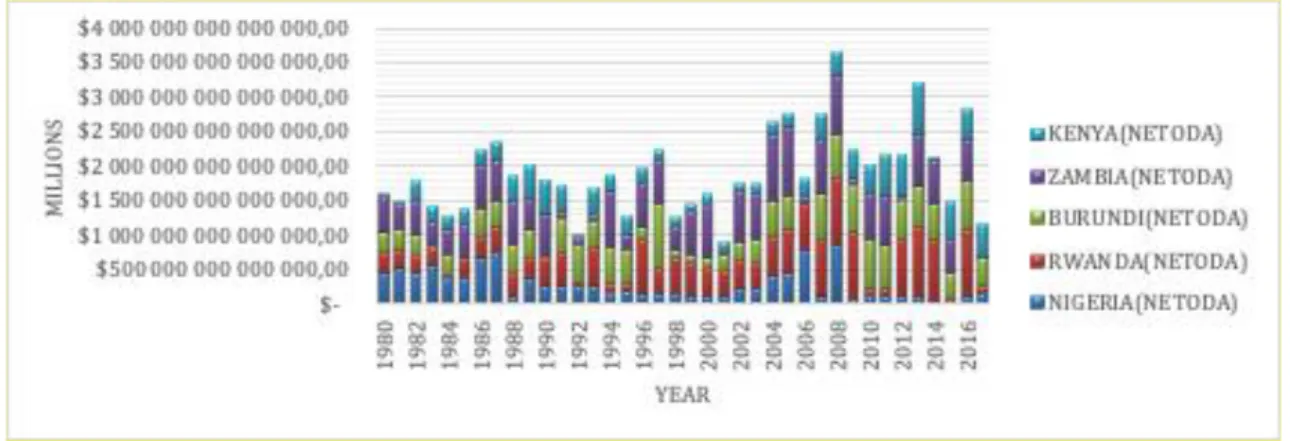
Figure 1. NETODA for the countries in the analysis, during the time period 1980-2017. Retrieved from Dataworldbank.
Figure 1 illustrates the amount of net development assistance the chosen countries have received in current US dollars from the 1980 to 2016.
Figure 2.Correlation graph: GDP per capita and NET ODA per capita in Tanzania over the time period
of 2000-2015. Retrieved from Databank.
Figure 2 explains the correlation between the official development assistance per capita and GDP per capita, we chose time span to be between 2000-2015 because we wanted to have a clear outlook on the variable’s interaction. That is affirmed by the recent years.
3.5 Chosen variables and their description GDP per capita
Our regression analysis will use GDP per capita as our dependent variable. Worldbank collects the data for this variable and it will represent the economic growth in this study. We chose to use GDP per capita as our dependent variable due to previous studies and empirical research found it an appropriate variable to measure economic growth. Therefore, it was the most relevant variable to approach our answer.
Net ODA/ per capita
The net official development assistance (ODA) received per capita, is defined as a government aid that it is designed to promote economic development and welfare of the ODA recipient country. It is our variable of interest for this study and is collected by World Bank.The net ODA consists of loan payments in concessional form by the members of the Development Assistance committee (DAC) and by other multilateral agencies and institutions. The net ODA per capita is calculated as the aid divided by the GDP/capita.
FDI inflows (%) of GDP
One of our independent variables is foreign direct investment which describes the net inflows of an investment as a percentage of GDP. It is the sum of equity capital, reinvestment of earnings, other long-term capital and short-term capital. It is also
measured by the world bank annually and we chose to have it as a percentage of GDP to show a simpler calculation of its contribution to GDP. Our study is foreign aid’s effect on economic growth, in theory an increase in capital stock which could be through ODA and FDI investments which further has a positive effect on economic growth. In addition, investments generate economic growth, therefore, we believe that FDI is relevant variable in our regression model.
Corruption perception index(CPI)
Another independent variable included in this regression model is corruption
perception index(CPI) which is an index that is published annually by the transparency International since 1995. CPI shows an index that ranks the countries corruption level in the public sector. The index can take values from 0 to 100, where values close to 0 indicates high corruption state and values closer to 100 describes a low corruption state. Numerous studies have shown that corruption hinders economic growth and that occurs because of the effects on different channels. One of the main channels in which
corruption impacts the economic growth is through the level of human capital and share of investments. As mentioned earlier in the Solow model, that human capital and
world bank Tanzania has been receiving multilateral aid inflows. Therefore, the
corruption index variable is considered vital in our study because it shows how the level of corruption and the type of aid can contribute to a higher efficiency of the aid on the economic growth.
Gross capital formation to GDP
Another independent variable that is added to our regression analysis is the gross capital formation (formerly gross domestic investment) ratio of the GDP. It consists of outlays on additions to the fixed assets of the economy plus net changes in the level of
inventories. This is measured annually by the world bank as a percentage of GDP. In addition, studies such as ( Oketch, 2006) have shown that investment in human and physical capital are vital determinants of economic growth as they contribute to a vital percentage of the GDP. The Solow model mentioned in our theory section explains how capital formation achieves economic growth and how this is attained through its
contribution to Africa’s industrial development. Therefore, this variable is interesting to see as it can describe the domestic capital in the developing country of interest and its essence towards GDP.
Export to GDP
One of the independent variables that is included in our regression analysis is the net export to GDP ratio. This is to control for the export flows that might exist in the GDP. Through investments comes production therefore exports are important variable to increase economic growth in developing countries. The export to GDP ratio that shows a country's value exports is expressed as a percentage of GDP, it is also collected by world bank at annual basis.
Import to GDP
Another explanatory variable that is used in this study is net imports ratio to GDP, which is calculates all the value of imports as a percentage of GDP. This variable is expected to have a negative impact on the GDP, because a high value on imports creates trade deficit while a low value creates trade surplus. World Bank collects this data annually and as a percentage of GDP. The sample years are between 1980-2017, for all the variables.
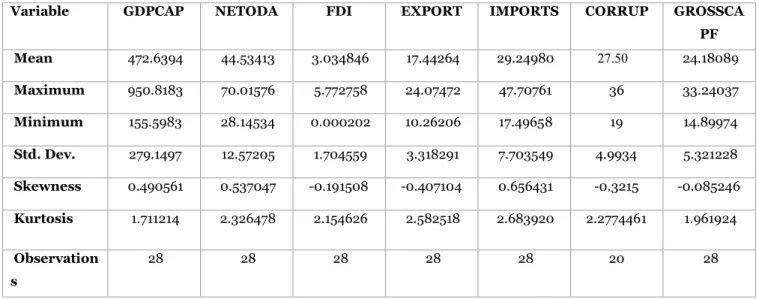
3.6 Descriptive statistics
Table 1 Descriptive statistics Tanzania
The descriptive statistics for Tanzania are shown in table 1, the variable’s values indicate a variety of data available due to the differences between the maximum and minimum values. The skewness of the variables explains how the distribution of the values are located. For Tanzania, the skewness values show normal relation hence the values are around the mean. Furthermore, the kurtosis (Wheeler, 2016) measures the heaviness of the tail in the distribution. The kurtosis of the variables used in this study are roughly around two which displays a leptokurtic distribution. Hence, the distribution of the variables displays normal relation.
Table 2 Descriptive statistics for the chosen countries: Burundi, Kenya, Nigeria, Rwanda, Tanzania and Zambia.
Variable GDPCAP NETODA FDI EXPORTS IMPORTS CORRUP GROSSCAPF Mean 614,1551 42,83852 1,8661 8,53 7,737 27,67585 1,16
Maximum 3221,67 22,245 9,605 1,45 8,89 55 1,47
Minimum 112,8494 0,37924 -1,160 3,87 1,29 10 2,42
Std.Dev. 578,2085 30,11592 2,046 2,06 1,38 9,089 2,26
Observations 220 228 213 203 203 185 98
Based on table 2, there are some outliers in the variables NETODA and GDPCAP due to the large values of their standard deviation. This could be explained due to different
Variable GDPCAP NETODA FDI EXPORT IMPORTS CORRUP GROSSCA PF Mean 472.6394 44.53413 3.034846 17.44264 29.24980 27.50 24.18089 Maximum 950.8183 70.01576 5.772758 24.07472 47.70761 36 33.24037 Minimum 155.5983 28.14534 0.000202 10.26206 17.49658 19 14.89974 Std. Dev. 279.1497 12.57205 1.704559 3.318291 7.703549 4.9934 5.321228 Skewness 0.490561 0.537047 -0.191508 -0.407104 0.656431 -0.3215 -0.085246 Kurtosis 1.711214 2.326478 2.154626 2.582518 2.683920 2.2774461 1.961924 Observation s 28 28 28 28 28 20 28
The amount of observations varies for table 2 due to the lack of available data for all the countries in all the variables.
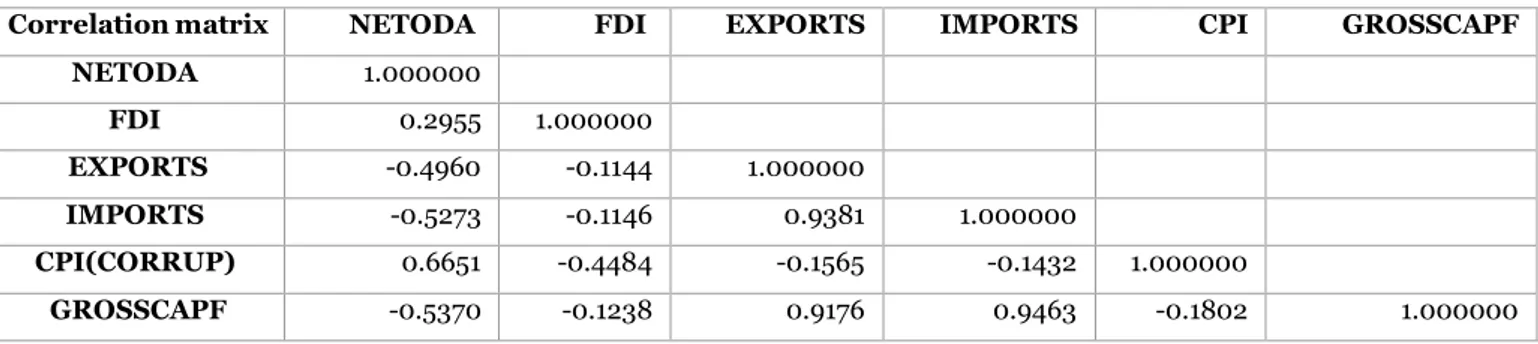
3.7 Correlation
Table 3 a correlation matrix is used to check for collinearity which could possible result in multicollinearity between the independent variables.
Correlation matrix NETODA FDI EXPORTS IMPORTS CPI GROSSCAPF NETODA 1.000000 FDI 0.2955 1.000000 EXPORTS -0.4960 -0.1144 1.000000 IMPORTS -0.5273 -0.1146 0.9381 1.000000 CPI(CORRUP) 0.6651 -0.4484 -0.1565 -0.1432 1.000000 GROSSCAPF -0.5370 -0.1238 0.9176 0.9463 -0.1802 1.000000
According to table 3, the variables GROSSCAPF and NETODA are correlated which could be due to the investments made in the domestic capital originates from the government aid which creates a correlation. Also, we see a slight correlation between the three variables, the exports, imports and GROSSCAPF as it covers major factors in production from both imports and exports. Therefore, using these three variables in the same regression might cause issues of high multicollinearity. Thus, only the full model will include all these variables. The other variable that is also excluded due to its high correlation is corruption (CPI).
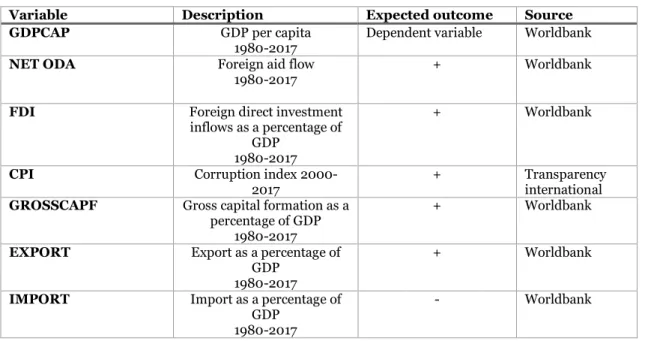
Table 4 Variable definition table and the expected outcome
Variable Description Expected outcome Source GDPCAP GDP per capita
1980-2017 Dependent variable Worldbank
NET ODA Foreign aid flow
1980-2017 + Worldbank
FDI Foreign direct investment
inflows as a percentage of GDP
1980-2017
+ Worldbank
CPI Corruption index
2000-2017
+ Transparency
international
GROSSCAPF Gross capital formation as a percentage of GDP
1980-2017
+ Worldbank
EXPORT Export as a percentage of GDP
1980-2017
+ Worldbank
IMPORT Import as a percentage of GDP
1980-2017
- Worldbank
Table 4 sums up the expected outcome from our chosen variables, thus it is expected for all variables to have a positive impact except imports. The reason why imports has a negative sign is due to it may create a trade deficit. Corruption affects economic growth negatively however it is having a positive sign which is due to the values from the transparency index.
4. Results
We analyzed the Kenya, Burundi, Nigeria, Tanzania, Zambia and Rwanda by conducting fixed effects models. With a fixed effects model, the random variable is treated as fixed. By using the fixed effects model, it allows us to see the variation that occurs over time as well as between the countries.
The estimated model is specified as follows:
GDPCAPit= it+ 1NETODAit+ 2FDIit+ 3EXPORTit+ 4IMPORTit+ 5CPIit+ 6GROSSCAPFit+ 1D1980+…+ 37D2017+ 1C1+…+ 20C20+ it
= time effect ε= error term
Table 5 Fixed effects output
Dependent variable:GDP per capita
Fixed effects models: 1 2 3
Independent variables FE coefficient FE coefficient FE coefficient
Constant 526,2686*** (0,000) 518.5012*** (0,002) 209,5784** (0,053) NETODA '-2,567363** (0,051) -2,617481** (0,045) 0,9747312 (0,463) FDI (% of GDP) -50,68726*** (0,004) -11,73737 (0,415) Exports ( % of GDP) 1,93e-09 (0,235) Imports (% of GDP) 8,48e-09** (0,033) Corruption (CPI) -0,0507262* (0,988)
Gross capital formation 2,42e-08*** (0,000)
Number of observations 220 213 86
Fixed time YES YES YES
Fixed country YES YES YES
Prob >F 0 0 0 R-sq: within 0,616 0,6402 0,9491 R-sq: between 0,1949 0,003 0,6395 R-sq: overall 0,441 0,3827 0,8278 *=Significant at 10% **=Significant at 5% ***= Signnificant at 1%
Based on our results from the correlation matrix, we chose to run 3 models using the fixed effects method. The 1st model has only one independent variable which is the NETODA.
The 2nd model removes all the correlated variables which leaves the model to only add 1
more independent variable which is the FDI, due to the correlation between them two was not abnormal high. To further analyze the relationship, our 3rd model included all the
variables despite the correlation due to estimate the differences in the coefficient of NETODA.
We ran 3 models shown on table 5 using the fixed effects model with GDP per capita as the independent variable. In our 1st model we tested with our variable of interest net
official development (NETODA) is significant and has a negative relationship between GDP per capita and NETODA. If the NETODA variable increases by 1 dollar then the GDP per capita will decrease by approximately 2.56 dollars. To further understand the
relation between these variables, we conducted granger causality test which is presented later on this section.
Moving on to the 2nd model, when the foreign direct investments is added the NETODA
variable still has a negative association with our dependent variable. However, the value of our overall R-square decreases in this model compared to the 1st model. The R-square
is at roughly 38% meaning that the variance in the GDP per capita can be explained by the chosen independent variables. In this model, NETODA and FDI are significant at 5% significance level. The FDI has a negative association on the GDP per capita with the coefficient being of -50.68726. As mentioned earlier, NETODA has a negative association with the dependent variable still, with a coefficient of -2.617418.
Additionally, the 3rd model includes all of the variables presented in this study to measure
the coefficients to the association of economic growth. The results from the model is presented in the table 5. NETODA, FDI and EXPORTS become insignificant while the CPI, Imports and grosscapf are significant in their estimates. Interestingly, the coefficient for NETODA becomes positive which could be caused by collinearity when we include all the variables. The results also show the highest R square among our models with the overall R-square being at 0.8278. meaning that approximately 83% of the variance in the GDP per capita can be explained by the variables included in our 3rd model. However,
that does not necessarily indicate more accurate results.
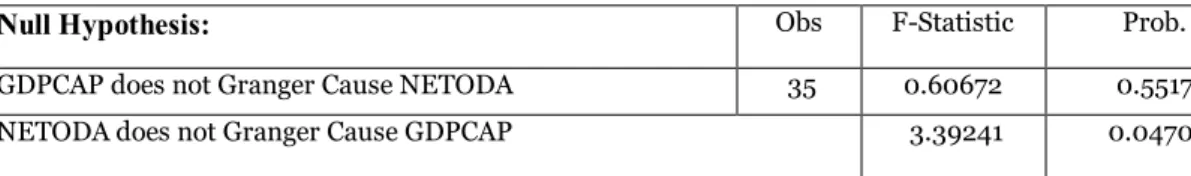
Furthermore, we ran a granger causality test to see whether the variable GDPCAP causes the independent variable of interest NETODA for Tanzania. When using granger test it is important to have stationary variables. By performing a unit root test on both variables, we conclude there were non-stationary therefore by taking first differences we mitigate this problem. Thereafter, we run the granger causality test on the differenced variables to comprehend the causality relation. The estimation output is represented in table 6. The first null hypothesis is GDPCAP does not granger cause NETODA and with a p-value larger than 0.05, we fail to reject the null hypothesis at 5% significant level. Therefore,
Table 6 Granger Causality test
5. Analysis FDI
The variable FDI has a negative correlation with GDP per capita. In our 2ndmodel, the
coefficient for FDI is at -0.568726 which means there at a 1 unit increase in FDI causes the GDPCAP to decrease by approximately -0.568 units. The purpose of FDI inflows could be investments on infrastructure and education which could be contributing to economic growth positively. However, FDI inflows could also have a crowding out effect on the domestic investments. According to the two-gap model discussed in theory section, a gap that could be present in developing countries such as Tanzania is the foreign exchange gap. When foreigners invest in Tanzania for instance through FDI, it has a positive impact seen in our regression and considering the two-gap model if sufficient FDI is raised then the gap can dissolve which contributes to the economic growth in the country.
Corruption
The corruption index is an important variable in this study by virtue of the region being observed. Sub-Saharan Africa is a region that suffers from corruption and thereby its relevance in this study. There is a positive effect of between decreased corruption and GDP per capita which could be due to the values from Transparency Index, due to Tanzania’s low score. Increasing corruption has a negative effect on economic growth and thereby even considered as an obstacle for growth. In our 3rd model, a unit increase
in the value of corruption (CPI) would cause a unit decrease in economic growth by
Pairwise Granger Causality Tests
Null Hypothesis: Obs F-Statistic Prob.
GDPCAP does not Granger Cause NETODA 35 0.60672 0.5517
roughly -0.05. However, this coefficient is only significant at 10 % significance level since the p-value is approximately 0.988.
Export & Import
Exports and Imports variables are major factors in explaining the economic growth of a country since they are components of GDP. As shown in the full model a one unit increase in exports contributes to increase in the country’s GDP per capita by 1.93 units. However, the coefficient is not significant hence, we cannot make explicit
interpretations. Furthermore, a unit increase in imports has a positive effect on the economic growth. This is displayed in the full model where the coefficient of imports shown as percentage of GDP is 8.409 which shows that a unit increase in imports increases the GDP per capita by 8.409 units. The coefficient is significant at 5 % significance level.
Gross Capital Formation
As mentioned earlier in the theory section the Solow model (1957) discuss, capital accumulation contributes to increase the level of production which means that gross capital formation contributes to sustainable economic growth. In our full model, the results show a positive relationship between gross capital formation and economic growth since that a unit increase in gross capital formation increases the GDP per capita by roughly 2.42e-08.
To sum up the results from the econometric testing show foreign aid might have a negative association in these countries. Although, in our full model aid showed positive association with the GDP per capita this could be the results of multicollinearity. The difference in the coefficients of aid between 1st and 2nd model was not a big difference.
But the r- square within increases in the 2nd model to approximately 64% and the p-value
of aid is less than 0.05 so it is still significant. Based on the results, this makes the 2nd
6. Conclusions
In this study, the aim was to see the association of foreign aid in the economic growth of a developing country in particular Tanzania during the time period of 1980-2017. However, to deepen our analysis of the results for the effect of foreign aid, we added 5 additional countries and estimated a fixed effect model.
The final conclusion from this study is that foreign aid has a negative effect on economic growth. It only became positive with the full model however it could be because of multicollinearity. It has been contemplated by various studies that impact of foreign aid might not be substantial on the development of a country’s economy. While, foreign aid has the ability to denote to human and physical capital accumulation. According to the Cobb-Douglas, human and physical capital are tools that contribute to economic growth which further implies that foreign aid assets play a major role in increasing these variables. In addition to that, as noted earlier by Sachs (2006) developing countries have natural resources that when used efficiently can boost their small economies and in consideration of the lack of venture capital in these countries; foreign aid can be used as a mean of funding these resources.
Furthermore, studies such as Burnside & Dollar (1999) have shown that financial aid boosts economic growth, however these effects rely on various factors such as efficient governance and clear policies that cease corruption. On account of the Sub-Saharan region where its countries tend to suffer from high-level of corruption, the effect of foreign aid on the economic development may be interrupted due to the lack of governance caused by corruption.
Since Foreign direct investment is considered capital flows, it should have a positive correlation with economic growth through investments Weil (2013). We did not find this to be true when we added the variable in our 2nd model . However, this could be to
collinearity reasons as it became also insignificant in our 3rd model.
Previous literature and researches state that foreign aid’s effect depends on the recipient country’s ability to appropriately utilize the aid to contribute to the economic growth. Therefore, countries may have to implement policies that can fight problems such as
corruption. In speculative terms, corruption is a deep-rooted issue for many of these countries including Tanzania therefore foreign aid may need to be directed to fight against corruption before boosting economic growth.
Therefore, to research further into the topic of aid efficiency, recipient and donor countries should evaluate the relation of aid to benefit from it to economic growth. In Tanzania as well as other developing countries are in need of investments financed with foreign aid that will lead to long term economic growth.
7. Reference list:
Aid (ODA) commitments to countries and regions [DAC3a]. (2019). Retrieved from https://stats.oecd.org/Index.aspx?datasetcode=TABLE3A
Albiman, M. M. (2016). What are the impact of foreign aid to the economic growth? Time series analysis with new evidence from Tanzania,‘. Business and Economics
Journal, 7(3), 1-7
Bacha, E. (1990). A three-gap model of foreign transfers and the GDP growth rate in developing countries. Journal of Development Economics, 32(2), 279-296.
Burke, P., & Ahmadi-Esfahani, F. (2006). Aid and growth: A study of Southeast Asia. Journal of Asian Economics, 17(2), 350-362.
BURNELL, P. (1998). Foreign Aid in Africa: Learning from Country Experiences, edited by Jerker Carlsson, Gloria Somolekae and Nicolas van de Walle. Uppsala, Nordiska Afrikainstitutet, 1997. The Journal Of Modern African Studies, 36(2), 333-356. doi: 10.1017/s0022278x98342792.
Choong, C., & Lam, S. (2011). Foreign Direct Investment, Financial Development and Economic Growth: Panel Data Analysis. IUP Journal of Applied Economics, 10(2), 57-73.
Dickey, D., & Fuller, W. (1981). Likelihood Ratio Statistics for Autoregressive Time Series with a Unit Root. Econometrica, 49(4), 1057-1072.
Easterly, William and Levine, Ross Eric and Roodman, David, New Data, New Doubts: A Comment on Burnside and Dollar's "Aid, Policies, and Growth" (2000) (July 2003). NBER Working Paper No. w9846. Available at SSRN:
https://ssrn.com/abstract=425582
Eichengreen, B., Uzan, M., Crafts, N., & Hellwig, M. (1992). The Marshall Plan: Economic Effects and Implications for Eastern Europe and the Former USSR. Economic
Policy, 7(14), 13. doi: 10.2307/1344512
Engle, R. F. and Granger, C. W. J. (1987). “Cointegration and error correction: representation, estimation and testing”, Econometrica, 55,251-276.
Foreign Direct investment, Maximizing Benefit and Minimizing Costs. (2019). Retrieved from https://www.coursehero.com/file/p32kp1p/OECD-2002-Foreign-Direct-Investment-for-Development-Maximising-Benefits/
Foster, M., & Leavy, J. (2001). The Choice of Financial Aid Instruments Mick Foster and Jennifer Leavy Centre for Aid and Public Expenditure. Retrieved from https://www.odi.org/sites/odi.org.uk/files/odi-assets/publications-opinion-files/2065.pdf Granger, Clive. (1969). “Investigating Causal Relations by Econometric Models and
Granger, & Newbold. (1974). Spurious regressions in econometrics. Journal of
Econometrics, 2(2), 111-120.
Griffin, K. (1978). Foreign capital, domestic savings and economic development. In International Inequality and National Poverty (pp. 57-80). Palgrave Macmillan, London.
Hoover, Kevin D. (2001) Causality in Macroeconomics: Cambridge: Cambridge University Press.
Kaijage, F. (1993). AIDS control and the burden of history in Northwestern Tanzania.
Population and Environment, 14(3), 279-300.
Kosack, S. (2003). Effective Aid: How Democracy Allows Development Aid to Improve the Quality of Life. World Development, 31(1), 1-22.
Lofchie, M. (1978). Agrarian Crisis and Economic Liberalisation in Tanzania. The
Journal of Modern African Studies, 16(3), 451-475. Retrieved from
http://www.jstor.org/stable/160037
Mallik, G. (2008). Foreign Aid and Economic Growth: A Cointegration Analysis of the Six Poorest African Countries. Economic Analysis and Policy, 38(2), 251-260.
McNeese, B., ven, A., McNeese, B., McNeese, B., McNeese, B., & Best, K. et al. (2019). Are the Skewness and Kurtosis Useful Statistics? | BPI Consulting. Retrieved from https://www.spcforexcel.com/knowledge/basic-statistics/are-skewness-and-kurtosis-useful-statistics
MM, A. (2016). What is the Impact of Foreign Aid to the Economic Growth? Time Series Analysis with New Evidence from Tanzania. Business And Economics Journal, 7(3). doi: 10.4172/2151-6219.1000237
Morrissey, O. (2001). Does aid increase growth? Progress in Development Studies, 1(1), 37–50. https://doi.org/10.1177/146499340100100104
Nyoni, T. (1998). Foreign aid and economic performance in Tanzania. World
Development, 26(7), 1235-1240.
Oketch, Moses O. (2006). Determinants of Human Capital Formation and Economic Growth of African Countries. Economics of Education Review, 25(5), 554-564.
Rahnama, M., Fawaz, F., & Gittings, K. (2017). The effects of foreign aid on economic growth in developing countries. The Journal of Developing Areas, 51(3), 153-171.
Sheikh Ahmed, Z. (2014). The effect of foreign aid on economic growth : A cross section study on aid to Sub-Saharan Africa (Dissertation). Retrieved from http://urn.kb.se/resolve?urn=urn:nbn:se:sh:diva-25257
Tanzania development partners group (DPG). Joint assistance strategy implementation report for Tanzania 2006-2011. JAST Report 2013. http://www.tzdpg.or.tz/fileadmin/documents/external/national_development_framework
s/JAST_Implementation_Report_FINAL.pdf?fbclid=IwAR2IrucGn-qEqZy8M3UyEw4pbLVK4T-pk67tkkTTQvHpYQObblA3jqaACVI
Tanzania development partners group (DPG). Aid management platform: analysis of ODA report for FY 2012/13. External finance aid programming, coordination and
monitoring, August 2014.
http://www.tzdpg.or.tz/fileadmin/documents/external/Aid_Effectiveness/AMP/MoF_O
DA_report_for_FY_2012-13.pdf?fbclid=IwAR0Qs55bHEUhor_eV1kfbm8L9Q5_Zbjf7Vr_PNzzQqfRGyezjsftna 8yEqk
Weil, David N. Economic growth, 3. ed. Pearson Education Limited, Harlow. 2013 World Bank. 2007. Tanzania - Joint Assistance Strategy (English). Washington, DC: World
Bank.http://documents.worldbank.org/curated/en/509471468117833481/Tanzania-Joint-Assistance-Strategy
Websites:
Development aid - New World Encyclopedia. (2019). Retrieved from
http://www.newworldencyclopedia.org/entry/Development_aid
Humanitarian aid versus development aid | The New Zealand Initiative. (2019). Retrieved from
https://nzinitiative.org.nz/reports-and-media/opinion/humanitarian-aid-versus-development-aid/
The 2030 Agenda for Sustainable Development - International Cooperation and Development European Commission. (2019). Retrieved from
https://ec.europa.eu/europeaid/policies/european-development-policy/2030-agenda-sustainable-development_en
http://www.ecostat.unical.it/Algieri/Didattica/Economia%20Internazionale/mate