322 A
O
1987
Study of literature on secondary
and feeder roads in developing
countries with particular
refer-ence to Africa
Hans G Johansson
Veg-och Trafik-
Statens vag- och trafikinstitut (VTI) * 581 01 LinkGping
[SSW 0347-6030
VTIrart
322A
1937
SWEROAD
Swedish National Road Consulting AB Subsidiaryto
Swedish National Road Administration
Study of literature on secondary
and feeder roads in developing
countries with particular
refer-ence to A frica
Hans G Johansson
em
_
Vag-06/)
Statens vé'g- och trafikinstitut (VT/l - 58 1 01 Linkb'ping
'l StltlltBt Swedish Road and Traffic Research Institute - 5-581 01 Linkeping Sweden
PREFACE
The Government of Zimbabwe through the Ministry of Transport ("MOT") decided two years ago to go ahead with a Secondary and Feeder Road Development Programme ("SFRDP"). The Government then re-quested the Swedish International Development Authority ("SIDA") to finance a project formulation mission to be conducted in 1986.
The project formulating mission has been carried out in different main parts. One part was a study of the literature on low cost roads in developing countries. The literature available on the subject is
exten-sive and it has therefore been necessary to make a selective study.
The mission has been carried out by the following team: Olle Andersson
(Swe Road/Swedish National Road Administration), Anders Buhrman (Swe Road/Swedish National Road Administration), Carl-Henrik
Ericsson (SWECO), Jan Rogbeck (Swedish Geotechnical Institute, SGI)
and the author. Mr Buhrman, the Project Director, initiated the study of the literature. He has also critically read, made corrections and
additions to it. Mr Rogbeck has written chapter 8 in the study.
The typing of the manuscript was made by Mrs Monica Dahlberg and
Mrs Gunilla Sjoberg at VTI. Mr Christer Tonstrom, VTI, made the
photographic work. The language was revised by Mr Brinley Evans, KM. A draft of the literature study from July 1986 has been critically read
and annotated by SIDA and its consultants.
To all the persons mentioned and SIDA I wish to express my sincere thanks.
Linkoping September 1987
Hans G. Johansson
CONTENTS Page INTRODUCTION
1 A GENERAL VIEW OF PLANNING, DESIGN AND
CONSTRUCTION OF LOW COST ROADS 1
2 TRAFFIC 3
2. 1 Traffic composition 3 2.2 Traffic volumes 4
2.3 Loading 4
2.4 Speed measurements 7 3 VEHICLE OPERATING COSTS AND TIME COSTS 8 4 CLIMATE, TOPOGRAPHY AND GEOLOGY 13 5 PAVEMENT DESIGN l6 6 SURFACING OF ROADS 23 6.1 Surface treatments in general 27 6 .1.1 Primer seal 27 6.1. 2 Surface dressing with chippings 27 6.1.3 Sand seal 28 6.1.4 Surface dressing with graded aggregate 28 6.1.5 Slurry seal 29 6.2 Premixed oiled gravel 30 6.3 Tests on surface dressing in Kenya 31 7 ROAD GEOMETRY 33 7.1 Traffic and design speed 33 7.2 Vertical alignment 35 7.3 Horizontal alignment 37 7.4 Roadway cross-section 39 ' 8 MATERIAL: LABORATORY AND IN-SITU TESTING 41
by J. Rogbeck, SGI 9 ROAD DETERIORATION 61 9.1 General 61 9.2 Paved roads 62 9.3 Gravel roads 62 9.3.1 Gravel loss 62 9.3.2 Surface looseness 66 9.3.3 Surface roughness 68 VTI RAPPORT 322 A
9.3.4 Rut depth 70 10 DUST EMISSION 72 10.1 Loss of material 72 10.2 Methods of dust proofing 74 11 ROAD MAINTENANCE 80
12 CONCLUSIONS 87
REFERENCES 90
INTRODUCTION
It is apparent from the literature that considerable technical expe-rience has been gained through research on the relationship between the design, construction and maintenance of roads in developing countries. Several handbooks based on the results of research and practice have been published. National standards and manuals based on experience and fact have also been produced.
This study was carried out in the following steps: set up of keywords, search of the IRRD and Roadline databases selection of literature from titles and abstracts (in cooperation with members of the project team), and a subsequent review of the subject matter. The output of referen-ces revealed that it was possible and nereferen-cessary to eliminate some old literature not relevant today. However, some important older works have been incorporated in the list of references. Most of the publica-tions used in this study discuss road design, construction and main-tenance in developing countries in Africa.
l A GENERAL VIEW OF PLANNING, DESIGN AND CON-STRUCTION OF LOW COST ROADS
Every country has its own special problems closely linked with its economic and social development, its natural resources and its climate. Transport planning is one of the main problems in the development of a country. The main objective of transport planning is to minimize the total cost of transportation from one place to another. "The role of the planner is to select the actions that implement the designated strate-gies with the least expenditure of the country's resources. The role of a country's technical staff is to execute the individual actions efficiently to further husband the country's limited resources. Planners and techni-cal staff must therefore be aware of the national goals, and the policies and strategies chosen to reach them in order to determine the
appropri-ate investments which will satisfy, but not exceed, the country's
developmental needs" /I/.
Conventional road transport planning includes the following steps: the definition of the transport needs or potential needs of the area(s); the investigation of existing transport modes and costs; the development
and evaluation of alternatives; and the selection of the most economic
alternative.
The alternative chosen will include recommended design parameters
and a selected route or terrain corridor,'varying in width depending on
the topography, known geotechnical difficulities, land utilization, existing infrastructure etc.
During the design stage, alternative alignments will be investigated
further in order to minimize the total costs (which in theory should be
the socio-economic costs) and to suit available construction techniques. The final choice will form the basis for the pre-production planning, where the optimal methods and equipment are selected and timed. During this procedure, a number of decision are taken and as a general
rule it could be stated that the earlier in the chain a decision is taken,
the greater the impact is on the total costs over the life of the road.
As early as the stage where different terrain corridors are evaluated, it may be crucial to have general knowledge, not only of the topography and the existing infrastructure and land utilization, but also a good idea of the soils on which the road will be constructed and the possibilities of finding construction material acceptably close to the alignment. Air-or satellite photo interpretation is a very useful tool fAir-or providing this
information.
In the planning and design stages decisions are taken that greatly
influence not only construction costs, but also construction methods. In
effect the chosen design could, for example, exclude the use of labour based technology or make new equipment and methods less viable than an alternative design, which from the transportation point of view could be equally good.
At the construction stage considerable cost savings could still be made through careful pre construction planning. However, the quantities, the soil conditions and the availability ofsuitable construction materials cannot be but marginally influenced.
2 TRAFFIC
Information on traffic is required for any road project. The planning, the pavement design, the construction of new as well as upgrading of existing roads depends on the traffic composition, the traffic volume and the vehicle loading. Measurements of different traffic parameters have therefore been made in most countries, but in the developing countries the results are seldom published.
2.1 Traffic compositon
In the Kenya road transport cost study /2/, which described the perfor mance of paved and unpaved roads, traffic counts were carried out to supplement the earlier data collected around the country since 1957 by
the Kenyan Ministry of Works. The vehicle classification scheme which
was used is shown in Table 1.
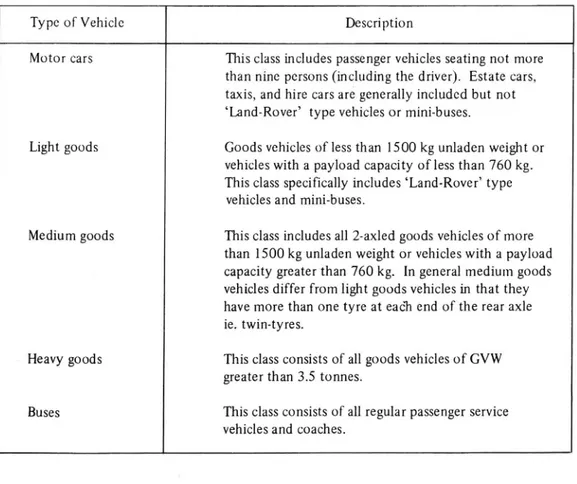
Table 1. Vehicle classification scheme /2/.
Type of Vehicle Description
Motor cars This class includes passenger vehicles seating not more than nine persons (including the driver). Estate cars,
taxis, and hire cars are generally included but not
Land-Rover type vehicles or mini-buses.
Light goods Goods vehicles of less than 1500 kg unladen weight or vehicles with a payload capacity ofless than 760 kg. This class specifically includes Land-Rover type
vehicles and mini-buses.
Medium goods This class includes all 2-axled goods vehicles of more than 1500 kg unladen weight or vehicles with a payload capacity greater than 760 kg. In general medium goods vehicles differ from light goods vehicles in that they have more than one tyre at each end of the rear axle
ie. twin-tyres.
Heavy goods This class consists of all goods vehicles of GVW greater than 3.5 tonnes.
Buses This class consists of all regular passenger service vehicles and coaches.
/3/, /4/, /5/. If the traffic originating from the construction units is
counted, it is recommended that this is done separately. Of particular interest is the number and especially the weight of the heavy vehicles (see below).
In testing the new TRRL Road Investment Model (RTIM) for developing
countries (which uses the costs of construction, maintenance, and
vehicle operation for a road investment as parameters), the model considered separately seven types of vehicles, defined in four classes: passenger cars, light commercial vehicles, buses and heavy commercial
vehicles /6/(compare with above references). It is possible for the
planner using the model to study the traffic growth forecasts and the consequences of different traffic growth functions.
It is interesting to note that in the French design manual for tropical countries described by Ellis /7/ four traffic classes are matched to four basic pavements in the recommendations. The manual is used especially in French speaking developing countries in the tropics.
2.2 Traffic volumes
In many developing countries the problems of maintaining the road network are also increasing as a direct consequence of the growth in traffic volumes. It is therefore necessary to carry out regular traffic counts at selected points. However, to know the volumes of traffic without knowing vehicle axle loads is not enough to draw any firm conclusions of the consequences for road maintenance. The damaging effects of vehicles on pavements and sur'facings depend both on the magnitude of individual loads and on the number of times the loads are
applied /2/.
2.3 Loading
In the research on deterioration in Kenya in 1975 /2/,m it was
discovered that the effect of vehicle loading on the deterioration
pattern of gravel was quite unknown. Researchinto the capacity of low-cost roads for carrying heavy vehicles had then been intensified. During the 1970's and 1980's research in this topic has also been done. Ellis /7/ thoroughly penetratesthe importance of the axle loads on the roads in developing countries.
"In developing countries the rate of growth of traffic loading has been most dramatic. In part this is a reflection of the relatively small number of commercial vehicles that were in use in Third World
countries twenty years ago but it also reflects the absence of effective
control of the weights and axle loads of vehicles in many countries.
Indeed in some countriesthere is no restriction at all on axle loads.
As a result of the high rate of growth of traffic loading in developing countries, it is not uncommon for roads to fail prematurely because the traffic loading in service is several times greater than was assumed in
the design" /7/.
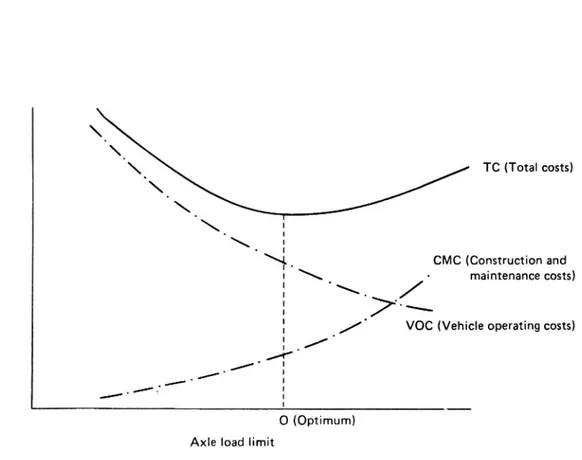
Ellis comes to the conclusion that it is very important to control the upper limit of axle loads. "An axle load of 20 tonnes is roughly 300 times as damaging as one of 5 tonnes". However, it is always of interest for every country, both developing and industrialized, to decide the optimum allowable axle load at which the combined cost of vehicle
operation, road construction, and road maintenance is minimized
(figure 1).
Co st pe r to nn e .\ u a \ E \'L . CMC (Construction and : \ . ' maintenance costs) ' \.
:
'x
: . / ' VOC (Vehicle operating costs)
2./
./' :
/ . / I _ / i. I
0 (Optimum)
Axle load limit
Figure l. The nature of the relation between tonne km costs and axle
load /7/
Studies of traffic loading have also been carried out in the research in
Kenya /3/, /4/ and Ghana /8/. On test sections of some unpaved roads,
measurements of axle loads were carried out using a portable
weigh-bridge /9/. In Kenya the loading was monitored at 4 monthly intervals.
A high proportion of the traffic flow was composed of light goods vehicles with a nominal load av 1 1.5 tonnes, converted to carry up to 40 passengers. Onsome rural roads these vehicles constituted 30 50 per cent of the total traffic. "These vehicles, invariably overloaded, are engaged in a highly competitive business which produces very aggres-sive road user behaviour" /3/. However, there were only small numbers of cars, heavy goods vehicles and buses on the experimental roads. From the load measurements in Kenya, it can be seen that the number of axles exceeding the legal limit (in Kenya, 8 tonnes maximum on a single axle) is minimal and generally less than 2 per cent. Overloaded
vehicles did not influence the rate of deterioration of the roads.
In the highway pavement design procedure in Zimbabwe, the axle load distribution taking each axle as a single entity is determined /10/. The
ADT is determined in terms of E80 (equivalent 80 kN) single axles (see Chapter 5).
2.4 Speed measurements
Measurements of journey times were also made in the Kenya study /3/. The normal traffic over each test section was measured from 8.00 am to 6.00 pm on days at 6 month intervals. If the road carried less than 100 vehicles per day, the measurements were repeated the next day. The results of the speed measurements showed that changes in mean vehicle speed were small. In response to the deterioration of the test sections, there was a slight reduction in speed. Jones' also pointed out that 80 per cent of the traffic was regular. "This signified that many of the drivers were familiar with the different features of the road and this may have considerable influence on the vehicle speed relationship
irrespective of the road condition" /3/.
"In order to be able to assess improvement schemes, estimate road maintenance requirements or set road transport tariffs in developing countries it is necessary to be able to provide accurate information on the costs of operating different types of vehicles on both paved and unpaved roads" /5/. When estimating vehicle operating costs (VOC) nowadays on roads in developing countries, relationships developed in a
Kenya research study /l l/ and a Caribbean study /5/ are used. From the
Kenya research special tables were provided for estimating the VOC
/lZ/. In the tables, vehicle speed and operating costs are related to the
horizontal and vertical alignment of the road. The physical conditions of the road surface (see Chapter 9) are related to vehicle type, price, age and load. The cost components could then be related to the physical operating conditions: consumption of fuel and oil, vehicle maintenance, tyres, vehicle depreciation. In addition to the tables themselves, some examples on the use of them are presented.
In the later Caribbean study /5/ the VOC relationships also included the effects of road geometry and poor bituminous surfaces. The results from the study were compared with the results from the Kenya
research. The comparison of the results is too comprehensive to be
presented here, but two major differences between the two sets of user survey relationships have to be mentioned: "the significantly higher effect on spare parts and tyre consumption of a deteriorating bitu-men-surfaced road compared with a gravel road of the same surface
roughness, and the lower rate of depreciation of heavy vehicles /5/.
The different VOC relationships can be incorporated in the RTIM 2 computer model /l3/. Calculations of road construction costs and predictions of the future condition of a road could then be done. The model estimates the cost of road maintenance and the cost of vehicle operations for each year. It is also possible to obtain the total cost over
the life of a road.
In studying the effect of the road maintenance and the performance of
Unsealed roads in Ghana, Roberts /8/ found that the VOC could be
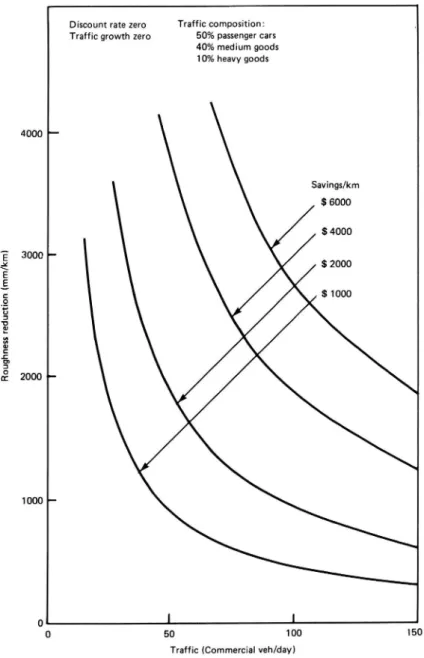
reduced when improvements were made on an unsealed road running surface. Figure 2 shows the expected savings over a year of improve-ment. "For example if the roughness of a road carrying 100 vehicles/day were reduced byan average of 1000 mm/km the savings in user cost
over a year should amount to about $2000 for each kilometre. A
different traffic flow or extent of improvement in the running surface would give a proportionately higher or lower saving as shown by the graphs in the figure".
Discount rate zero Traffic composition: Traffic growth zero 50% passenger cars
40% medium goods 10% heavy goods 4000 ' Savings/km $ 6000 $ 4000 E 3000 '-i $ 2000 E Ec $ 1000 .9 6 3 1: 23 § C .C U) I! a? 2000 1000 o l l 0 50 100 150 Traffic (Commercial veh/day)
Figure 2. Annual saving in vehicle operating cost which may be achie-ved by reducing the roughness of an unsealed running
surface /8/;
Discount rate zero Traffic composition: 18 _ Traffic growth zero 50% passenger cars
40% medium goods 10% heavy goods 15 12 '-2g. Savmgs/km. E 9 _ s 2000 CD .E ' ' $ 1000 $ 500 $ 250 5 i 3 i 0 l l 0 50 100 150 Traffic (Commercial veh/day
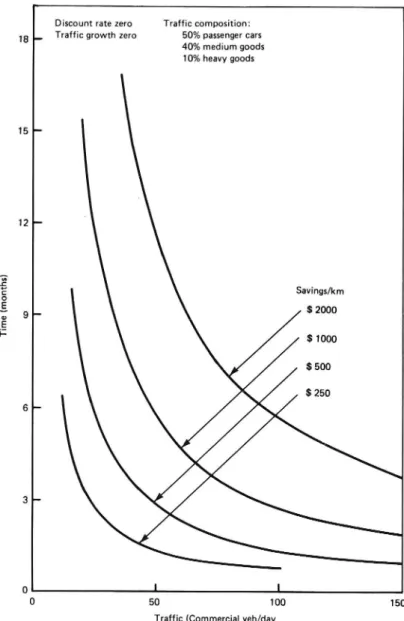
Figure 3. Savings in vehicle operating cost which may be achieved
according to the life of a 2000 mm/km reduction in the roughness of an unsealed running surface /8/.
In figure 3 an alternative approach to saving costs is shown. As an example how to use the graphs, Roberts points out that "on a road
carrying 150 veh/day a saving of over SSOO/km in vehicle Operating
costs should arise if maintenance activity could reduce the roughness of the running surface by an average of 2000 mm/km for two months". The most recent presentation of vehicle operating costs of great
11
interest to Zimbabwe was made by SWECO in the Zimbabwe National
Transport Study (NTS), 1985 /l4/. Based on the Kenya /11/ and
Caribbean /8/ research, and an unpublished study*, the NTS study team
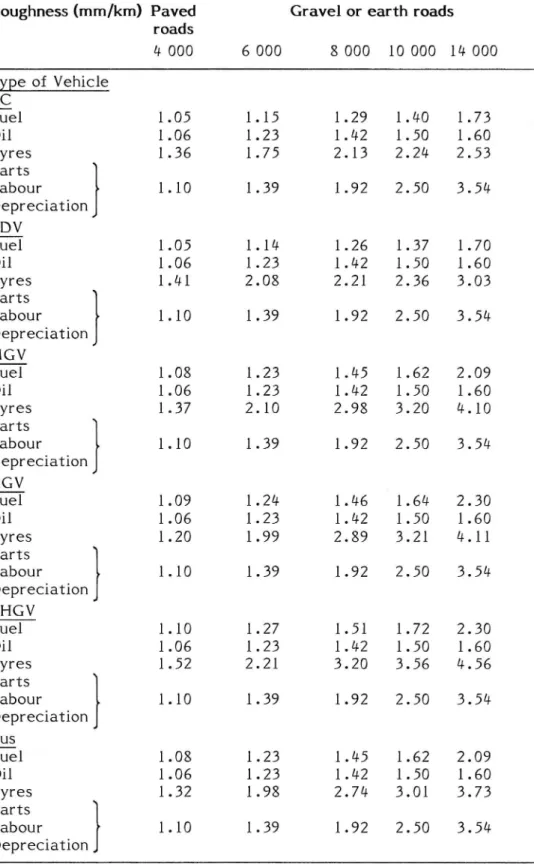
concluded that for six typical vehicle categories in Zimbabwe the effects of surface roughness on running vehicle operating costs were those presented in table 2.
The NTS /l4/ also presented time costs for passengers and goods for
evaluation purposes. For non-business trips, the time costs per vehicle (3 occupants per vehicle) for passenger cars was assessed at ZWD 1.50 per vehicle. For business trips the corresponding figure was ZWD 4.50 per passenger car.
* Halcrow, Fox and Nathan, Highway and Road Transport
Consul-ting, Indonesia, 1983.
Table 2. Effects of Surface Roughness o-n Running Vehicle Operating
Costs Components, Flat Terrain (Index, Roughness 2 500 mm/km : 1.00)
Roughness (mm/km) Paved Gravel or earth roads
roads 4 000 6 000 8 000 10 000 14 000 Type of Vehicle ES: Fuel 1.05 1.15 1.29 1.40 1.73 Oil 1.06 1.23 1.42 1.50 1.60 Tyres 1.36 1.75 2.13 2.24 2.53 Parts Labour 1.10 1.39 1.92 2.50 3.54 Depreciation LDV Fuel 1.05 1.14 1.26 1.37 1.70 Oil 1.06 1.23 1.42 1.50 1.60 Tyres 1.41 2.08 2.21 2.36 3.03 Parts Labour 1.10 1.39 1.92 2.50 3.54 Depreciation MGV Fuel 1.08 1.23 1.45 1.62 2.09 Oil 1.06 1.23 1.42 1.50 1.60 Tyres 1.37 2.10 2.98 3.20 4.10 Parts Labour 1.10 1.39 1.92 2.50 3.54 Depreciation} HGV . Fuel 1.09 1.24 1.46 1.64 2.30 Oil 1.06 1.23 1.42 1.50 1.60 Tyres 1.20 1.99 2.89 3.21 4.11 Parts Labour 1.10 1.39 1.92 2.50 3.54 Depreciation VHGV Fuel 1.10 1.27 1.51 1.72 2.30 Oil 1.06 1.23 1.42 1.50 1.60 Tyres 1.52 2.21 3.20 3.56 4.56 Parts Labour 1.10 1.39 1.92 2.50 3.54 Depreciation
599.5;
Fuel 1.08 1.23 1.45 1.62 2.09 Oil 1.06 1.23 1.42 1.50 1.60 Tyres 1.32 1.98 2.74 3.01 3.73 Parts } Labour 1.10 1.39 1.92 2.50 3.54 Depreciation VTI RAPPORT 322 A13
4 CLIMATE, TOPOGRAPHY AND GEOLOGY
The physical conditions of a country influences the planning, construc tion and maintainance of all types of roads. The climatic conditions such as temperature, precipitation and evaporation, have various effects on the roads. The temperature during daytime is often high or very high in tropic and subtropic countries. During the nights the temperature falls, sometimes drastically. The high temperature occa sionally causes bleeding of the bitumen surface of the roads. The microclimatic daily variations which cause, among other problems, condensation in the bases below the blacktop, may also alter the wearing capacity of the road. On gravel roads the dust emission partly depends on the temperature.
Rainfall can more or less destroy a road surface by loosening and removing the material or the particles. The shape or the camber of the carriageway on earth or gravel roads can be dramatically changed during a heavy rainfall.
There is not only a daily variation in the tropical and subtropical climate. In general there is also a seasonal variation in southern Africa divided into three periods: a cool and quite dry period (May August), a hot and dry period (September November) and a hot and quite rainy
period (December April).
In most countries information about temperature, annual average and seasonal patterns of rainfall can be obtained from institutional
metero-logical sources (Figure 4). However, it should be noted that in many
areas the average rainfall information could be misleading due to great seasonal and local variations. More detailed information on intensity and duration of rainfall might be difficult to obtain. Very often the
coUntry is divided into climatic zones /8/, /lO/. These zones match with
' different topographical terrain and areas with the same soil/bedrock.
Figure 4. Map of the mean annual rainfall in Zimbabwe.
The topography has consequences not only for the planning of roads, but also in the construction and maintenance phases
. The selection of an alignment must take into account the topographical data. The studies for choosing alignments are based on the exami
nation of maps, air photo interpretation and ground reconnaissanc
e (see below). These studies hopefully give the planner the essent
ial features for the alignment in the most favourable zone of terrain, the flooded zones, the catchment areas and flow of rivers, together with observations of the most favourable crossing points. Consideration must be given to the natural drainage pattern, and the location and requirements for bridges
and culverts might also be decided from the studies.
15
In the alignment study the soils and the bedrock have to be incorpora-ted. The quality of the soils on which, or maybe with which, the road will be constructed is an important factor. It has a direct influence on the costs of both construction and maintenance. It is also essential to know the presence or the absence near to the road of material which can be used in the construction of the pavement layers, as well as in the maintenance. "About seventy per cent of the cost of road construction is associated with the use of materials. This is especially true for low-cost roads where it becomes essential that all available sources are located and taken into account for design purposes. (comment: and maintenance). It is also important that the search for construction materials be undertaken on logical bases and not as is often the case, in
a haphazard random fashion" /l5/.
5 PAVEMENT DESIGN
It is wellknown that the pavement design used in tropical countries has been adopted from several pavement designs developed in temperature countries. These take into account the characteristics of climate and natural materials from the regions where they have been developed. As the AASHO Road Test is related to the conditions in the northern hemisphere it was necessary when establishing a design for the tropics to correlate and supplement the AASHO recommendations. This has also been done in a design procedure termed Tropical Design Procedures For Flexible Pavements /see 16/, developed principally for laterite and lateritic soils which are the dominating soils e.g. in Africa.
AASI IO also provides specifications for base and base-course materials. However, these specifications also reflects the performance of tempe-rature soils in a temperate climate (see above). "The specifications provide a means of selecting ideal materials to be used in the construction of highway pavements" /16/. Nowadays everyone realizes the difficulties in finding and using such ideal materials for road constructions in temperature regions. In tropic countries the difficulties are even greater. A modification of the AASHO specifications has therefore been established for materials of construction in tropical climates /16/.
Recommended specifications for base and subbase materials are
presen-ted in table 3. If a surface treatment (not asphalt concrete) is used in a
design it is recommended that the durability requirements given for surface course materials e.g. slake (lime) durability value, are included in the specifications for base course material.
The CBR (soaked) values in the table have been determined by a statistical analysis from a lot of samples.
17
Table 3. Specifications for base and sub-base materials /l6/.
Criteria Base Classi cation Subbase
I II III IV V VI Design CBR +100 90 80 7O 6O 50 25 40 Maximum traf c AESALBD 10" 107 10" 2 x10⁶ 9 x 10⁵ 5 x 10⁵ Gradation l l 1 2 2 2 3 Maximum LL X ( 200) 600 900 900 900 l 250 1 250 l 600 Maximum PI X ( 200) 200 400 400 400 600 600 800 Maximum Granularmetric Modulus 490 525 550 S 80 600 61 5 630
AESALBD Accumulated Equivalent Stande Axle Loadings in Both Directions Granularmetric Modulus - Percent passing 1, 3/4, 1/2, 3/8, 4, 10, 40, 200 sieves.
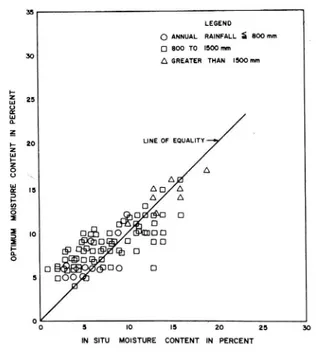
In a South American study the in-situ moisture contents of the
different pavement layers have been examined. The relationship bet-ween optimum moisture content at AASHO Modified Compaction and in situ moisture content for the different layers is presented in figure 5
and 6.
"Examination of these plots shows that the in-situ moisture content of the base materials does not significantly exceed the optimum moisture
content of the material until the annual rainfall exceeds 1500 mm. The
in-situ content of the sub base materials does not significantly exceed the optimum moisture content of the material until the annual rainfall exceeds 800 mm" /l6/.
35
LEGEND o ANNUAL RAINFALL § 800 mm D 800 To I500 mm
30 A GREATER THAN I500 mm
* Z 3 25 (I u] (L
z LINE OF EOU LITY
5 20 t3 A S 0 A w A g :5 A :7, AA A A 5 D D A S Q A 2 D 9 lo @3@ At la 2 31am @ ' g D 0 DD
5 D
[a]
D D D 5 (a, a D o c 5 l0 I5 20 25 30IN SITU MOISTURE CONTENT IN PERCENT
Figure 5. Relationship between optimum moisture content and in-situ moisture content, base courses /16/.
35
LEGEND o ANNUAL RAINFALL S 800 mm [:1 800 To l500mm 30 A GREATER THAN I500 mm
'5 m 25 U I u! 0. Z ,_ 20 LINE OF EQUALITY 2 u] E 8 A A g l5 An A p A A 9 D o2 t! D g IO DEE] DO DD 2 mm D E [5 Q bi l [a] D 0 @D D 6100 D 5 [300 o o 5 IO :5 20 25 30
IN SITU MOISTURE CONTENT IN PERCENT
Figure 6. Relationship between optimum moisture content and in-situ
moisture content, sub-bases /16/.
19
The structural design of bitumen-surfaced roads in many tropical and
sub-trOpical countries is based on Road Note No 31 /l7/. This
publica-tion, as well as other published design standards from different African countries proposes specifications based on:
a) the amount of traffic and its axle load distribution, and
b) the strength of soil subgrade.
Having estimated those factors, the required pavement thickness can be obtained from a design chart. As water (both surface and sub-surface) plays an important role for all road construction, particular attention must be paid to the drainage of the pavement layers. The recommended minimum standards for the materials used in different base-courses are also given in the design standards. The variety in surface dressings, depending on aggregates, binder and number of applications, has resul-ted in design principles for surface dressing /18/. There are many combinations of size of aggregate and type and quantity of binders. Prime and single or double surface dressing, mix-in place treatments, pre mix bituminous materials are different alternatives.
In 1982 Mitchell /10/ presented a flexible pavement design system
MPD l in Zimbabwe developed from both an earlier design system SR 1, which had been used for quite a long time, and the MoT Roads Manual. MPD 1 is based on the climatic conditions, the properties of soils and the natural roadbuilding materials, the traffic, and the design life of
the roads.
The climatic conditions are determined as described in the previous chapter. The traffic determinations (Chapter 2) are carried out by measuring ADT, the axle load distribution and ADT in terms of equiva-lent 80 kN (E80) single axles. The classification of roads in terms of traffic gives 4 design groups based on maximum repetetions of E80 axles in design life. The design life might be difficult to select for a road. Twenty years is normal for economic design, but based on a unit of reseal, even ten years can be used.
The classification of soils are quantitatively based on CBR (soaked) and
qualitatively on Texas triaxial tests (Chapter 8). Gravels for the
wearing course should have a grading modulus of 1.5-2.5 and the percentage passing the 0.074 mm should not exceed 70 per cent of that passing the 0.425 mm sieve. The plasticity index of the material is determined, but the limits serve as a guide. Modifications have to be made on the basis of local experience.
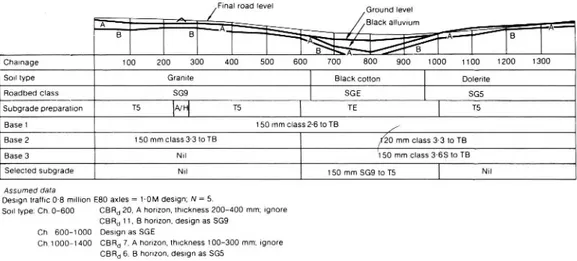
The flexible pavement design used in Zimbabwe is thus a combination of 6design choices for soils and 4 groups of traffic. There are some modifications for the expansive soils. In the pavement structures all layers are multiples of 120 mm och 150 mm. An example of a typical longitudinal section is shown in figure 7.
Final road level Ground level
Black alluvi
A B B A um A %= =
B A B
Chainage 100 200 300 400 500 600 700 800 900 1000 1 100 1200 1300
Soil type Granite Black cotton Dolerite
Roadbed Class 8G9 SGE SGS
Subgrade preparation T5 A/Hl T5 TE T5
Base 1 150 mm class 2-6 to TB
Base 2 150 mm class 3-3 to TB //20 mm class 33 to TB
Base 3 Nil [150 mm class 368 to TB
Selected subgrade Nil 150 mm 539 to 1'5 L Nil
Assumed data
DeSIgn trailic 0-8 million E80 axles = 1'0M design; N = 5.
Son type: Ch, 0 600 CBR(j 20. A horizon, thickness 200 400 mm; ignore
CBRd 11. B horizon, design as 869 Ch 600 1000 Design as SGE
Ch.1000 1400 CBFid 7. A horizon, thickness 100-300 mm; ignore
CBRd 6. B horizon. design as 865 Notes
1. The SGE section has been extended for safety, and Base 3 increased from 120 mm to 150 mm for design uniformity. 2. Terms are de ned In contract documents. so the drawings are simplified.
Figure 7. Typical longitudinal section (exluding levels) /10/.
"MPD l is extremely simple to use and to specify, while the resulting
construction requirements are essentially practical and similar over long lengths, resulting in lower contract costs. It is likely to be readily applicable in most subtropical or tropical developing countries, provided
21
that construction control is available, that timely maintenance will be
given, and that axle loads will be controlled" /lO/.
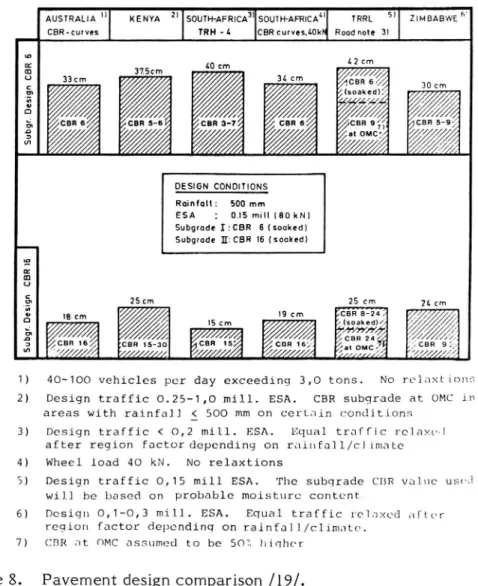
Figure 8 is a comparison of pavement designs from different countries. It appears that generally the standards seem to be very high in the African countries. This could imply overdesign with high construction costs as a result. Local conditions must be assimilated in determining construction specifications. Figure 9 shows suggested pavement design
for low traffic roads in Botswana /l9/. This design is based on long
experience gained from several constructions projects and two trial
sections.
AUSTRALIA KENYA 2 SOUTH-AFRICA SOUTH-AFRICA TRRL 5 ZIMBABWE
CBR-curves TRH -l. CBRcurvesJOkN Road note 31
m 42cm 0 5 40 cm , / 8 33cm 37.5cm 31. cm 30 m 51 W / / % : soaked g //c //j
5" W
a /¢
// /
/ a
2, gc/ag 6/ é/can 5-6? é/can 3-7/ é/can 6/ /can egg; 2/}?
D /
//// // // //
////
w///;/%///%///////////Azy/§
DESIGN CONDITIONS Rainfall: 500mm ESA 2 0.15 mill (80 RN)Subgrade I:CBR 6 (soaked) Subgrade II2CBR l6 (soaked)
E
m U 25cm 25 cm H cm 3 7/ ' / 19 cut wCé 8 54/ / . o / 8 cm /// l5 cm f/(soakedl/f/ 5;» VM WM //////// $3.3773 4cm 16/, ;can 15 30: 083 155/ /can 16;. 7,3. OMcf/ gucen 97,. m 'QZZ%Z? AQZZ Z 4%ZZZV/ éZZ¢ZkZ Zamazé TZZZZZV
1) 40-100 vehicles per day exceeding 3,0 tons. No relaxtions
2) Design traffic O.25-1,0 mill. BSA. CBR subgrade at OMC in
areas with rainfall 5 500 mm on certain conditions 3) Design traffic < 0,2 mill. ESA. Equal traffic relaxed
after region factor depending on rainfall/climate
4) Wheel load 40 kN. No relaxtions
3) Design traffic 0,15 mill BSA. The subgrade CBR value usod will be based on probable moisture content
6) Design O,1-O,3 mill. BSA. Equal traffic relaxed after
region factor depending on rainfall/climate.
7) CBR at OMC assumed to be 501 higher
Figure 8. Pavement design comparison /l9/.
PAVEMENT DESIGN - LOW TRAFFIC ROADS
(NATURAL GRANULAR GRAVEL/CALCRETE) ESA < 100 000 (80
LAYER A B C D ESA-values For traffic in
both directions (as single
552 552 552 552 lane traffic should be
SD1+SS1 SD1+SS1 SD1+SS1 SD1+SS1 anticipated).
SUBFACINC 051 051 051 051
GS? 552 532 552 200000 ESA(80kN)aa200A07
100000 ESA(80kN)a;100ADT
BASECOURCE 15 Tar should not be used as
binder in upper layer of
surfacing.
z f a, .
v.33: I,_...,.
-i2? ¥
Surfacings:
SELECTED FILL 20 531 = Single surface dress. 551 = Single sand seal
552 = Double sand seal
SCU 553 557 5515 051 : Sin le ravel seal
SUBBRADE (CBRS3) (3<CBRs7) (7<08Rs15) (CBR>15) g g
052 = Double gravel seal
TOT. YHICKNESS 40 cm 25 cm 20 cm 15 cm ESA 100 000 - 200 000 (80 kN) LAYER A B 0 D1 02 E 552 852 552 552 552 552 SD1+SS1 SD1+551 SD1+SS1 SD1+SS1 5D1+SS1 51 +551 SURFACING 051 051 051 051 051 051 052 £52 052 052 052 052 BASECUURCE 20 SUBBASE SELECTED FILL 15 R E 50U 503 507 5015 5015 $025
SUBS AD (caR<3) (3<cens7) (7<CBRs15) (15<CBRs25) (15<cens25) (CBR>25)
YDT. THICKNESS 45 cm 30 cm 25 cm 20 cm 25 cm 15 cm
Figure 9. From /19/.
23
6 SURFACING OF ROADS
In an unpublished report to SIDA 1978 alternative methods of binding the road surface on earth and gravel roads in developing countries were
discussed. Bituminous surface treatment is considered below, while
dust proofing is considered in Chapter 10.
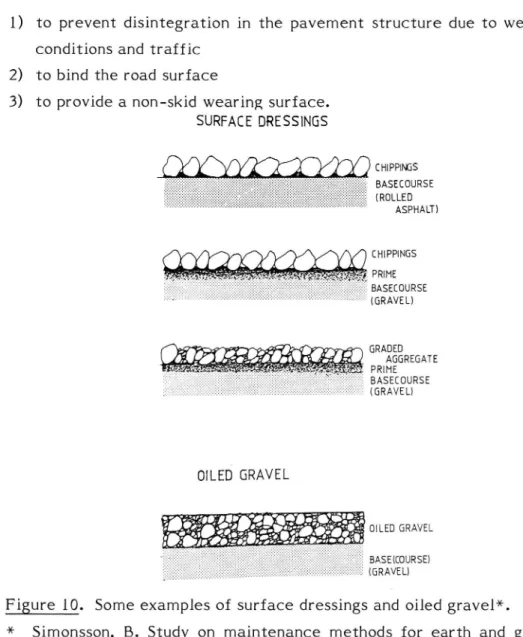
Bituminous surface dressing consists of spraying a film of binder followed by an application of chippings (aggregate), which is then rolled. The main objectives of the sealing are:
l) to prevent disintegration in the pavement structure due to weather conditions and traffic
2) to bind the road surface
3) to provide a non-skid wearing surface.
SURFACE DRESSINGS ; BASECOURSE a (ROLLED " ASPHAUW RADED c,_ _ AGGREGATE . , ' V- ". PRIME a;... BASECOURSE if; :.:-:-:v: (G
OILED GRAVEL
. -.. v - - -v-- ~-.-- --'~ '5'-"""iT'JIO-J'P OK0933=Q .9:%:3 _ . .1 , p... '04: I o - ;4, . 0? 1'. .0130; bruf-eo ' z liai or"-"- > D"=""" $3.9; 9'
-'IQ OILED GRAVEL
BASEKOURSB
m3(GRAVEU
Figure 10. Some examples of surface dressings and oiled gravel*.
* Simonsson, B. Study on maintenance methods for earth and gravel roads in developing countries. Report to SIDA. Nat. Road and Traffic Res. Inst. Linkoping, Sweden 1978.
Surface dressing can be used successfully and economically justified on roads of all types, from an upgraded earth road with a few vehicles to highways carrying thousands of vehicles per day.
On an earth road a few vehicles will initially run on the road. At some stage the traffic volume has increased so much that an improvement of
the road surface can be recommended.
In a study* carried out on a gazetted road network in Botswana this stage has been calculated from relationships between the total road cost including VOC and the initial traffic volume. The analysis is also based on different types of road surfaces in new construction and improvement. The calculations are presented in figure 11A and IIB. In figureIIA it is obvious that "a gravel road with a 4.50 m sand seal is superior to an existing earth road for a traffic range of 50-75 vehicles per day. Where traffic levels are already close to 100 it is best to
proceed straight to a 6.0 m (2 lane) double surface treatment one since,
at this traffic level, the additional vehicle operating cost of slowdowns for passing on single lane roads appears to justify the construction cost
of a 2-lane road".
The feasibility of upgrading a gravel road by adding a sand seal is presented in figure llB. According to the analysis it is justified to seal a gravel road (4.50 m) for traffic volumes above 25 Initial ADT.
* Highway maintenance study. Final report Vol.1. Republic of Botswana, MoWC. Kampsax in assoc. with Sir Alexander Gibb
6c Partners (Botswana). 1978.
25
TOYAL ROAD COS! AND VEHICLE OPERATING COSTS (1000 Pula)
- ""Eorth Smd
1m - Gravd
" Sand Seal (650!!!)
Double Serace Treatment ( 6.03m)
m# 80-.-7°? m-.. 50.... 40-N« N 10-4 l 1 l J I r If Y 0 25 so 75 100 i lnitia! AOT. Optimum surface typo
+ Earth Sand +50 ! ml + Double Surface Treatment ..
Optimum surface type and traffic, new construction.
Figure 11A.
1L TOTAL ROAD COST AND VEHICLE OPERATING COSTS (1000 Pula)
50 .1.
LS ~ 1.0... 3 1;
Improved with sundseal w-
r-}
3
20-11-Existing gravel /cnlcrctc road 15 1 10--5-.. 1 1 1 1 1 1 l T I T l I . _ 5 TO 15 20 25 30 lmhul ADT. H Remu'n gravel /cak:r e - + Improvement with and seal - __
Figure 1113. Optimum surface type and traffic, road improvement.
27
Recommendations on how to construct satisfactory bituminous surface
dressings have been published during the 1970's and 1980's /17/, /20/. The text below is based on the Swedish SIDA report from 1978 (p. 23).
The report deals with surface treatments and premixed oiled gravel. Among surface treatments, primer seal, surface dressing with chip pings, sand seal, surface dressing with graded aggregate and slurry seal
are described.
6.1 Surface treatments in general
6.1.1 Primer seal
Primer seal is an application of a suitable binder and fine graded aggregate cover. Generally a primer seal is intended to carry traffic for a period from a few months to a year preparatory to the application of a surface dressing. The main function of a primer seal is to bond to the surface of a prepared gravel surfacing, and to provide a suitable surface for adhesion of a surface dressing. Primer seals are difficult to repair if damage occurs and should only be regarded as temporary or interim treatments, and occasionally part of a stage construction.
The treatment requires about 1.0 1.5 1/m2 of cutback bitumen, depen-ding on traffic volume and type of underlying surface.
The requirement that cover aggregate should be free of clay, silt and organic matter may be hard to comply with in wet climates where
clayey soils predominate, without expensive processing. In arid or
semi-arid climates with good supplies of sand, primer seal may be used. If the traffic volume is low, the expected life can be more than one year and the seal coating can be performed with a fine sized aggregate. 6.1.2 Surface dressing with chippings
Surface dressing using single-sized aggregate can be performed with fine or coarse aggregate. In case of fine aggregate, there are specifi
cations in which the aggregate size is 2 6 mm (see below). The
application rate is then 1.0-1.5 kg/mz. In Sweden 12-16 mm chippings
are generally used. Sometimes a finer, second surface dressing is placed one year after the first dressing. Then the first layer may consist of
16-24 mm chippings.
Before applying a surface dressing to a gravel base it is sometimes necessary to enhance the bond between the base and the surface dressing by means of a prime coat. In priming, low viscosity cut-back bitumens very often are used. The rate of application will vary according to absorption characteristics of the surface and the depth to be treated, and is generally 0.5 1.4L kg/mZ. When a surface dressing is carried out on an existing bituminous surfacing, priming is unnecessary. Surface dressing on a gravel surface requires a total amount of 1.5 2.9 kg/m2 of cut-back bitumen or emulsion which may be compared
with the m rates of 0.5 2.0 kg/m2 for ' dust proofing. If the
expected life of a surface dressing is more than a few years it will thus be more economic than just dust-proofing.
The aggregate should be hard and clean to ensure good results. If, in addition to good quality aggregate, the base material is sound, the expected life of a surface treatment will be quite long. The demands on
the cover stone may, however, reduce the use of the method.
Choice of binder type and properties should be made with respect to wheather conditions during laying operations, type of aggregate, and
climatic conditions /21/.
6.1.3 Sand seal
Sand sealing is frequently used in areas where there is a shortage of aggregate. In the operation a binder and clean coarse sand are blended in a 3-5 mm thick layer. Additional layers of sand could be applied after some time.
6.1.4L Surface dressing with graded aggregate
In Sweden surface dressing with graded aggregate is a technique of
29
growing importance for surfacing low volume roads. It consists of a single application of a road oil or emulsion onto a gravel surface, followed by a single application of a graded aggregate which is then compacted. The oil migrates upwards and downwards, thus binding the aggregate to the surface. The requirements on the oil and on the aggregate grading are the same as for pre-mixed oiled gravel.
In a similar technique used in Canada, the binder is an anionic bitumen emulsion to which chemicals have been added, changing the flowing properties of the residual bitumen and thereby minimizing the risk of bleeding. The Canadian technique also involves priming prior to the surface dressing.
In Sweden the application rate for the road oil is generally about
1.5 kg/mZ. No prime-coat is used.
Surface dressing with graded aggregate makes it possible to utilize aggregate of a lower quality than that required for a single sized dressing.
Experience in Sweden shows that when using an aggregate with a 0-18 mm grading the construction cost per square metre of a surface dressing with graded aggregate is less than half the cost of pre-mixed oiled gravel. However, the compacted thickness ratio will be 1:2.
A similar technique called "Otta Surfacing" has been developed in
Norway /l9/, /22/.
6.1.5 Slurry seal
Slurry seal is a mixture of fine aggregate, bitumen emulsion, water and sometimes cement. The amount of bitumen emulsion is high, generally between 13 and 20 per cent by weight. By using a fine aggregate it is possible to make a slurry seal in two layers with a total thickness of only 6 mm. However, it is also possible to use coarser aggregate grading
(up to 16 mm).
If the emulsion content is 20 per cent and the thickness of a slurry is
6 mm, the amount of emulsion will be about 1.6 kg/m2.
A gravel base has to be primed with 0.85-1.1kg/m2 of a suitable cut-back bitumen before sealing.
Like other types of surfacing the use of slurry seals requires good sound bases. The main disadvantage is that the slurry normally has to be mixed in special equipment which cannot be used for other purposes. Slurry seal can be used in combination with a surface dressing. Slurry seal is then applied on a relatively fresh surface dressing and will act both as a binding layer and as a "texture smoothener".
6.2 Premixed oiled gravel
Oiled gravel is used almost exclusively in Scandinavia mainly because
the quality of gravel is very suitable for the process. Zimbabwean
gravel is similar in quality.
The pre mix technique involves the use of a special plant equipped with a continous mixer. The content of oil is normally about 3.5 % by weight. The oiled gravel can be stockpiled for years. It can also be ripped by a grader and recompacted on the road.
Currently the oiled gravel is laid with an ordinary paver and rolled with a steelwheel roller. The compacted thickness is generally about 3 cm. (Previously it was spread by graders and compacted by traffic only.) Oiled gravel could be a surfacing suitable for the developing countries if aggregate of a rather good quality is available. The mixing process is simple, and the laying could be done in a more simple way than in
Sweden.
In hot climates it is necessary to use a road oil with a higher viscosity than in Sweden. More porous aggregate will make it necessary to use a higher percentage of oil. However, investigations are necessary to prepare a specification for suitable road oil.
31
The possibility of using a finer aggregate than in Sweden (0 18 mm)
may be discussed. The aggregate must, however, not contain too much material passing the 0.074 mm sieve.
Mostly the gravel is not dried or heated when producing premixed oil gravel. The water content in the gravel is approximately 2 3 % by weight. The total voids within the mixture must have a specified range to absorp the water and the asphalt. A grain size distribution with a low percentage of aggregate passing 74 m (opengraded) is therefore re-quired. Too much material passing 74 m ("fluidsurplus") has caused defects on the surface. When the aggregate is heated a higher content
of fine material is tolerated.
A finer aggregate makes it possible to use thinner layers of oiled gravel, thus keeping the construction cost low. A thin layer of oiled
gravel will, however, probably make it necessary to prime the road
base.
For example, if the maximum stone size in the aggregate is 9 mm and the compacted layer thickness of the surfacing is 15 mm, the content of road oil will be about 1.5 kg/m2, which is almost the same as in a surface dressing using 9 mm cover stone.
The actual cost per unit area of oiled gravel surfacing will vary considerably with the cost of producing the gravel itself, and with the scale on which the operation is carried out. Plants for the mixing operation are easy to move and thus haulingcosts are reduced.
6.3 Tests on surface dressing in Kenya
Research on surface dressing was carried out in Kenya in 1976-1979
/23/. The so-called Jackson method of design from 1963 (summarized in
the research) was used and evaluated for surface dressing. Fourteen trial sections were constructed and the following factors were exami ned: l) chipping size, 2) binder viscosity and 3) double surface dressings,
cf /24/.
The chippings used in the trials had sizes of 20 mm and 14 mm. There was a substantial prOportion of oversize material in the first group, and
the second one tended to be undersized.
Penetration grade bitumen, 80/100 pen, was used in all the trials. The binders were made by blending the bitumen with diesel fuel just before spraying. Laboratory and field tests were made on the blends. A series of curing trials matching climatic conditions was also undertaken, and penetration tests were made on the recovered binders.
The equipment used i.e. bitumen distributors, chipping Spreaders/grit-ters, and the type of roller are described. The design of experiments and the construction of the trial sections are also presented very thoroughly.
After some months measurements of texture using the sand patch test and the probe depth test (both described in the paper) were carried out. Among the conclusions drawn from the investigations in Kenya the following can be mentioned:
a) The Jackson design procedure appeared to provide a correct rate of spread of binder for Kenyan conditions for chippings which had an average minimum dimension of 5 to 13 mm (ALD; see /23/),
b) Binders with a viscosity at road temperature in the range of 50,000-500,000 centistokes wetted chippings effectively, cf.
/21/,
c) The Jackson design method appeared to apply equally well to double seals as to single seals,
Based on the results and the experiences from the above mentioned
research /23/ and Road Note 39 /18/, a general guide to the design and
execution of surface dressings in tropical and subtropical countries was
published in 1982 by the Overseas Unit at TRRL /20/.
33
7 ROAD GEOMETRY
As pointed out in Chapter 1, road geometry has a direct incluence on the overall transport costs. The final choice of geometric standards will also affect not only the magnitude of the construction costs, but indirectly the choice of construction methods and constructions techno-logy too.
In selecting geometric standards for a road the following characteris
tics have to be considered:
1) traffic and design speed
2) design related to vertical alignment 3) design related to horizontal alignment
4) roadway cross section.
The first of these factors will determine the minimum standards for the alignment and cross section. However, the ultimate standard of an individual road (as well as the total costs) will depend on the ability of the design engineer to fit the road into the terrain and to combine the vertical and horizontal design elements. This work must be carried out as an integrated process and the present design procedures in the MoT shouls thus be modified (cf recommendations in /l#/).
The characteristic standards adopted by various countries is described
below. However, when comparing the standards in different countries,
consideration must always be given to differences in the traffic culture and to the varying competence of the average driver. This is particular-ly the case when comparing the design standards of developing and developed countries.
7.1 Traffic and design speed
The selection of a given, possibly correct, design standard must first of all be based on the traffic expected on the road. "Due to the fact that traffic forecasts over a longer period are generally hazardous, design standards are frequently adopted with a view to meeting with the needs
of traffic in ten years' time after completion of the construction" /25/.
In table 1+ the traffic volumes are lOO-SOOO veh./day for primary roads,
50 800 veh./day for secondarygroads and less than 100 yeh./day for feeder roads.
Table 4. Design characteristics for roads in different types of terrain
in developing countries /25/.
Characteristic Formation
.
Design
radius
Max-
212?};
(pei i iii m
$132151,
Terrain i j oj curzfture"r graéZent oj-gmde Sadat-mg surfacing m and shoulders) m Road type. m
Flat or rolling 80 1 10 190 360 4 None 10 13 6 7-5 Primary Hilly 55 80 90 190 5 7 600 over 40/0 10 13
Mountainous 40 55 50 90 7 9 400 over 60/0 8-10
Flat or rolling 60 80 110 190 5 None 10 12 6 68 Secondary Hilly 50 60 75 1 10 5 7 None 10 1 2
Mountainous 35 50 35 75 7 9 750over 60/() 8 9
Flat or rolling 50 60 75 1 10 7 None 7-5-8 5-5 6 Feeder Hilly 35 50 35 75 7 9 None 7-5 8
Mountainous 25 35 30 35 9 12 1 000 over 90/o 7-5 8
" The absolute minimum radius ol'curvaturc shown here takes account ofa superelcvation of l()°/o and a sideway force coe icmm 0(0 16.
South African policy is for arterial roads to have a normal design speed of preferably not less than 100 km/h and collector roads preferably not
less than 80 km/h.
The Swedish recommendations are as follows:
national road 80 100 km/h
provincial road 60-80 km/h
The MoT Manual C in Zimbabwe (revised in 1979) recommends the following design speed:
in flat and rolling terrain 100 km/h
in hilly or mountainous terrain 80 or 60 km/h.
35
Table 5 shows the appropiate design speeds suggested for Zimbabwe
/14/.
Table 5
Type of Terrain
Road type Flat/rolling Hilly Mountainous
Primary road 100 80 60 Secondary road 80 6O 4O Feeder road 60 6O 4O
In many parts of Zimbabwe a design speed of 100 km/h or more is easily attained due to the flat terrain. It is also a reasonable speed for main
roads in rolling terrain. On secondary roads, which normally have low
traffic flows, a general reduction of design speed in rolling terrain may well be justified for economic reasons. The reduction of design speed in
hilly and mountainous terrain is natural and economic for all types of
roads. This corresponds well with the present standards of some other
countries where they have recently been revised /l4/.
7.2 Vertical alignment
In table 4 maximum grades for different classes of roads and types of
terrain are presented. If heavy vehicles use a road, grades in excess of
6% should be avoided. To attain good drainage especially in cuts, it is advisable to carefully select the gradients of the slopes. Sections of road with very steep gradients should be avoided.
A comparison of normal maximum grades is shown below. "In South Africa the values given mean 'desirable maximum sustained grade'. This indicates that even higher values could be allowed for short stretches.
Normal maximum grades (%) Design Speed (km/h) 60 80 100 Zimbabwe 6 5 4 South Africa 8 7 6 Australia 6 7 5 Sweden 6 6 6
It appears that Zimbabwe is more generous to traffic in keeping grades to a minimum. The optimum solution considering economy and safety, however, would be found in a combination of vertical alignment and road width. Modern vehicles are less sensitive to gradients than when the manuals were issued. We therefore-suggest that the normal maxi-mum grades be adjusted to South African standards. When traffic flow is high and heavy vehicles comprise a significant proportion, climbing lanes should be utilised. Absolute maximum grades then become less critical" /l4/.
Sight distance is specified in stopping sight distance and passing sight distance. In the first specification "the minimum distance should be sufficient at the design speed for perception and brake reaction time and for bringing the vehicle to a stop. According to AASHO this distance is measured along the line of travel from a point 1.30 m high representing the eye of the driver to a point representing a stationary
object on the surface" /25/.
The passing sight distance is measured along the carriageway between two points 1.30 m high above the surface of the road. This hopefully represents the height of a driver's eye and an object ahead.
"The Zimbabwean stOpping sight distance is measured along the line of travel from a point 1.15 m high, representing the height of the driver's eye, to a point 150 mm high, representing a stationary object on the
road surface.
37
This compares with some other countries as shown:
Height (metres)
Driver's Eye Object
Zimbabwe 1.15 0.15
South Africa 1.05 0.15
Australia 1.14 O. 23
Sweden 1.10 0.20
This resulting stopping distances are as follows: Stopping Distances (m) Design Speed (km/h) 60 80 100 Zimbabwe 80 140 210 South Africa 80 115 155 Australia 80 120 165
The stopping distances are the result of calculations based on assump-tions of reaction time, braking and friction. Some of these values depend on the driver's experience, and are therefore very difficult to
transform from one country to another" /1#/.
7.3 Horizontal alignment
Horizontal alignment should be conform with the topography and at the same time take advantage of the aesthetic values of the landscape. The use of long straights must be avoided (cf the primary network of
Zimbabwe). At the end of long straights if any, short or sharp curves
should be avoided.
A graphical presentation of design speed by radius of curvature is presented in figure 12.
DERIVATION 0F DESIRABLE AND MAXIMUM DESIGN SPEEDS Actualcoefficient of side frictionzo-l. to 0-5
180 "Maximum coefficient of friction is normally taken as {:0 16
Maximum superelevation e:O-12 mm c
160 -Desirable design speed assumes f:0~16 and e=0-06 :( 2 )
_Maximum design speed assumes f:0'16 and e:0'12 :max e
no _Formula V: J127-1. R (e+f) dc _ . . \ _ R - radiusm metres = ' ' k h 5120 _ V de5ign speed m/
3
p.D A
GSIF8100 Desugn ~able Min
m P speed radius radius
c 80 35km/h 1.0m 35m
3 45km/h 70m 60m
m 60- 60km/h i30m 100m
0 b M. d. f N t 75km/h 200m 160m
[.0 m m 5 0 CU a we 100km/h 350m 280m
_ Horizontal circular curve 125km/h 550m 450m
20 L l l l 1 l 1 l 1 l 1 l l l I l l l l l l l l l l l l l i
O 50 100 150 200 250 300 350 400 1.50 500 550 600 650 700 750 800 Radius of curvature,metres
Figure 12. Design speed (km/h) by radius of curvature (metres) /25/.
The MOT manual describes the general principles for horizontal curva ture and gives the minimum radii for design speeds of 100, 80 and 60 km/h.
"The general principles are the same as in other countries and there is no need for revision.
Some international comparisons are shown below:
Normal Minimum Radius, m
Design Speed (km/h)
60 80 100
Zimbabwe 150 270 420
South Africa 110 210 350
Australia (approx.) 120 210 320
Considering the needs of traffic safety in Zimbabwe it seems premature to suggest any lowering of the present minimum radii towards the values of the other countries mentioned" /1£I/.
39
7.4 Roadway cross-section
The following widths are proposed for the right-of-way reserved along
roads for future expansion /25/:
primary roads 50 m
secondary roads 30 m feeder roads 20 m
The standard widths of formation and permanent surfacing are recorded in table 4. On roads with earth or gravel surfaces the running surface usually has the full width of the formation. If permant surfacing is expected it is advisable to width of that permanent constructed road. "For feeder roads that are unlikely to carry more than fifty vehicles per
day the minimum formation width may be reduced, but not below 6 m"
/25/.
The maximum limit of superelevation is 10% in Zimbabwe. The choice of superelevation should take into account the following factors:
- safety factor for fast drivers
- economy
- the influence of gradients
l
- slow vehicles tracking towards the inner part of a curve.
Considering these factors superelevation normally should not exceed 6%
in flat or rolling terrain (cf table 6).
In some cases, however, where the radius of a horizontal curve is not
very obvious to the driver in advance, the present maximum of 10% can be necessary.
Table 6. Rate of superelevation(%) and minimum length of spiral
curves /25/.
Radius V = 25 km/h V = 35 km/h V = 50 mh/h V = 80 km/h V = 110 km/h
m Super 0/0 L Super 0/0 L Super 0/0 L Super 0/0 L Super 0/0 L
3000 30 -- 30 30 30 1-5 45 1500 30 30 30 1-6 45 3°] 55 1000 30 - 30 30 2-4 45 4-6 55 800 .30 30 - 30 3-0 45 5-9 55 600 30 30 1-6 30 4-1 45 7-7 65 500 30 30 1-9 40 4-9 45 9-3 75 400 - 30 30 2'4 40 6 1 55 300 30 1-6 30 3-2 40 8-2 65 200 1-2 30 2-4 30 4-8 40
150
I 17 30
3.1 30
6-4 50
100 2-4 30 4-7 30 9'6 55 80 3-0 30 5-9 35 60 4-0 30 7-8 45Nora Spiral curves not essential above the heavy line.
Changes in vehicular behaviour due to the alignment can have severe
effects on the deterioration, drainage, vehicle speed, fuel consumption,
41
8 MATERIAL: LABORATORY AND IN SITU TESTING by J. Rogbeck, SGI
In general, there are only small problems with the roadbed when constructing roads in Zimbabwe. Therefore, ground investigations are seldom done except in bridge foundations and in cases of problematic soils. Soil investigations in connection with road-building are principally a matter of determining compaction characteristics and of checking the degree of compaction. This appears for example from the kind of soil parameters most commonly determined in the MoT's laboratories.
In this chapter a brief description is made of how the most common soil parameters are determined in Zimbabwe. In some cases other types of test procedures are described which could be used instead or as a complement.
Visual inspection of soil
In all types of soil denomination and testing a proper visual inspection is of great importance. Through this, information is obtained about the soil type. It also serves as a check that the determined parameter correspond with the correct soil sample. In Zimbabwe the following assessments are made in the visual inspection. (Example from MoT's formula for sieving analyses).
1. SOIL CLASSIFICATION 2. GEOLOGICAL ORIGIN
3. COLOUR (dry state) :white, cream, fawn, yellow, orange,
red, brown, grey, black
4. ORGANIC CONTENT :high, low, nil 5. MICA CONTENT :high, low, nil
6. HARDNESS OF AGGREGATE :sound, fractured, hard, soft
7. SHAPE OF AGGREGATE :rounded, irregular, flaky, angular,
elongated
8. SURFACE TEXTURE OF :glassy, smooth, granular, rough, AGGREGATE honeycombed
If all the above mentioned assessment are made correctly, this will give
a good indication of the soil type and its properties /26/, /27/, /28/.
Moisture content
The moisture content can be defined as the mass of water which can be removed from the soil by heating at 1050C, expressed as a percentage of the dry mass. Measurement of moisture content, both in the natural state and under certain defined test conditions, is indispensable for determining soil characteristics. The standard test method used in most ountries is oven drying at 105°C /29/, /30/, /31/. In Zimbabwe,
owever, drying is sometimes done by heating the soil on an electric
late or paraffin stove. This may, under certain conditions, result in the oil being heated far over 1050C. If this occurs, some adsorption water Jill also evaporate and the result will be misleading. This can partially
»e avoided by using the sand bath method.
Figure 13. Determination of moisture content.
43
The sand bath method is intended as a site test for moisture content, where a drying oven is not available, or as a rapid method for granular soils. The only difference with this method compared to heating on a stove or plate is that a sand bath, consisting of at least 25 mm sand is placed between the sample container and the heating source. In this way the heat is spread more evenly. The sand bath method should, however, not be used for soils containing gypsum, calcareous matter or
organic matter /29/, /30/.
It is often prescribed in standards that the sample should be dried before different kinds of test procedures are carried out. This is often done to determine the dry weight of the sample. The most common ways to do this are air drying where the soil is exposed to a warm dry atmosphere, or oven drying at 1050C. However, the drying of a soil sample may create larger attraction between particles, which may lead to them appearing to be aggregate instead of as individual particles. This will may lead to incorrect determinations of different soil
parame-ters.
Liquid limit
The definition of liquid limit is the moisture content at which soil passes from the plastic to the liquid state, as determined by the liquid limit test /29/, /30/, /32/. Today, the percussion liquid limit (Casa grande method) is the only used method in Zimbabwe. Another way of determining this limit is with the fall cone method, which is re-commended in several countries. There are some advantages in using the fall cone. This method is for example faster than the Casagrande method and the values seem to be more reliable according to a study
made at the Swedish Geotechnical Institute /32/. Furthermore, the
fall cone equipment can be used to determine the shear strength and the sensitivity of cohesive soils. Research projects that are still in
progress in e.g. France, UK, Sweden and the USA show that even the
plastic limit can be determined with the fall-cone method /33/. In the USSR a standard has already been worked out and is in practice.
Plastic limit
Plastic limit is defined as the moisture content at which a soil passes from the plastic to the solid state, and becomes too dry to be in a plastic condition, as determined by the plastic limit test. The test can be carried out only on soils with some cohesion, on the fraction passing a 425 m sieve. The test procedure is almost the same all over the world andthe result is much more dependent on the operator than on e.g. different kinds of underlayers etc. As mentioned above, the fall cone method may probably soon be a new standard method for
determining the plastic limit /30/, /32/, /3#/.
Figure 14. Determination of plastic limit
45
Consistency, liquidity and plasticity index
These indexes are defined in the same way everywhere and should
therefore give the same values whereever they are determined. They may, however, vary depending on how the consistency limits are deter mined (e.g. Casagrande or fall-cone method etc) /29/, /30/, /32/.
Particle size distribution
The object of a particle size analysis is to group the conglomeration of discrete particles of various shapes and sizes, which a soil naturally consists of, into separate ranges of sizes, and so determine the relative proportions, by dry weight, of each size range. This is done by two separate and quite different procedures. For the coarse fractions (e.g. sand, gravel) the proportions are determined from the sizes of square openings in sieves, i.e. sieving analysis. The determination of fine soil
particles (i.e. silt and clay) are obtained from a sedimentation analysis.
In a sedimentation analysis, the particle sizes are calculated with the help of Stokes' law from the rate of sedimentation. In this calculation the grains are assumed to be spherical. The results therefore give the equivalent diameter. It must be remembered that the silt and clay particles are far. from spherical. However, the absolute magnitute of particle size is of less importance than the distribution of sizes as determined by a recognized standard procedure, and this is the sense in which particle size analysis is applied to soils. The result of a particle size analysis is usually presented graphically showing the percentages finer than any given size, plotted against the particle size on a
logarithmic scale /30/, /35/.
Applications of particle size analysis in road-building are, for example, selection of fill materials, sub-base materials, drainage filters, ground-water drainage, chemical injection and stabilization, and compaction. Even though, or maybe due to the fact that sieving and sedimentation analyses are quite common methods all over the world, there are varying test standards. The sieve sizes and the number of sieves, for example, often vary between countries. This can partially be explained
by the fact that the limits of fractions vary from country to country. Another thing one must remember is that the test methods have sometimes had to be modified to suit local conditions and soil types. The Zimbabwean standards for particle size distribution analysis, men-tioned in Manual Part N Materials Testing /29/, correspond, with only slight modifications, to A.S.T.M. and B.S. The sieving test procedure corresponds to A.S.T.M. D 422, while the sieve sizes correspond to B.S. The sedimentation analysis corresponds farily well to A.S.T.M. E 100.
The standard sieve sizes in Zimbabwe are as follows (in mm): 37.5, 26.5,
19.0, 9.5, 4.75, 2.36, 1.18, 0.600, 0.300, 0.150, 0.075. There are also some larger sieve sizes which are used when determining coarse
fractions (i.e. gravel and cobble). These are (in mm): 250, 150, 75 and
53. i I 1', g 5g,
Figure 15. Sieving analysis.
The 250 mm and 37.5 mm sieves are used when determining the Reject