Västerås, 14 May 2008
Global Solar Photovoltaic Industry
Analysis with Focus on the Chinese
Market
Javier Campillo (javiercjz@gmail.com) Stephen Foster (stevefoster88@gmail.com)
The Department of Public Technology
Mälardålen University, Västerås. Sweden
Mälardålen University
Västerås, Sweden Supervision: Jinyue Yan
Table of Contents
1 Introduction and Background...6
1.1 Background...6
1.2 Objective of the study ...7
1.3 Methodology ...7
2 Introduction to Photovoltaics and Energy Economics ...8
2.1 A History of Solar Energy...8
2.2 PV Operation Principles...12
2.3 Attempts at Commercialization ...14
2.4 Applications of PV Technologies...16
2.5 Current Situation of Photovoltaic Industry...17
2.6 Causes for Photovoltaic Expansion...19
3 Technologies...24
3.1 Crystalline...24 3.2 Thin Films...25 3.3 Concentration PV Systems...28 3.4 Under Development...294 Policies...32
4.1 Subsidies and PV Policy...32
4.2 Chinese Energy Policy...40
5 Silicon and the Supply Chain...43
5.1 Silicon Bottleneck...43
5.2 Geographic Distribution of Silicon Suppliers...44
5.3 Silicon Processing...45
5.4 Polysilicon Capacity...48
5.5 New Entrants to the Silicon Industry...50
5.6 Projections for the Future...52
6 Market Analysis ...55
6.1 Costs of Different Technologies...55
6.2 Major Players...58
7 Chinese Market Penetration...67
7.1 Commercialization...67
7.2 Current Barriers...71
7.3 Suggestions and Recommendations...75
7.4 Solar Energy Forecast for China...77
8 Conclusions...79
Tables
Table 1. China solar cell capacity, year-end 2006 Source: THT Research[54]...11 Table 2. Best conversion efficiency of various solar cells developed in laboratories in China and in
the world [24]...11 Table 3. Commercial solar PV and module efficiency in China and in the world [24]...12 Table 4. Calculated EPT and EYR (over both a 20 and 30 year period) for 3 selected scenarios[44] ...22 Table 5. Programme 1: Performance Based Incentives...38 Table 6. Programme 2: Expected Performance-Based Buydowns...38 Table 7. Geographic distribution of polysilicon production as a percent of total production [14]. 43 Table 8. Silicon Producer Capacity in 2005, projected and potential in 2010 and technology
employed [14]...47 Table 9. New Silicon producer capacity in 2005, projected and potential in 2010, and technology
employed [14]...49 Table 10. Pipper Jaffray solar industry production estimates [14]...52 Table 11. China Polysilicon Capacity (2006)...52 Table 12. China Polysilicon Production and Demand 2004-2006 (tons). Notes: Solar cell
polysilicon demand is calculated as: 2004: 12 tons/MW; 2005: 11 tons/MW; 2006: 10 tons/MW. 2006 crystal-silicon solar cell production is about 400MW [28]...53 Table 13. China: Electricity generation capacity by type of fuel in GW and as a percentage of total
Illustration Index
Figure 1. Schematic of a solar cell[23]...14
Figure 2. Growth in annual installation of grid-connected and off-grid photovoltaic cells, 1990 to 2004. (Source: Solarbuzz, 2005)...17
Figure 3. World energy consumption by region from 1970 to 2001 with forecast through 2025 (quadrillion Btu). Source: EIA (2004)[5]...19
Figure 4. DSSC Operation Principle Diagram...30
Figure 5. German PV market expansion thanks to the feed-in-tarrif[10]...34
Figure 6. World Map of Polysilicon Production [14]...44
Figure 7. Retail price per Watt peak in Europe[50]...55
Figure 8. PV manufacturing share by country, 2005[47]...58
Figure 9. Suntech's stock price during the last 2 years[41]...59
Figure 10.Q-Cell's Stock Chart [42]...61
Figure 11. Total Chinese PV production capacity[24]...66
Figure 12.PV annual production and cumulative installation capacity in MWp in China by year[61] ...67
Figure 13.Extrapolation of the consolidated PV production capacity trend in China over the last decade[24]...68
ABSTRACT
As climate change is emerging as a manageable and predictable global problem, several industries are shifting the focus of their business to include the reduction of greenhouse gasses. This is seen in most power generation technologies, but none have shown the sustained level of growth as that of solar power. Year over year the photovoltaic industry continues to return growth rates around 30%. What is it about solar power that has attracted such a large amount of investment? An analysis on the growth rates, technological advancements and largest businesses in China will demonstrate how China is positioned to become the next world leader in photovoltaic manufacturing. The research was done mainly through literature review and data collection, focusing mainly on Chinese companies performance in the last decade. There has being a also a strong study in the European strategies to increase the use of PV technologies, from European manufacturing methods and technologies used, to local policies and government incentives.
1 Introduction and Background
1.1 Background
With global CO2 emissions rising at an exponential rate, and the fact that 19 of the 20 hottest years
on record have occurred since 1980, there is a global need for a shift in energy supply from fossil fuels to renewable energy.[1] Furthermore, as instability in the world's oil producing countries increases, it is becoming ever more important for developed nations to reduce reliance on fossil fuels. Of the sustainable energy technologies that currently exist, solar power has the most potential for growth in the long term, and if it is adopted at considerable levels, solar power could have a significant impact on the reduction of CO2 emissions and increased energy security.[2]
For the past decade photovoltaics have enjoyed an average of 30% growth across the global spectrum with certain hot spots in Europe, the United States and Japan. There are many explanations as to why this is happening, such as government policy, the increase in fossil fuel prices and decrease in availability, and also enhancements in the technology due to research and development. But will this trend continue and in which region will we see the biggest development?
It is likely that China will soon become a world player in the PV sector since for the past 7 years, they have sustained a 70% annual growth in production capacity.[3] As with many other products, China has become the production hub of the world and photovoltaics is not an exception. However, there are many obstacles to overcome. China's ability to grow is somewhat hindered by the global silicon shortage as well as a lack of government support for the growth of the domestic market. Currently China does not possess the same level of manufacturing technology as the world leaders such as Germany, Japan and the United States. This results in higher costs and a less efficient products.
Yet there is a disconnect – even though there is considerable expansion capacity in China there is still uncertainty about whether China will be able to develop their own domestic market thereby increasing capacity and foreign investment. So in this case, will China remain a purely exporting country? Europe holds a tradition of dedicated research and development while China is a global leader in manufacturing and through a coordinated effort, a relationship between these two regions will form an almost limitless solar industry. There is certainly a need for investigation in the solar
energy market to get a better understanding of how the major players will shape the future of solar industry.
1.2 Objective of the study
The main goal of this study was to determine the market dynamics of solar energy worldwide with focus on China's potential for domestic and international expansion. The market development of solar energy is strongly dependent on the policy, technology development and transfer, and economics of solar energy products. Thus, state of the art of technologies were surveyed by analyzing public and academic documents. Policy incentives used stimulate the solar energy market were also reviewed. The needs for the cooperation between Europe and China was discussed to address the feasibility of the technology expansion.
1.3 Methodology
A combined methodology was employed, using both quantitative and qualitative instruments. Data was collected from a variety of European companies to gain a clear perspective on their approach to expansion into the Chinese market, as well as their business objectives within Europe. Next a literature review was performed to examine both the political climate in both regions of the study as well as social aspects affecting both Europe and China.
2 Introduction to Photovoltaics and Energy Economics
2.1 A History of Solar Energy
World Historical Overview
In 1839 a French physicist first discovered the photovoltaic effect while experimenting with an electrolytic cell made up of two metal electrodes.[4] After, the first intentional PV device was developed by the American inventor Charles Fritts in 1883. He melted selenium into a thin sheet of on a metal substrate and pressed gold-leaf film as the top contact. Later on, in 1954 researchers at Bell Labs accidentally discovered that p-n junction diodes generated a voltage when the room lights were on. Within a year they had produced a 6% efficient silicon p-n junction solar cell. The same efficiency was achieved the same year by the group at Wright Patterson air force base in the USA, only this time, they used a thin-film hetero-junction solar cell based on Cu2S/CdS. By the year 1960, several documents were written showing different solar cells built using different materials for the p-n junction, some key documents written by Prince, Loferski, Rappaport and Wysoski, Shockley and Queisser developed the fundamentals of p-n junction cell operation including the theoretical relationship between band gap, incident spectrum, temperature, thermodynamics and efficiency [5]. In the years to come the US and the USSR space programs played an important role in the R&D of solar cells, since they were the main energy source to power their satellites.
The year 1973 was very important for PV technological advancement. First the “violet cell” was developed, having an improved short wavelength response leading 30% relative increase in efficiency over the most advanced silicon cells at that time. Also, the same year an important event occurred called the Cherry hill conference. During this event a group of PV researchers and heads of US government scientific organizations met to evaluate the scientific merit and potential of photovoltaics. The outcome was the decision that photovoltaics was worthy of government support, resulting in the formation of the US Energy Research and Development Agency, the world's first government group setup whose mission included fostering research on renewable energy, which ultimately became the US dept of Energy. Finally in October, the first oil crisis pressed all the governments worldwide to encourage the use of renewable sources of energy, especially solar. [5]
From this point, solar research had the momentum and funding it needed from fuel providers, electric utilities and other interested parties to make a real impact on the energy industry. However,
this didn't last long because in 1982 the public funding was cut by the national governments worldwide. It is due to this withdrawal of support that has left the impression that solar power cannot succeed without substantial subsidies. Yet progress did not stop, it just switched direction and rapid changes in the technology and PV industry and parties interested took place to begin a transformation of the energy industry. All around the world energy sustainability was getting more attention because of energy security issues and climate change. But the reasons for these sustainable changes should not only be attributed to social environmental consciousness. The main driving factor, as with almost all emerging industries, is economic sensibility.
At the same time the fossil fuel industry was experiencing problems with supply and cost, China's economy was developing at incredible rates. As of 2005, for example, China accounted for almost 30% of global growth where the European community accounted for just 5%. And as China develops, the amount of oil needed for economic expansion is comparatively more per unit of growth [6]. All of this indicates that even with the most optimistic view of conservation programs, sustainable energy generation will have to increase if development is expected to continue at current rates. Fortunately a healthy mix of sustainable energy generation technologies along with the gradual phasing out of widespread fossil fuel use is one likely scenario for the future.
However, the most recent expansion of solar power is occurring mainly in Germany and Japan. At first glance this might seem surprising since neither Germany or Japan have a large amount of sunlight, but their lack of fossil fuel sources combined with a national government committed to sustainable energy programs have enabled solar power to thrive. Together these two countries, with Japan's sunshine program and Germany's 100.000 solar roofs program along with several government subsidies account for a full 69% of the world market for PV as of 2005. Also, the rate at which this market is expanding is encouraging - from 85 MW in 1995 to 1.1 GW globally in 2005. So the question here is: how can the PV industry take advantage of China's booming economy? It is clear that the proliferation of PV technology in China will not be routed in environmental policy so what will be the driving force?
Chinese Historical Overview
The first PV manufacturing companies were established in China during the late 1970´s mainly to help supply the demand of the first pilot space and terrestrial applications that where launched during these years [3].
Initially, these first companies were using waste raw material from the integrated circuit (IC) industry, but during the years 1985 to 1990, China used solar cell manufacturing equipment mainly from the USA. The first two large scale cell manufacturers in China were Ningbo and Kaifeng, with government support, they introduced key equipment into their cell manufacturing process. After, Qinghuangdao Huamei began production by purchasing new solar cell manufacturing equipment. Next, Yunnan Semiconductor started manufacturing with second-hand production equipment. Finally, Shenzhen Yukang and Haerbin Keluona set up a non-crystalline silicon solar cell manufacturing production, being the last ones of this period. By 1990 solar Chinese companies had established a total manufacturing production capacity of 4.5MWp [7].
During the next few years, the main companies began to innovate in solar technology, the production of solar cells increased and the manufacturing process improved. However, the first generation of manufacturers were very dependent upon the central government’s policies and by that time the government did not provide enough incentives to innovate and experiment with new technologies. Therefore, even though China had a total manufacturing capacity of around 5MWp, a lot less was actually produced due to serious equipment bottlenecks in different parts of these production lines. By 1998 3MWp of solar cells were actually produced [8].
After the year 2000 China experienced an era of very rapid growth within the solar market, in particular for solar thermal applications. New companies starting to appear, but in this case, with private/public partnerships, therefore all the producers were driven by a global market demand and were not dependent on the central government’s policies. Some of their manufacturing equipment still had to be imported, but in this case from Europe and not from the USA, wihle the rest of the equipment was produced domestically.
In 2001, Baoding Tianwei Yingli Solar became the first company to manufacture using single crystal instead of crystal silicon solar cell manufacturing technology and built a 3MWp polysilicon solar cell manufacturing production line. Another company, Wuxi Sun Tech built a 10MWp solar cell manufacturing production line [7].
Due to the rapid market demand in Europe (especially Germany) between 2003 and 2006 market Wuxi Sun Tech and Baoding Tianwei Yingli Solar expanded their capacity to meet demand, and more companies began to build solar cell manufacturing production lines.
In the R&D area, during the 2001-2005 period, between 5.2-6.2 M € were provided for PV research, development and demonstration projects. The public budget provided for the next five year plan (2006-2011) is 12.4 M €. As a comparison Germany's devoted a budget for R&D of 24.4M € while Japan invested 147 M € [3].
Solar cell Crystal-silicon solar cell Non crystal-silicon solar cell
1673 MWp 1629 MWp 44 MWp
Table 1. China solar cell capacity, year-end 2006 Source: THT Research[7]
Of all the material technologies that can be used to manufacture solar cells, only two are being produced in an industrial scale, mono crystalline silicon (mono-Si) and polycrystalline silicon (poly-Si). Amorphous silicon is also being produced but at a much lower scale (less than 10% of the total production). In this aspect, China follows the world's trend in PV manufacturing technology, where technologies based on crystalline silicon account for 93% of the world market share [7].
China has invested a very limited amount of money in R&D compared to some other countries, their main interest has been focused in decreasing the production cost per unit and increase the quantity of modules produced using the technologies available in the market rather than improving them or developing new ones that could achieve higher efficiencies or produce a noticeable decrease in the use of silicon [3].
Table 2.Best conversion efficiency of various solar cells developed in laboratories in China and in the world [3]
Table 3. Commercial solar PV and module efficiency in China and in the world [3]
Finally, the increase in Chinese production compared with the global trend is of great interest. While global PV production has been growing at an average rate of 36%, the annual growth capacity in china is nearly double that of the rest of the world with an average annual rate production of 70%. It remains to be seen if China will be able to continue with this incredible growth rate, however, there is much innovation and manufactures across the PV supply chain have come up with some interesting strategies which are explored later in this paper.[3]
2.2 PV Operation Principles
As its name implies, photovoltaics is a technology that converts light (photo) directly into electricity (voltaic). The name of the individual photovoltaic element is known as solar cell, which is made out of materials called semiconductors.
The most used semiconductor material is silicon, which in its naturally occurring state has the unique property of 4 electrons in its outer orbit, allowing them to form perfect covalent bonds with four neighbouring atoms, thus creating a lattice. The obtained crystalline form is a silvery, metallic-looking substance.
In its pure state, crystalline silicon is a poor conductor, due to the fact that all of the electrons in the outer orbit are bonded and cannot freely move. To change this behaviour, pure silicon has to go through a process called doping. In this process some “impurities” (eg. C, N, As, B) are added to the material [9].
According to the type of material added, the semiconductor receives the P or N classification.
● N-Type: Arsenic or phosphorous is added and since each element has 5 electrons in their
outer orbit, there is one electron that has nothing to bond to, therefore is free to move within the material. By adding several atoms of arsenic or phosphorous, enough electrons will be able to move, allowing an electrical current to flow through the material. The name “n-type” comes from the electron's negative charge.
● P-type: Boron or gallium is added. In this case each one has only 3 outer orbit electrons, and
when added to pure silicon, there is a hole in the structure where one silicon electron has nothing to bond to and is free to move. The absence of electrons creates the effect of positive charge, hence the “p-type” name [10].
These electrons are occupying a band of energy called the valence band. When some energy is applied and exceeds a certain threshold, called the band gap, these electrons are free to move in a new energy band called the conduction band, where they can conduct electricity through the material.
The energy required for the electrons to migrate to the conduction band can be provided by photons which are particles of light. Figure 1 shows the idealized relationship between energy (vertical axis) and the spatial boundaries (horizontal axis). When the solar cell is exposed to sunlight, photons hit the electrons in the valence band and give them enough energy to migrate into the conduction band. There, a n-doped semiconductor contact collects the conduction-band electrons and drives them to the external circuit where they can be used to create electricity. Then they are restored to the valence band at a lower (free) energy through the return circuit by a p-doped semiconductor contact.
Figure 1: Schematic of a solar cell[5]
This is all possible because sunlight is a spectrum of photons distributed over a wide range of energy. Photons with greater energy than the band gap can drive electrons from the valence band to the conduction band and can travel through the external circuit to produce work. Photons with less energy than the band gap cannot excite the free electrons, and instead, that energy travels through the solar cell and is absorbed as heat.
The voltage at which electrons are delivered to the external circuit are slightly less than the band gap. This voltage is measured in units of electron volts (eV), thus in a material with 1eV band gap the voltage delivered by a single cell is around 0.7V. Therefore multiple cells are connected together (usually 36) and encapsulated into units called PV modules which is the product usually sold to the customer.
2.3 Attempts at Commercialization
Solar power has certainly had chances in the past to commercialize but did not succeed on a large scale. In the first instance of interest, solar collectors at the beginning of the 20th century were widely being used for agricultural irrigation. Also, the American Southwest was a perfect testing ground for solar collectors, which by 1915, 30% of the homes in Pasadena California used solar energy to generate hot water. Aubrey Eneas, a solar entrepreneur in this Californian area, made a large effort to commercialize this technology and created a large truncated cone collector to heat water that powered a steam engine for running irrigation pumps. Unfortunately his designs were not
able to stand up to the unpredictable weather of this region such as dust devils, wind storms and hail. Eventually he gave up believing that this type of solar power would never become economically viable [2].
The next instance, through some very fortunate laboratory accidents at Bell Labs, came in 1954 with the first working photovoltaic cell. Naturally, the prospect of limitless energy from the sun was of great interest to the international scientific community and governments alike. Progress was swift and consistent as the emerging PV industry enjoyed dedicated support from governments and private funding. This continued through the 1970's and as a result of the oil shock, the US President Carter's administration approved a $3 billion program for the development of solar energy. The White House even showed its support by installing solar panels on the roof. However, this was the extent of the progress that started in in 1954 and as Ronald Reagan entered office in 1981, research and funding slowed dramatically. By 1986 the solar panel showcase on the roof of the White House was removed, funding for alternative fuels was cut and oil prices began to drop. The message was clear that solar power was not priority of the moment and would have to wait. And at this point, as the United States accounted for 80% of the world's solar power, their actions affected the rest of the world and overseas governments in Europe and Asia followed in step [2].
The reasons for the past failures to commercialize this technology are access to a cheaper and more available alternative to solar energy (fossil fuels) and a drastic change in political motivation. These 2 elements are no longer present which is why solar power will finally have a real chance to commercialize on a massive scale. First, the price of oil has risen dramatically from it's recent low in 1998 at $15.24 to it's current high which is consistently in the $50-$60 range [11]. The next motivator is the serious environmental situation facing the world. Environmentally responsible nations see sustainable energy as the main tool for reducing green house gas emissions, which is one aspect that did not exist in the past. Finally, as PV technology is being proven cost effective in some areas of the globe, most notably Germany and Japan, many other national governments wish to remain competitive in this high-tech field and have begun to develop their own solar infrastructure. Simply put, the hindrances that existed in the past no longer exist and there are several new motivations that almost guarantee solar power will continue to grow and become competitive with other forms of more conventional energy
2.4 Applications of PV Technologies
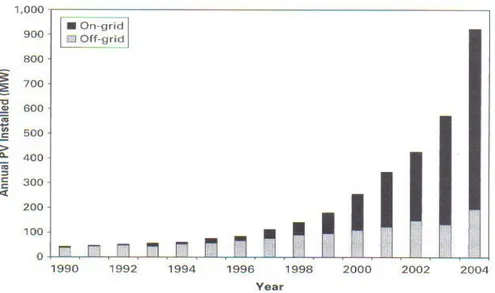
Another dramatic change that occurred to help the industry expand was the increased use of PV for grid-connected applications. Typically, in the past, PV was dominated by off-grid applications where PV provided a more economic means of delivering electricity than connection to the grid or the use of batteries. Off-grid applications can take many forms, such as the familiar PV power calculator or also irrigation pumps and freshwater distillers for example. However these systems are limited to delivering power only when the sun is shinning. Other larger systems for home power use can store electricity in batteries for use at night or seasonal storage. Another market segment which is perfect for PV is that of remote industrial photovoltaics. Remote lighting, highway construction signs and parking ticket dispensers are examples of this. A third market segment exists in rural electrification. Often it is too expensive to power a house located far away from existing power lines so instead of extending connection, a PV system including a battery and charge controller can be installed at a much lower cost. In developing countries, for example, an installation of 50 Wp PV for 500 $US can replace the monthly cost of kerosene, batteries and candles through a low-interest loan from institutions such as the World Bank [12].
These PV applications are still expanding today, but in the mid to late 90's a dramatic shift of PV usage shifted towards grid-connected power. This is mainly due to the Japanese sunshine program and the German 100,000 solar roofs program. These initiatives were the result of increasing electricity prices, a will to escape dependence on foreign fossil fuels and environmental concern. While total solar applications have grown at a rate of 29% per annum, grid-connected applications have grown at a rate of over 50% per annum.
Another large PV application is centralized systems. In 2006, centralized PV systems only accounted for 2% of total installed power, but this is rapidly changing. In Sarnia, Canada, for example, the Ontario government has begun the process of installing 40MW of centralized PV power [13]. Furthermore, centralized PV systems have the potential to expand exponentially as about 1/3rd of the earth is covered by sun-rich deserts and if just 4% of this land area was used for PV, all of the world's energy needs would be covered (even with current efficiency levels) [2]. To achieve this, some some issues still have to be solved, such as electricity transmission, however the use of hight voltage direct current (HVDC) transmission is likely to solve this problem since it can be cheaper than conventional AC transmission lines under certain conditions, and the losses in the system could also be significantly lower.
Figure 2. Growth in annual installation of grid-connected and off-grid photovoltaic cells, 1990 to 2004. (Source: Solarbuzz, 2005)
Also, a recent entrant and interesting business sector of PV is micro-scale PV systems. In the last few years, there has been a significant effort in the commercialization of these applications such as lightning systems for gardens, solar LED street lighting and some other stand-alone small applications. The price drop in PV systems and a more environmental global consciousness are helping these technologies spread fast and are becoming very common solutions for these very specific applications. Companies like China Technology Development Group currently offers have a wide range of this applications in their portfolio and are creating cooperation partnerships with companies in Europe to increase their position in the market [14].
2.5 Current Situation of Photovoltaic Industry
The current situation is positive, yet somewhat uncertain. As the silicon shortage is ending, there is some speculation about whether the companies who have committed to increase supply will follow through on their promises. The growth rate of the industry as a whole, although it has slowed a little in 2006 due to the shortage, is expected to increase again. Also, in lieu of the shortage, other technologies have stepped in to fill the gap. Thin-film technology is becoming much more competitive. A good example of this is the American company Nanosolar which is based in California. They have secured 100M US$ and are building a plant that will produce 430 MW of cells.[15] This number is extraordinarily large considering that in the year of 2006 only 1.520 MW were installed worldwide.[16]
The current worldwide capacity as of the end of 2006 was 5.737 MW where 588 MW was used for off-grid applications. The European Union accounts for more than half of the installed PV with 3.220 MW of which 112 MW is off-grid. If these figures are put over population, the EU also becomes the region with the highest per capita usage with 6,533 Wp/capita, mainly thanks to Germany which produces 34,8 Wp/capita. Japan produces 13,4 Wp/capita, but both Germany and Japan are behind the world leader: Luxembourg 50,54 Wp/capita. Yet, with a population of less than 500.000, Luxembourg does not have to face the same challenges of scale as Germany and Japan.[16]
The main driving force for the increased production of PV in recent years is the reduction in price thanks to both economies of scale and incentive programs. New incentive programs are appearing in many emerging markets as well, most of which are following the hugely successful German feed-in tariff program. For example, Canada has begun usfeed-ing a feed-feed-in tariff under the Renewable Energy Standard Offer Program of 0.42 CAD/kWh for grid-connected PV and is expected to become a renewable energy hot spot for North America. France has an even higher tariff which can reach up to 0.55 EUR/kWh when used in the form of building integrated photovoltaics (BIPV). Italy also instituted their own version of the German system and offered 0,445 and 0,490 EUR/kWh, however they were not as successful in 2006, their launch year.[17]
The main players in the PV industry are divided across the supply chain, some focusing on the production and refining of feedstock materials, some involved in the fabrication of PV wafers, cells and modules and some have even stretched themselves across the chain and are involved everything from silicon extraction to the fabrication and installation of PV arrays. The leading companies involved in silicon production are Hemlock, Wacker and REC. All 3 of these companies have begun the process of expansion due to the increased need from the PV industry, but the extra output will not be ready to match the 2007 demand. The current leading cell manufacturers are Sharp, Q-Cells and Suntech. Each company has stated they plan to increase capacities even in the midst of the supply shortage. And it is this fact that has created some uncertainty in the market which is evident with falling stock prices from some of the major solar companies such as Sunergy, SunPower and Solarfun Power Holdings.[18]
Although the future of solar power looks bright, there are still many obstacles for solar companies world wide.
2.6 Causes for Photovoltaic Expansion
Political and Financial
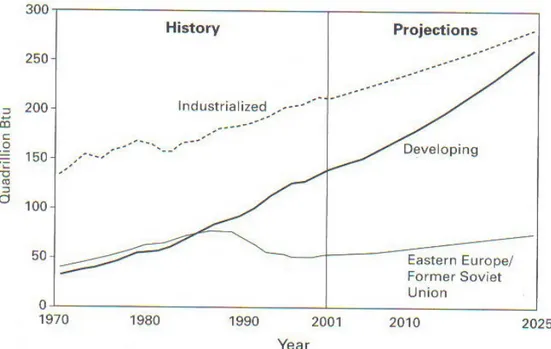
Predicting any future scenario regarding future energy usage is a difficult task, and industry specialists from all forms of power generation have quite different opinions. However, one of the most cited models for predicting long term energy production originates from the U.S. Department of Energy's Energy Information Agency (EIA). This group is responsible for producing an annual forecast report for world energy use, titled the International Energy Outlook (IEO) as well as the Annual Energy Outlook (AEO) which includes predicted prices for fossil fuels and electricity. [19], [20].
Figure 3. World energy consumption by region from 1970 to 2001 with forecast through 2025 (quadrillion Btu). Source:
EIA (2004)[2]
There are several problems with the assumptions made in these reports. Firstly, a critical mistake that has been made was the assumption that through productivity improvements, additional production and new pipelines, the inflation-adjusted price of energy will remain the same in 2025 as it is today even as the predicted need for fossil fuels will like be 50% larger. Since peak production of oil has been reached and in 2004, the world required a full 99% of global global capacity, there will likely be a sharp increase in price due to limited supply and increased demand. And to solidify
this point, in 2004 and 2005 when oil prices where 70% higher than 2002 levels, the increased price was higher than any point in the EIA forecast up to 2025. Naturally, a counter argument to this is that prices are cyclical and as the price of oil goes up, more is invested in infrastructure to increase supply and moderate the demand thereby lowering the price. However, at this stage, the scale and time line do now allow for a significant price reversal. The reason for this is that investors are fully aware of the declining production and if growth rates are expected to be maintained, it is estimated that capital investment will have to increase to 500 billion $US annually between 2001 and 2030, a rate twice that of the 1990's. And to add to this, large new projects to increase production take years or even a decade to bring on-line, and in the meantime, as the early 2000's have shown, energy prices can fluctuate wildly during a project lifetime possibly making the net investment a loss.[2]
The second problem, which is a problem with all models about future energy scenarios, is the unforeseen political climate in the years to come. It has been proven recently how severely oil prices can be affected with conflicts in the Middle East. If instability continues, as it may well with the growing pressure between the United States and some middle eastern OPEC countries, oil prices could go up even higher if production levels are affected. This relates directly to a reliance on foreign energy, which is a major benefit of renewable energy, but since this threat is not quantifiable in financial term, this aspect is often overlooked in energy reports and only mentioned in a cursory manner. And with every international conflict involving oil supply, the case for solar power gains attention.
Energy Payback Time
One argument that has plagued PV power is that the energy payback time is too large, which is to say that the energy required to fabricate solar panel from silicon extraction and refining right up to installation and eventual decommissioning is too large to warrant the use of PV at all. The environmental question surrounding solar power indeed needs investigation, since currently the majority of energy generated is from unsustainable sources. After all, if solar panels required more energy in fabrication than they produced over their lifetime, there would be a net energy loss which would only contribute to environmental problems. Thankfully, although this was once the case, the gains in efficiency for solar panels have increased to a point where the energy pay back period is just a fraction of a PV system's lifespan. Richards and Watt from the Centre for Photovoltaic Engineering at the University of New South Wales have rearranged the standard model and come up
with some modifications that put solar power on a more level playing field with conventional energy generation technologies.
The widely accepted but out of date formula for energy payback time is as follows:
This model misses one key factor, which is the lifetime of the module. The EPT in this form will yield a value that does not demonstrate the potential power generation after the full energy payback has been reached. Furthermore, using this type of indicator only serves to perpetuate the myth that PV is does not able to generate as much power as was needed to create it. Also, over the course of the lifetime of a PV system, there are several components that might need replacing such as an inverter, a battery bank or other structural components. This affects the EPT significantly and these factors are not as easily inserted into the original equations.[21]
The solution to this is relatively simple, but it completely shifts the objective of the calculation. Instead of looking at the amount of energy created versus the amount it required to build, the energy yield ratio, or EYR, can be used to show how many times the energy invested is paid back over the useful lifetime of the system. The equation for this is as follows:
It can be seen here that if a product has a useful lifetime of 20 or 30 years (as is the case with many PV products today), the EYR reflects a much more useful figure to consumers.
Table 4: Calculated EPT and EYR (over both a 20 and 30 year period) for 3 selected scenarios[21]
In this table, taking scenario 1 as an example, where it would take 2,2 years to repay the energy input using the EPT calculation, there is a much higher ratio EYR of 9,3 and 13,9 for output to input energy for 20 and 30 year systems respectively. This is a much clearer demonstration of how the energy produced by PV can be repaid and does not mislead consumers to false conclusions about solar power.
Environment
As previously mentioned, for PV to have a positive net effect on the environment, it is important for PV systems not to require more energy in fabrication and maintenance than they produce. Since efficiencies have risen so much in the past decade, this is clearly possible. However, for this fact to remain true, it is important to consider how much sunshine is available for each system. Certain areas of the world have higher insolation levels and can rightly claim to have a larger net energy production such as China, Southern Europe, Australia and most equatorial regions. Unfortunately, some of these regions do not have the economic and political mechanisms needed to stimulate growth for the adoption of PV.
Yet this is the area where environmentalists and policy makers should be focusing their attention since the greatest gains can be accomplished in these regions. India and China are two of the most rapidly developing countries in the world and as their energy requirements grow, so too does their pollution of greenhouse gases. Thankfully, there is an array of incentives for more sustainable options that will likely curb the increase in GHG emissions, and although solar power currently accounts for less than 0.5% of global installed capacity, this will change drastically in the future because of solar power's impressive growth rates over the past decades.
For example, China has put in place several incentives which include favourable import customs duties for renewable energy products, various subsidy programs for all kinds of renewable energy technologies including wind, biogas and solar, which is investigated in greater detail in chapter 4 of this paper.
3 Technologies
3.1 Crystalline
Crystalline Silicon technology (c-Si) accounts for more than 90% of the actual PV systems in the market, the reason why its presence is so high its because it has use all the technology and R&D of the semiconductors for the electronics industry since the 1960's. Furthermore, silicon is one of the most abundant minerals in the earth's crust, giving refineries a virtually unlimited supply resources.
However, silicon is a very brittle material, requiring relatively thick cells (~300um, although 100um thick cells can be obtained using the latest sawing technology), therefore some of the electrons excited by the photons have to travel large distances inside the materials, losing energy in a process called recombination, where electrons return to their valence band. Consequently a material with high purity and structural perfection is required. To avoid this loss, the electrons must be highly mobile, as they are in pure silicon. Imperfections and impurities can absorb the electron's energy and convert it into heat, impeding the electron's ability pass through an electric circuit.
Once silicon of the desired purity is obtained, it is then put together into ingots and then cut into wafers using a saw. Wafers stand for about 65% of the module cost, equally divided between purification, crystallization and sawing. For many years the PV industry have used scrap silicon from the IC industry, but the increase of PV demand has nearly exhausted this market. The Siemens method for obtaining silicon is the most used worldwide but it has been considered ultimately too expensive for its use in PV. The purity it provides, however, is well above what is necessary for the fabrication of solar cells.
During the 80's, an attempt to fabricate low-cost solar silicon (Sol-Si) did not succeed due mainly to the low demand at that time. Today, some new attempts are being made, from just simplifying the Siemens method, or by using totally different techniques to purify and process the silicon. A very important advance in solar cell fabrication has been the demonstration of cells with high efficiency made from wafers containing hundreds of large-grain multicrystals (1-10mm), called multicrystalline (multi-Si), or polycrystalline (poly-Si). The multi-Si growth procedure is much faster and the wafer is cheaper. Because of the random orientation of the crystals, there's an efficiency drop of a few percent (absolute) compared to a mono-Si wafer, but taking into account that the cells are cheaper, the price per watt peak remains the same on a per-module basis. The simplicity of the multi-Si wafer-growing equipment and process offers a clear trend towards the use
of this option for mass scale production.
Although the solar cell manufacturing process represents a relatively small fraction of the total cell cost it strongly affects the overall cost in $/Wp, because it determines the cell and module efficiency. The efficiency depends of the wafer and ribbon utilized, but it also greatly depends on the manufacturing process itself.
Efficiencies over 25% have been achieved for laboratory cells in a long complex manufacturing process, where every possible efficiency-improving factor has been taken into account to obtain a nearly-ideal device structure. When transfered to commercial mass producing scenarios, the efficiencies obtained are around 15% for single-crystal cells and 13% for multi-crystal cells. In modules these efficiencies are reduced to 14% or 12% due to the redefinition of the area that now includes the module frame.
The existence of this big efficiency gap between laboratory and commercial cells together with an increased market demand suggest that new higher efficiency cells will appear in the years to come, some companies have achieved 17-18% efficiency cells in production. There are some other factors that can also be improved, the manufacturing yield, for instance, is around 95% giving some gap for improvement, and finally, at the end of the process, the interconnecting and encapsulating process can be done using better automation and using cheaper materials helping reduce the overall cost of crystalline cell modules. [5]
3.2 Thin Films
Around 10 times more crystalline silicon is needed to absorb a given fraction of sunlight compared to other semiconductors like GaAs, CdTe, Cu(InGa)Se2 since silicon is the weakest absorbing semiconductor used for solar power. Therefore, thicker wafers have to be made when working with crystalline technologies and, because of the size, higher quality material has to be used because of the longer paths the high-energy electrons have to travel before reaching the external circuit.
During the same years c-Si PV cells were developed, it was shown that other semiconductors could be used for electricity production. When this material is used to make solar cells, so little of this material is required that a foreign material is needed to physically support the cells. During the first years of thin-films development, 4 technologies achieved higher efficiencies than 10%, Cu2S/CdS,
a-Si, CuInSe2/CdS and CdTe/CdS. Cu2S/CdS disappeared soon due to stability problems related to electrochemical decomposition.
The main advantage of the thin films is the lower price they could achieve once set into a mass production scheme.
The lower price of thin films derive from the following characteristics:
● They are typically 100 times thiner than Si wafers (between 1 to 3 um) deposited on
low-cost substrates such as glass, metal foils, and plastics.
● The temperatures used to place the material on the substrates is much lower (200 to 500 C
vs 1400 for c-Si).
● They can tolerate higher impurities, therefore needing cheaper purification of raw material. ● They are integrated into a monolithic interconnected module reducing the module
connection costs.
Even though price is a very good reason for thin films to take a big portion of the market share, crystalline-based PV still dominates around 94% of the market because thin films still have lower efficiencies and there's much less developed technology for their manufacture. Consequently, high amounts of capital are required to build manufacturing plants due to the fact that the techniques used have to be developed some times from scratch. Thin films industry couldn't adopt a mature technology like the Si PV community did from the Si electronics industry.
Analyzing the most used technologies, the first one, with Amorphous Silicon (a-Si) films are typically deposited between 150 to 300 centigrades allowing the use of low cost substrates, such as glass, steel foil, or plastic. All practical a-Si solar modules contain multiple junction devices where two or three junctions are grown on top of each other, allowing more efficient use of sunlight. Even though a-Si has showed efficiencies up to 15% for triple junctions under laboratory conditions, it usually presents a lower efficiency when compared to other PV technologies but has the advantage of being temperature-independent, when other technologies can lower their efficiencies up to 4% when exposed to high temperature outdoor conditions (eg. summer). a-Si technology is the most common used in the thin-films area, but it still has to overcome certain factors such as:
● Minimize the self-limited degradation (reduced a-Si panels efficiency by 2 to 3%)
● Increase the faster, low-cost manufacturing process by increasing the deposition rate of the
layers and the utilization of gases.
Another Thin Films technology is the Cu(InGa)Se2 alloys, that have achieved the highest efficiencies (between 12 and 15%) but were limited by the low band gap. By using different empirical methods, the maximum achieved efficiency has been 19%, by adding different alloys that increase the band gap and increase the efficiency of delivering the electrons to the circuit. The three major challenges for this technology are:
● Control the composition of the alloy through the film in a manufacturing environment on a
moving substrate.
● Find alternative junction partners to replace CdS
● Find new alloys or new deposition methods to increase the efficiency by achieving higher
band gaps.
Finally there are the thin films of CdTe, they have been studied since the 1970's, one main difference this last type of thin films has compared to the mentioned ones, is that there are over 10 methods to deposit the CdTe films that have produced CdTe solar cells exceding 10% efficiency. There are 4 available commercialy are: Spray Pyrolisys (SP), Electrodeposition (ED), Vapor Deposition (VD) and close space sublimation (CSS). The highest reported efficiency for cells based on this technology has been 16%. Even though some CdTe modules have been in outdoor field-testing for over 10 years withouth major degradation, some other CdTe modules have degraded considerably. Of all the mentioned Thin Film technologies, CdTe is the one that presents the more ammount of challenges as follows:
● Cu seems to produce a high efficiency device, but affect the long-term stability.
● Various optimization methods should be better understood so they can be simplified and
transfered into a mass scale production scheme.
● CdTe modules are more sensitive to outdoor interaction (O2, H2O) requiring better
encapsulation methods.
● Safe and cost-effective strategies of Cd usage in the workplace and recycling should be
3.3 Concentration PV Systems
Due to the cost of solar cells, focusing concentrated light onto a small area have been always considered a way of reducing costs. In order to make it profitable the concentrators required should be cheaper than the area of solar cells they are replacing, another condition that has to be taken into account is that the solar cells efficiency should not decrease under concentrated sunlight. The first condition is usually easily fulfilled because the concentrators can be made using low-cost optical devices, the second one is a little bit trickier due to the fact that in order to keep the cells permanently in focus, active tracking systems are required, significantly adding costs to the modules. Also, even though the cells efficiency should increase with increase luminous flux, in practice due to the high currents in very small areas, the ohmic losses make this efficiency drop, therefore additional care have to be put into solar cells used in concentration systems to minimize this effect.
Another effect present when using concentration PV systems, is that only direct sunbeam is collected since diffuse light is not focused, this reduces the electrical output by 15% approximately. This can be fixed when using 2-axis tracking systems to keep the solar concentrators facing the sun directly all the time.
Analyzing all the gains and losses, and taking into account that the cells efficiency keeps getting higher, the tendency is that concentration PV systems are more efficient than conventional c-Si technologies and it is also believed that concentration systems should ultimately be cheaper than module silicon solar cells, however, due to the lack of real market, this statement cannot be confirmed in practice.
Currently, concentration systems are suitable for large installation rather than for domestic use because there is not a large amount of companies manufacturing concentration PV systems, therefore they have large general cost for small production volumes. However, the situation may change, and with the help of cheap optics, and efficient and low-cost tracking systems, this concentration PV systems can make a very good use of high-efficient solar cells.
Even though of the three reviewed technologies, a-Si has the lowest efficiency, it was commercialized much earlier, and therefore now has a much greater manufacturing capacity compared to its thin films competitors. One of the reasons for this to happen is that CdTe and Cu(InGa)Se2 have no real application outside photovoltaics, so, just independent research groups
and laboratories have been working in developing these technologies during the last few years, but it has to be taken into account that translating research-grade cell performance into commercial production line modules is a very challenging task, delays from 6 to 8 yeas are typical to achieve the same lab-obtained efficiency in production lines. [5]
3.4 Under Development
As previously mentioned in section 2, the energy that comes from the sun as a light form is very hight but spread over a wide spectrum, therefore presenting a low energy density.
The energy that can actually be converted by solar panels is the one provided by those photons with higher amount of energy than the band gap, all the remaining energy from the photons that hit the panel with low-energy levels are transformed into heat in the back of the panel.
For this reason, there is strong development being done to increase the utilization of the different energy levels provided by sunlight's photons. A way to achieve this is by stacking cells of semiconductors with different band gaps. The cells with higher gap semiconductors are placed on top, therefore absorbing the higher energy photons and letting pass through the lower energy ones so they can be absorbed by inner cells of lower band gap semiconductors.
The theoretical limit for an infinite number of cells stacked together with different band gaps is 86% while with a single junction cell only 40% maximum efficiency can be obtained. [5]
Since multijunction cells are considerably more expensive than single junction cells, their application niche is mainly for spacial applications where price is less relevant than performance in most cases. However, they can be used for terrestrial applications using concentrators to reduce the amount of cells required. There is a trend to develop cells operating at 1000 suns [5].
The prospects for this technolgy are very promising, since they predict in the long-term, to produce electricity competitive with conventional sources.
Multijunction cells are also crucial for the thin-films, the highest cell and module efficiencies reported for a-Si thin-film PV technology are for triple junctions. The band gap of various polycrystalline alloys can be varied with alloying.
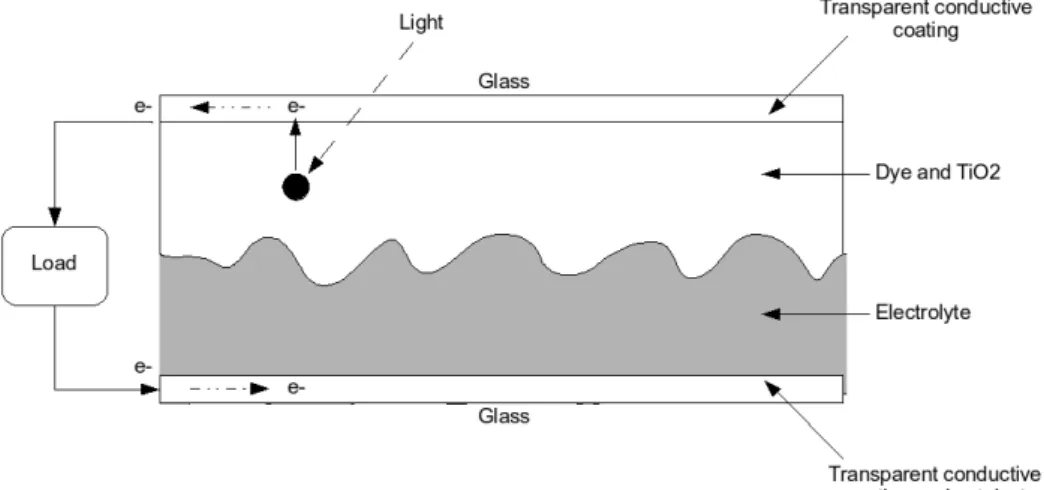
Another technology that is getting a lot of attention its called Dye-sensitized Solar Cells (DSSC). Instead of working based on the photovoltaic effect, they work on charge between molecular orbitals, as in photosynthesis. They consist of a photo-sensitized anode and an electrolyte forming a photoelectrochemical systems.
Even though, this technology has been previously studied, cells had poor stability, until 1991, when Michael Grätzel and Brian O'Regan at the École Polytechnique Fédérale de Lausanne[22] developed drastic improvements in the performance of DSSC. Therefore this solar cells are also known as Grätzel Cells.
The Grätzel cell follows the same photosynthesis principles plants employ. A layer of dye molecules, where light absorption is performed, is added to a mesh of nano-particles of a semiconductor, TiO2 (titanium oxide) placed on the bottom of a glass substrate acting as a
transparent conducting coating. When a photon hits the dye's surface, an electron is transferred to the semiconductor (TiO2) in a process called injection. This excited electron moves to the anode on
top of the cell where it can be extracted and transferred to the load. A positive charge is then transfered now from the dye's surface to an electrolyte between the two layers of glass substrate that encapsulate the cell and then to the counter electrode connected after the load. With this last electron transfer, the charge in the electrolyte returns to its reduced state thus closing the circuit.
The operation principle is represented in the figure shown below:
DSSC is a promising technology mainly because of the low cost of the materials used and its assembly process is simple and easy. Some “do it yourself” kits are even available for educational purposes [23].
There are, however, some barriers to overcome before DSSC can compete with conventional ways of producing electricity:
● Efficiencies are usually around 10% or below, where low-cost PV commercial applications
are around 12-15%.
● Dealing with a liquid electrolyte, instead of solid-states devices, such as in traditional c-Si
panels, inserts a set of new limitations. Under low temperatures the electrolyte can freeze, stopping therefore the power production, and during hot conditions, it can expand, break the sealing system and start to leak.
Once these limitations have been solved, mass production of DSSC can become a reality, specially because with the high silicon prices we've experienced in the last few years, this technology can offer already a better power/price production ratio. Also, because of its operation principle, DSSC panels can work under cloudy or low sunlight conditions in such a great way, that even some indoor applications are being considered.
4 Policies
4.1 Subsidies and PV Policy
Incentives and Subsidies
The feed-in-tariff (FiT) which has fueled the German market over the recent years is an explicit monetary reward for producing PV electricity, at a rate per kWh somewhat higher than retail electricity rates being paid by consumers. The incentive does not help directly with the high initial cost of a PV system, unless the producer can use this tariff in a proposal to more easily secure financing. There are several ways the FiT can be applied: the first is where the FiT is applied to all power produced by the PV system and the second is where the FiT is only applied to any additional power above the needed of the customer. The FiT itself is usually funded sustainably, whereby it is paid for by a tax levied to all electricity users instead of from the government budget (which can change as the direction of government changes). Some countries, such as Italy, have opted for the latter method, but the incentive program put into place is too recent to draw conclusions about its effectiveness.
The core benefit of the FiT is that it can be used as a temporary mechanism to stimulate growth that is not a burden for taxpayers since the entire funding for the program is taken from a tax levied on the electricity bill of all consumers. In this way, investors can be assured that PV systems are of high quality and perform well since funding for the system is guaranteed. This incentive also forces the industry to improve performance since the annual reduction of the benefit will only encourage investors to acquire the best technology that will give them the greatest return. The FiT is also regarded as the main driver for further cost reductions and a transition to economies of scale.[24]
The reward of such a tariff varies - calculations can be made to determine the cash flow required for a certain PV installation to become competitive and provide a certain return on investment. Also, externalities can be estimated from the costs of pollution associated with traditional energy supply. Or the tariff can be based on the benefits that PV will add to the grid, peak demand of electricity or line support. And even in some cases a government might decide a standard reward will be a certain multiple of the retail electricity price.
investors or commercial entities. Specifically it will attract groups that have limited capital such as households, public organizations and small businesses if the FiT is combined with a direct capital subsidy. Alternatively, countries such as Japan, the USA, Switzerland and Australia have decided to use direct capital subsidies, renewable portfolio standards, green electricity schemes, tax breaks or some combination instead of the FiT. Generally, using a type of subsidy other than the FiT, progress in the industry is generally slower but more constant and predictable. Countries currently using the FiT include Austria, Germany, Italy, Korea, France, Portugal, Spain, the Netherlands and Canada. There are some drawbacks with this type of subsidy since industry growth might not always be consistent due to overly complex administrative requirements, caps on PV capacity or even the exclusion of large-scale plants.
Some countries, such as Germany, have avoided this situation by providing a high subsidy with a decreasing amount over time which rewards early investment. But if prices for systems do not come down as the technology expands, or if the program itself is not directly helping the target economy (instead of the foreign economy supplying the systems) progress could stagnate.
Also, the issue of where exactly to set the FiT is a major problem. Setting the FiT too high will result in overheated markets and if it is set too low the investment in PV will be negligible. Policy makers aim to set the FiT at just the right level, which with careful scrutiny of existing markets and foreign PV FiT schemes is possible, but with changing governments, lengthy pay-back periods and fluctuating energy prices, FiT rates should be constantly under revision. One solution is to only apply the FiT to a specific market segment at the beginning, and later expand to other segments. This will alleviate the need to put a cap on the FiT in terms of installed capacity.[25]
Furthermore, as the Core Group along with the European PV Industry Association have found through policy framework analysis, high levels of FiT rewards are not proportional to market size, but rather are sensitive to an incentive threshold that investors must be comfortable with. More generally speaking, the Core Group mentions that the two most important ingredients in a sound FiT plan are longevity and stability. If there is mistrust of government support for a PV subsidy, especially because of the high initial cost and predicted length of operation of the PV system, investors will not become as involved. Also a good mix of incentive instruments with well defined time frames which are contained in simple administrative packaging can be quite attractive for investment.[26]
Germany
The German subsidy system for PV is considered by the European Photovoltaic Industry Association to be the best in Europe. It has been praised as very easy to use with little administrative requirements. Because of this, the growth in the German PV market has been the best in Europe as well.
Figure 5: German PV market expansion thanks to the feed-in-tarrif[27]
Since their innovative Renewable Energy Law (REL) was introduced in 2000 which provided a buyback rate of 0,50 €. In 2004 this law was revised to and the new buyback rate ranged from 45,7 – 62,4 Euro cents which is reduced by 5% annually to avoid overheated markets.[27]
The German system itself is treated as the standard for hopeful governments worldwide to use as a model. To name a few, countries such as France and the state of California in the US have taken much of the German approach and made small changes to adapt the system to their own needs. This has not been done in China as of yet, but currently China is focusing on the international market and domestically PV is used for rural electrification – something that will be discussed in greater detail in chapter 6 and 7. For the moment, France and California will be investigated to provide a general sense of how the feed-in tariff works on a local scale.
France
The federal subsidy in France is currently the highest in the EU with a FiT of 0,55 €/kWh for Building Integrated PV (BIPV). This is composed of an initial 0,30 €/kWh which applies to all new PV installations, with an additional 0,25 € for BIPV which should last for 20 years. This benefit structure is also available outside of Continental France, in Overseas departments (DOM) and Corsica, but in this case, the initial FiT is actually 0,40 € and a BIPV addition of 0,15 €. One reason for the especially high tariffs formed in 2006 is that in 2000 the government decided on very low tariffs of 15.25 €/kWh which left PV as an unattractive option from an economic standpoint. This is especially unfortunate because France is a highly motivated country when it comes to energy reform and exploring new alternatives to their long history of nuclear power. A press release from Invest in France and the French Solar Energy Association, Enerplan, a full 98% of French people are interested in the promotion of energy alternatives and over 40% of the population believe that PV has a key role.
The future of PV in France is looking good, although they have started a bit late. Government predictions have planned for installed PV of 200MW by 2010 but after that it becomes less clear. The government is predicting growth rates less than the industry which would reach a goal of 500MW by 2015 with an annual growth rate of 10%, whereas the PV industry itself is predicting a full 1 GW with a growth rate of 25%. Investors believe the latter is more likely for 2 reason: the first is that the development of the French infrastructure will take the lessons learned from the successful German industry, and second, never before has the French public been so supportive of renewable energies, specifically solar energy.
However, there are obstacles that are not easily overcome. The amount of administration work slows down the system and as an example, 1 out of every 10 installed systems in 2006 were never connected to the grid because of administrative problems. There is a lack of expertise in this developing market and the French will have to watch out for competition coming from abroad.
Currently, the French market is dominated by 3 companies: Tenesol (co-owned by the previous state-run power company, EdF and the power company Total), Apex BP Solar (whose parent company is of course British Petroleum) and Photowatt (subsidiary of the Canadian Automation Tooling Systems Inc.). However, with the onset of neighbouring Germany's solar power experience, these French companies will have to fight hard to keep their market share. Tenesol, for example, having only sold 1.5MWp in 2006 expects to boost their sales to a full 7 MWp for 2007 thanks to
the greatly improved government aid. Many in the industry feel that companies that existed in the French market prior to the government incentives will have a better shot at capturing a greater market share. Currently there is a lack of qualified engineers and complicated bureaucracy is still a prevalent issue. To magnify these problems the installation of many small systems inherently requires more personnel.
Thankfully, the latter problem will correct itself thanks to the influx of new players in the French market. Conergy AG and Schüco International KG are examples of 2 German companies that have already established training centres in the Paris area to train new installation engineers. Specifically, training will include the new quality system "Quali-PV" program under the supervision of Enerplan that has been active since July 2007. By the end of 2007, this certification could potentially be possessed by 1000 trade companies. Also, another certification that has more to do with solar bureaucracy called "Centre Scientifique et Technique du Bâtiment" (CSTBat) has already proven it's need. A survey conducted by European Press Service shows that the major hindrance to the advancement of the PV industry is bureaucracy, which specifically refers to delays in processing feed-in contracts with new installations and lengthy approval processes.
Other companies entering the market have specialized their involvement. Biohaus, a German PV wholesaler has decided to limit their customers to continental France where the FiT is more heavily weighted towards building integrated systems (BIPV). Soleos Solar France is taking the opposite strategy and is focusing their effort in off-shore regions (DOM/TOM) where few companies operate. And even further from the mark is Donauer Solar, another German wholesaler who has decided to focus their attention on large-scale projects that will not benefit from the full availability of the FiT. [28]
It seems that there are a variety of ways to make use of this type of subsidy. In the future, the Chinese should look not only to the German market, but also the French market to learn from their somewhat different approach to the expansion of their domestic market. Next a more capitalist approach will be investigated to see what kind of incentives and programs are being used.
California
In recent history California has been a net importer of electricity. In the year 2000, at times the state had to import 50% of its power. Today that figure has fallen to 25% but the need still remains. Local
![Table 1. China solar cell capacity, year-end 2006 Source: THT Research[7]](https://thumb-eu.123doks.com/thumbv2/5dokorg/4682494.122590/11.892.174.712.270.361/table-china-solar-cell-capacity-year-source-research.webp)
![Table 3. Commercial solar PV and module efficiency in China and in the world [3]](https://thumb-eu.123doks.com/thumbv2/5dokorg/4682494.122590/12.892.115.774.150.339/table-commercial-solar-pv-module-efficiency-china-world.webp)
![Figure 1: Schematic of a solar cell[5]](https://thumb-eu.123doks.com/thumbv2/5dokorg/4682494.122590/14.892.208.694.86.426/figure-schematic-of-a-solar-cell.webp)
![Table 4: Calculated EPT and EYR (over both a 20 and 30 year period) for 3 selected scenarios[21]](https://thumb-eu.123doks.com/thumbv2/5dokorg/4682494.122590/22.892.110.785.97.232/table-calculated-ept-eyr-year-period-selected-scenarios.webp)
![Figure 5: German PV market expansion thanks to the feed-in-tarrif[27]](https://thumb-eu.123doks.com/thumbv2/5dokorg/4682494.122590/34.892.218.696.335.613/figure-german-pv-market-expansion-thanks-feed-tarrif.webp)
![Table 7: Geographic distribution of polysilicon production as a percent of total production [34]](https://thumb-eu.123doks.com/thumbv2/5dokorg/4682494.122590/44.892.172.730.891.1020/table-geographic-distribution-polysilicon-production-percent-total-production.webp)
