STUDY ON RECOVERY OF BIOGAS FROM
MIXED BIOW ASTE FOR REGIONAL
BIOGASIFICATION SYSTEM
Toshihiro Komatsu
Rokuta Inaba
Tohru Furuichi
Norio Nishi
Noboru Tanikawa
Hokkaido University, Japan
ABSTRACTEven in Japan, the energy recovery from a waste became the importance by not only waste treatment problem but also environmental problem which carbon dioxide (CO2) causes. The energy recovery is being measured from organic waste. However, the construction of the disposing facility does not advance in actually various factors. As the one factor, the property of a organic waste variously changes by the discharge source such as home, food shop, super market, farm, sewage treatment plant, etc., and the energy recovery ratio changes with it. In this study, the biogas generation of the waste which arose actually was obtained experimentally. In addition, the following were examined using waste generation in the region and the biogas from biowaste : Electric power recovery, heat recovery, CO2 emission. In the garbage discharged, the gas generation magnification showed the very high, The gas yields seemed to be very high for biowastes, since these is originally offered as foods. In case of the livestock manure, the gas yield over about 16 times per manure was obtained. The gas yield is not very dependent on the organic substance content. This cause the bedding was included in the manure, and it seemed to affect the organic substance content by the content and type. In case of the sewage sludge, the gas yield of about 3.5 times per sludge was got. As a result of the trial based on the waste generation in the region, electric power, heat can be utilized effectively. In addition, that the reduction was also possible on CO2 emission clarified.
KEYWORDS
Biogas; Biowaste; CO2 emission; Electric power recovery; Heat recovery; Regional optimization
I INTRODUCTION
In Europe, the development of various renewable energy is carried out for the enactment of the Kyoto protocol. For example, wind power generation and photovoltaic power generation, etc.
In Japan, the challenge for the protocol enactment becomes popular. In the inside, the following are carried out for the organic waste: Not only frame but also various development concerning the resources circulation of conventional waste treatment. Since it is unsuitable for heat treatment such as the incineration, in the inside, the biogasification is examined the organic waste of high water content such as garbage and animal manure. However, the case of introducing the biogasification system actually is very little. It seems to be because it is the processing technology of which the biogasification is comparatively new for these causes in waste treatment.
However, the biogasification plants for the garbage which arises from the house from 2003 works in Hokkaido. And, in Hokkaido, the livestock is popular, and the animal manure is also large arising. However, the case of processing simultaneously is little from the difference between parties concerned for garbage and livestock manure [ 1, 2).
Therefore, real data of the biogasification and further efficiency improvement seem to be important in Japan for the introduction of the biogasification. As a technique for carrying out efficiency improvement of the biogas, in the home in this study, the mixing processing of not general organic waste should be carried out.
2 MATERIAL AND METHODS 2.1 Biowastes
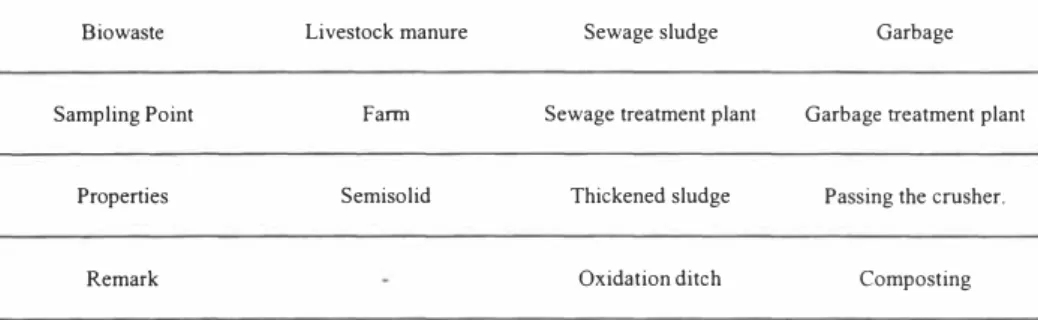
The biowaste of the biogas for this study is shown at table 1. The biowaste for the research are animal manure, garbage and sludge, as it is shown at the Table 1.
Table 1. The type of biowaste in this research.
Biowaste Livestock manure Sewage sludge Garbage
Sampling Point Farm Sewage treatment plant Garbage treatment plant
Properties Semisolid Thickened sludge Passing the crusher.
Remark Oxidation ditch Composting
2.2 Batch Experiment
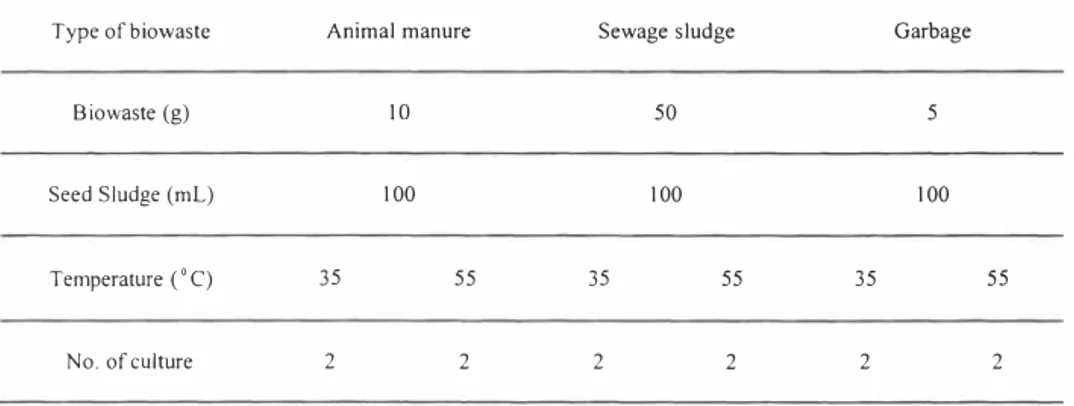
The batch experiment was carried out in order to obtain the gas yield of each waste. The culture condition of the batch experiment is shown at Table 2. The batch experiment was carried out under the condition of thermophlic fermentation and methophilic fermentation.
35 55 35 55 KALMAR, SWEDEN, November 28-30, 2005
Table 2. Cu//ure condition of batch experiment
Type of biowastc Animal manure Sewage sludge Garbage
B iowaste (g) IO 50 5
Seed Sludge (ml) 100 100 100
Temperature ('C) 35 55
No. of culture 2 2 2 2 2
Schematic drawings of the batch experiment are shown in the Figure 1. Temperature Controller
Water Bath
Figure 1. Schematic drawing of batch experiment. 2,3 Continuous Experiment
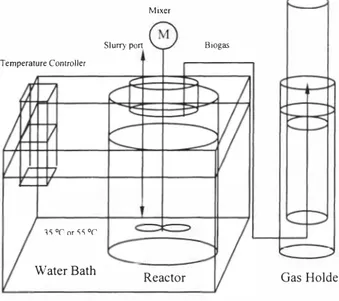
The continuous experiment was carried out in order to discuss the stability as it mixed each waste and dealt with. Schematic drawings of the continuous experiment are shown in the Figure 2. The sensitive volume of the fermenter was made to be 8L.
Mixer
Slurry port Biogas Temperature Controller
1'\ 0r nr "" 0('
Water Bath Reactor Gas Holder
Figure 2, Schematic drawings of continuous experiment.
The blending condition of a waste is shown at the Table 3. The blend ratio was decided by following procedures. First, the garbage collection quantity in the region is decided. Next, sludge quantity for the dilution necessary for this is decided. The manure in which the acceptance was finally possible was decided.
Table 3. The blending condition of continuous experiment ('/o/wt),
Biowaste Animal manure Sewage sludge Garbage
Case I 52 40
Case 2 0 80 20
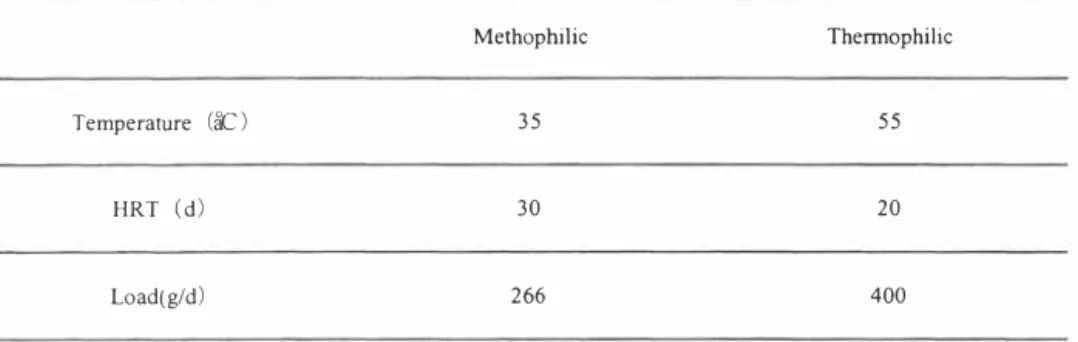
It made the operation of the fermenter under the condition of thermophlic fermentation and methophilic fermentation as well as the batch experiment. The operating condition of the fermenter is shown at the Table 4. A waste was put to a day one time fermenter.
KALMAR, SWEDEN, November 28-30, 2005
Table 4. Operating condition of the fermenter.
Methophilic Thermophilic Temperature (a° C) 35 55 20 HRT (d) 30 Load(g/d) 266 400 2.4 Analytical Methods
Various analytical method followed the official method.
3 RESULTS
3.1 Property of biowastes
Table 5. Results of analysis of biowaste.
Animal manure Sewage sludge Garbage
pH 7.6/18°C 6.2/18a° C 4.5/18°C TS % 2L8 L26 20.7 VTS %/TS 56.1 82.7 84.1
ss
% 19.0 1.12 19.4vss
%/SS 58.5 84.6 87.7 CODcr mg/kg 98,000 15,000 390,000Results of analysis of biowaste is shown at the Table 5. Though in the total solid, the animal
manure shows the high value, in COD, the high value is not shown. It is considered that there is sufficiently a function of the dilution, because originally solid matter concentration is low for the sludge. It is considered that in 3 kinds of inside, the garbage is high, and COD is the highest, and it contributes to the gas generation.
35 55
3,5 3.2 Biogas production ratio of each biowaste
Example in progress of biogas generation is shown in Figure 3, In thermophilic fermentation and methophilic fermentation, in all biogas generation, it was earlier of the thermopilic condition, and there was the biogas generation, Though in the final gas yield, the garbage became a difference between most large generation rate, in other waste, it is not greatly different(see Table 6), 18 '@ 16 2, 14
!
12 a5 10 � 8 � 68
4 <t 2 0 0 100 200 300 400 nrre (hr)1--
35•c -- ss·cl
Figure 3, Typical profile of biogas production from biowaste (Animal manure)
Table 6, Biagas production from biowaste
Type ofbiowaste Animal manure Sewage sludge Garbage
35 55 35 55
Temperature (' C)
200
Biagas production (Ukg) 13 16 3,5 130
3.3 Biogasification of mixed biowaste
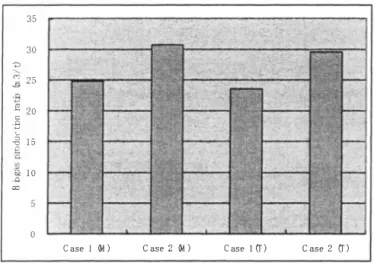
Bio gas generation of each case is shown in the Figure 4, It consists of the change of amount of gas in comparing methophilic condition with thermophilic condition with the result of being big of the effect of the blend ratio, Therefore, the difference between methophilic fermentation and effect by the thermophilic fermentation seems to be little, when the biogas yield is little,
KALMAR, SWEDEN, November 28-30, 2005 35 30 ,::, � 25 � 20 B
.g
e
1 5 ::'c 1 0 . Q c:, 0Figure 4. Biagas production ratio of each case,
The comparison of the methane concentration in the biogas is shown in the Figure 5,
C ase I I,! ) C ase 2 M ) C ase ! (r ) C ase 2 (r )
Figure 5, Methane concentration of each case,
4 MODELLING OF REGEIONAL OPTIMIZATION
We have examined a system including an intensive biogasification plant (IBGP) and a
C ase 1 � ) C ase 2 � ) C ase 1 (r ) C ase 2 (r )
1 00 90 80
""
·"
70 60 50 8"
40 30 "' 20 1 0 0(
···
�,
�
·
}-.:-1
....,,c::::::.J ...
��.:.·:::::.!...•·
Figure 6. Single system of wastewater treatment.
• •···•··•··· ...
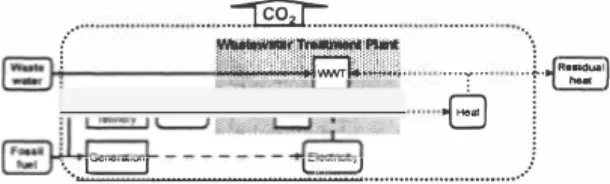
•·Figure 7. Combined system of wastewater treatment with intensive biogasification of
biowastes.
Heat and electricity are generated in IBGP and supplied to WWTP. Heat and electricity balances and CO2 emission from the system are estimated for different quantities ofbiowastes. The system is assumed to be introduced into Ashoro Town in Hokkaido, the northernmost part of Japan. The results show that the heat demand of the combined system in summer is smaller than in winter. The annual energy balance and CO2 emission were also estimated using the data per day. It was assumed that winter and summer seasons were of equal length. Annual heat and electricity balances for each case are shown in Figures 8 and 9, and annual CO2 emission is shown in FigureJO, -1.00() J.000 2))00
.:: I ·:::· · 111 �
-2,000-,= r---_,'.� __
_J -4,G(){I C 1m·O c� ... 1 Cu.wl C 1>�1'3KALMAR, SWEDEN, November 28-30, 2005
Figure 9, Annual electricity balances in each case,
,o ---�
0 u
C a1,,.,0 C as 11 l C ai.o,2 C ast1 3
C nsc
Figure JO_ Annual CO2 emissions in each case
The difference becomes more noticeable with increase in the quantity of treated biowastes, Consequently, IBGP could supply surplus electricity generated, The advantage was remarkable by direct heat recovery of biogas,
5 CONCLUSIONS
In this study, following conclusions were got
• On the biogas generation quantity, it is abounding in order of garbage, livestock manure, sludge,
• It was possible for the biogasification, when it dealt with 3 kinds of the biowaste even in by mixing, and the problem did not come out for the operation,
• It is possible in not only effective utilization by the fact with waste water treatment plant and biogasification plant it combines combine effective utilization of the sludge but also efficient use of electric power, heat And, the reduction of the carbon dioxide emission becomes also possible,
[2) Inaba, R,, Furuichi, T,, Komatsu, T,, Nishi, N,, 2005, Evaluation of regional sustainability for a biogasigfication system, In: The Proceedings of the 20th Conference on Solid Waste Technology and Management, Philadelphia,
[3) Inaba, R,, Furuichi, 2005, Intensive Biogasification of Wet Biowastes for Sustainable Material Cycle in Japan. ISWA,