Information Asymmetries among European Investors:
Evidence from Swedish IPOs
Martin Abrahamson, Adri De Ridder and Jonas Råsbrant*
April, 2011
Abstract
We study underpricing and equity holdings following initial public offerings (IPOs) in Sweden over the sample period 2000 through 2009. We document, as most prior studies of IPOs, that they on average are underpriced (i.e., associated with a positive initial return). IPOs with a low (high) initial return have higher (lower) equity holdings by retail investors. Our analysis of domicile of institutional investors indicates that foreign institutional investors have preferences for holdings in IPOs characterized by a high initial return and large capitalization values. Analysis of overseas institutional holdings indicates existence of information asymmetries related to distance.
* Abrahamson and De Ridder are associated with Gotland University, Visby, Sweden, and Råsbrant with the
-2- 1. Introduction
One of the best known anomalies of corporate finance is the fact that initial public offerings, IPOs, on average are associated with a positive short term abnormal return and that they underperform in the long run. In the empirical oriented literature related to IPOs, there is ample evidence that this is a clear departure from market efficiency and the fact that substantial sums of money have been left on the table has also rendered the anomaly to be included as one of the puzzles in finance as highlighted by Brealey, Myers and Allen (2010). Furthermore, as reported by Loughran, Ritter and Rydqvist (1994) and later updated on Ritter‟s web-page, the well-documented underpricing of IPOs seems to be valid, on several markets and also over long periods (e.g., Chambers and Dimsobn, 2009).
Despite the fact that IPOs have been analyzed from different angles, little is known about the link between underpricing, offer price and stock ownership in IPOs. In this paper we try to fill this void. We focus on Swedish IPOs and pay attention to the absolute price level of the offer price and whether there is a relationship between the level and stock ownership, i.e., do IPOs with low (high) offer price attract retail (institutional) investors. In a similar vein, we examine if there is a difference in the short-term performance of IPOs and stock ownership between institutional investors and retail investors. We extend this analysis to also include the domiciles of foreign institutional investors and conducting, to the best of our knowledge, the first study which explicitly examines institutional holdings by different domiciles.
Firms occasionally undertake actions by executing stock splits, stock dividends and reverse stock splits to drive the nominal stock price into an absolute preferred price level. If markets are efficient and frictionless, nominal stock prices are of no importance. However, announcements of stock splits, which should have no direct effect on a company‟s cash flows, are usually accompanied by a positive abnormal return (see recent studies by Byun and
-3-
Rozeff, 2003; Chern, Tandon, Yu and Webb, 2008). In addition, Schultz (2000) and Dhar, Goetzmann and Zhu (2003) provide evidence that stock splits also can change the stock ownership in firms as low absolute stock price levels attract retail investors.
One void in the literature related to IPOs is the relationship between the size of the underpricing and ownership. Fernando, Krishnamurti and Spindt (2004) examine the relationship between the offer price in an IPO and stock ownership and report a U-shaped relationship between offer price and underpricing and also document that low (high) priced IPOs underperform more (less) in the 3-year period following the IPO.
It is a generally accepted view that stock ownership reflects an investor‟s confidence in the firm. In this paper we expand the Fernando, Krishnamurti and Spindt (2004) study by introducing a new metric in the analysis of IPOs. We specifically use breadth of ownership, defined as the fraction of investors to all investors in the market holding the stock. Our detailed data clearly enable a close examination of this metric for domestic institutional investors, domestic individual investors plus foreign institutional and individual investors. Prior studies, (e.g., Badrinath and Wahal; 2002, Sias, Starks and Titman, 2006), also report that this measure increases investor confidence in firms. We investigate whether IPOs with a low (high) offer price will attract retail (institutional) investors and expect to find that IPOs associated with low (high) initial return should have higher (lower) holdings by retail (institutional) investors. In other words, we have reason to believe that institutional investors possess superior information (see, Cohen, Gompers and Vuolteenaho, 2002; and Gibson, Safieddine, and Sonti, 2004). Specifically, we also examine if this asymmetry varies between domestic and foreign institutional investors.
The results of this paper provide new evidence and insights to the existing literature related to IPOs. Consistent with prior studies we find that IPOs with a low offer price are associated with high initial returns. IPOs with low initial returns are also associated with
-4-
higher equity holdings by individual investors. We also shed some new light on information asymmetry between domestic and foreign investors and find that foreign institutional investors have higher holdings in firms with high initial returns. To the best of our knowledge, this is the first paper totest and examine this issue.
The remainder of the paper proceeds as follows: The next section describes sample, sources and methodology, Section 3 presents our results and analyses the relationship between stock ownership and specific features for firms conducting an IPO and Section 4 contains concluding remarks.
2. Data and methodology
2.1. IPOs in Sweden
We construct our sample of IPOs on the Stockholm Stock Exchange, SSE, with data from the economic research department at the NASDAQ-OMX. For firms listed on the Aktietorget market segment we obtain our sample from its web-page. We focus our analysis on IPOs launched on the official SSE and its market segment First North, and Aktietorget. The sample period covers IPOs launched between January 2000 and December 2010. Our full sample consists of 172 IPOs.
The offer price, total number of outstanding sharesand total number of shares sold have been hand-collected from the prospectuses of each IPO. Turnover and stock prices are from NASDAQ-OMX and Aktietorget.
2.2. Ownership data
In contrast to many other countries, there is by law only one bodywhich monitors stock ownership in all public firms in Sweden, the Central Security Registrar Euroclear Sweden. We obtain the ultimate ownership data for all firms, listed on the SSE and Aktietorget, from
bi--5-
annual data (as of the end of June and December) beginning in 1999. The data are extremely detailed as it enables examination of direct holdings, both by cash flows and voting rights, of both institutional and individual investors. For institutional investors, and specifically for domestic institutional investors, a further grouping into 7 groups is possible as each institutional investor carries a unique organisation number. For each individual investor we obtained a unique identification number enablingus to examine total stock holdings across all firms as well as age and sex. Data on holdings by foreign institutional investors are not as detailed as for domestic institutional investors as these holdings in general are assembled for a custodian and the nominee is not revealed. However, our data enable determination of which country the custodian is based. Also, in our work, we are particularly interested to examine holdings by bothdomestic and foreign institutional investors.
3. Empirical results
3.1. Sample characteristics
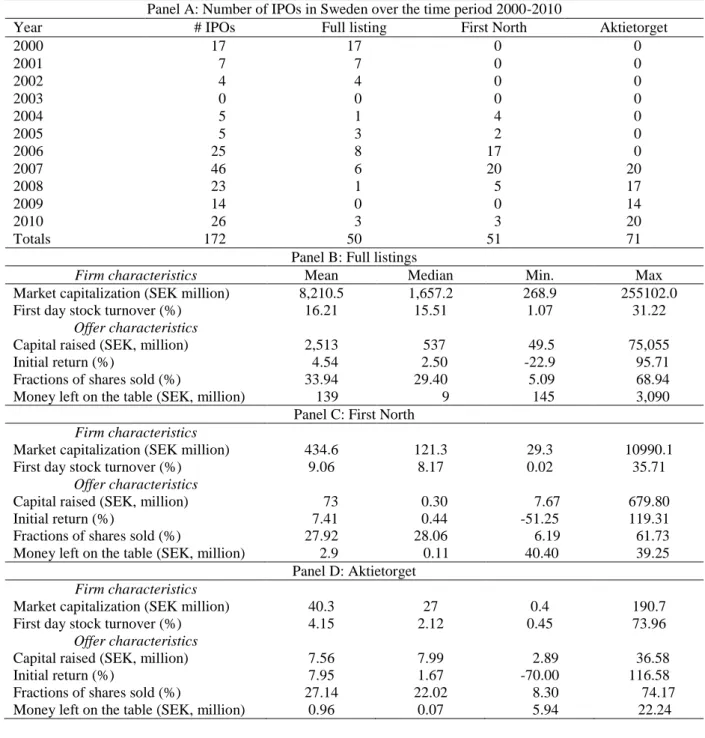
The sample characteristics are presented in Table 1. Panel A contains the frequency distribution of our sample firms with IPOs but also sorted by market segment where the listing occurred (Full listing, First North and Aktietorget). As reported, we have a total of 172 IPOs where 50 and 51 firms went public on the major market segments and 71 went public on the segment for smaller firms. As shown, most IPOs took place during year 2007 (26.7%). Panels B, C and D of Table 1 show firm characteristics for IPO firms with respect to the market segment. For full listings (Panel A), the mean size of the firms (expressed in 2009 Swedish kronor, SEK) is 8.2 billion SEK which is substantially larger than the mean size of firms for the other two market segments (Panels B and C). Stock trading during the first day, defined as total number of shares traded divided by number of shares sold in the offering and expressed as a percentage, is 16.21% for full listing and lower for the listings on the market
-6-
segments as reported in Panels C and D. The initial return, or the underpricing, defined as the return from the offer to the closing price for the first trading day, is 4.54% for full listings and higher for listings on the market segments (7.41% and 7.95% respectively). On average, 33.94% of total outstanding shares are sold in IPOs for firms targeting a full listing. The fractions sold for firms listed on the Aktietorget is lower, only 27.14% of total outstanding shares. As reported in prior literature, a substantial amount is left on the table due to the underpricing. Although the amount is small for firms as reported in Panel D it represents 12.7% of the capital raised, and 5.5% and 4% for firms as reported in Panels C and D respectively. In summary, our results presented above are consistent with the extensive literature related to IPOs.
3.2. Offer price and initial return
One of the primary objectives of our study is to examine the relationship between the size of the underpricing1 (initial return) and the offer price where we expect that an IPO with a low offer price is underpriced more than IPOs with a high offer price. Accordingly, we sort our samples based on the size of the offer price. As our sample also consists of IPOs on market segments, with a significant dispersion in firm characteristics, we continue our examination by controlling for the segments.
In Panel A of Table 2, we present the mean, median, minimum and maximum values of offer price and the initial returns for our full sample. Mean (median) offer price is 29.84 SEK (12.49 SEK) and indicates that the distribution is skewed. This skewness is caused by the low offer prices on the market segments as shown in Panels C and D with the mean offer price substantially lower than for full listings. In particular, IPOs on the Aktietorgetmarket segment have low offer prices with a median value of 4.00 SEK. For the full sample, we also see that
1
Underpricing is defined as the difference between the first days closing price (CP) less the offer price (OP) divided by the offer price for firm i on day t. Thus for firm i underpricing is given by:
t, i t, i t, i OP OP CP .
-7-
the initial return first declines as the offer price increases and then increases the mean initial return for our five price groups, sorted from inexpensive to expensive, is 8.06%, 3.27%, -2.15%, 2.12% and 18.45% respectively. This U-shape pattern is also documented in prior literature by Fernando, Krishnamurti and Spindt (2004).
3.3. Stock ownership in IPO firms
Table 3 provides descriptive evidence for our three variables related to equity holdings: number of investors holding the stock, ownership fraction and breadth of ownership. In accordance with our expectations, and given our sample period of several IPOs with small market capitalization values and hence a low offer price, domestic individual investors have a mean (median) holdings of 39.13% (44.14%) in IPOs. As expected, domestic institutional holding is also higher compared to foreign institutional holdings with mean values of 33.12% and 27.75% respectively. In Panel B we report stock ownership in IPO-firms after sorting them in three groups based on the initial return. Firms with low (or negative initial returns) are in the group defined as „Low (or negative) initial return‟, firms with modest initial return are in the second group, „Moderate initial return‟, and finally, firms with high initial return are in the group denoted as „High initial return‟.
Existence of information asymmetries should reflect a higher holding for more informed investors. Hence, we expect to find higher holdings in IPO firms associated with a high initial return by foreign institutional investors as they should be more sophisticated investors and can easily avoid investing in IPOs.
The mean (median) of stock ownership of the sample firms on the first record date is presented in Panel B of Table 3 for our three ownership groups. The numbers are consistent with the hypothesis that information asymmetries exist among investors participating in IPOs. Domestic and foreign institutional investors have higher holdings in IPO firms with high initial return. A paired t-test is used to determine if the mean difference of holdings in IPOs
-8-
with high and low initial return is zero. For domestic institutional investors the mean difference is statistically significant (p-value = 0.001) and indicates that they have higher holdings in IPO firms with high initial return. Similar results are obtained for foreign institutional investors where the difference is substantially larger and also statistically significant. For individual investors, mean holdings is 47.25% (27.02%) in IPO firms with low (high) initial return and the mean difference is also highly statistically significant (p-value <0.001).
Thus, two inferences can be drawn from Table 3. First, holding in IPO-firms with different initial return is different for domestic and foreign investors as confirmed by our univariate analysis. Second, our data clearly show that individual holdings are substantially lower in IPO firms with low initial return suggesting that they have difficulties to obtain IPOs with high initial returns.
3.4. Multivariate analysis
In this section, we use regression analysis to examine how stock ownership in IPO firms is related to firm and offer characteristics. In particular, we first regress fraction of shares held on offer price, market capitalization, fraction sold and the initial return. As the distribution of the initial return is highly positively skewed, mean (median) values are 6.35% (2.00%), we winsorize this variable at 5% and 95% of its distribution. In addition to our first variable reflecting stock ownership, we fully utilize our unique ownership data and use breadth of ownership as our second proxy for equity ownership. Furthermore, we estimate our models for three different investors: a) domestic institutional investors, b) foreign institutional investors and c) domestic individual investors.
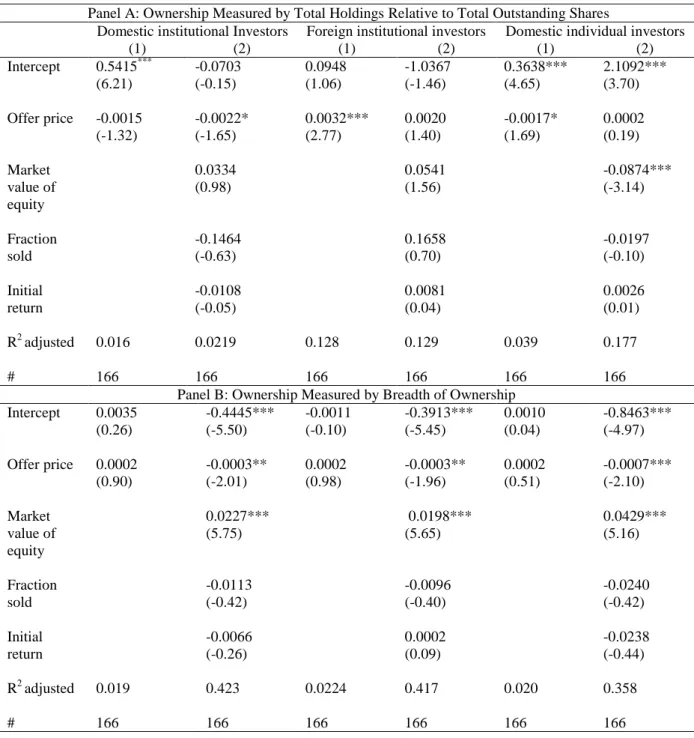
Our regression results are reported in Table 4. Panel A of Table 4 confirms that domestic institutional investors have preferences for low priced IPOs whereas the opposite holds for foreign institutional investors. Moreover, domestic individual investors seem to have
-9-
preferences for low priced IPOs. Furthermore, when we use the new metric breadth of ownership as the dependent variable, our data are consistent with the results presented in Panel A. The estimated coefficient on market capitalization value is positive and also statistically significant for all three investor types and suggests that more investors have holdings in firms with larger market capitalization values. Interestingly, our data do not report any statistically significant relationship between holdings and initial return.
In summary, our results suggest that domestic and foreign institutional investors have different preferences for IPOs with a low and a high offer price. Domestic institutional investors have preferences for IPOs with a low offer price whereas the opposite holds for foreign institutional investors. Holdings by domestic individual investors are also negatively correlated to offer price suggesting preferences for low priced IPOs. For foreign institutional investors the estimated coefficient on offer price in model (1) in Panel A is positive (0.0032;
t-statistic = 2.77) and statistically significant, indicating that a higher offer price is followed
by higher holdings by foreign institutional investors. For domestic institutional investors, the estimated coefficient is negative (-0.0022; t-statistc = -1.65), and hence a higher offer price is followed by a lower equity ownership. Our regression analysis also confirms our expectation that institutional investor holdings in general are positively related to firm size.
Table 5 presents estimated results where we regress the initial return on offer and firm characteristics. As reported, the estimated coefficients in model (2, 3 and 4) on offer price are negative and statistically significant indicating that IPOs with high offer prices are associated with lower initial return. Our second control variable, offer price squared, is however positive and also statistically significant. Taken together, this confirms that the relationship between underpricing and the offer price and initial return support the U-shaped relationship and is confirmative to Fernando, Krishnamurti and Spindt (2004) but also to our univariate analysis.
-10- 4. Concluding remarks
We analyze stock ownership for a sample of IPOs in Sweden over the eleven-year period 2000 to 2010. By exploiting a unique data set, with information of the ultimate holdings by institutional as well as individual investors in these firms, we make several original contributions to the existing literature related to IPOs as our data are sharper and more detailed than whathave been used in prior studies.
We find that institutional investors are better than individual investors to identify firms with a high initial return, and hence, our data support the generally accepted view that institutional investors are better equipped to process information. We also confirm that the relationship between underpricing (the initial return) and offer price is U-shaped, as first reported by Fernando, Krishnamurty and Spindt (2004). Our multivariate analysis shows that individual investors have preferences for low priced IPOs whereas domestic (foreign) institutional investors have preferences for low (high) priced IPOs.
-11-
Table 1 Description of Sample and Firm Characteristics
This table presents summary statistics for our sample of 109 IPOs of common stock in Sweden over the period 2000 through 2010. In Panel A we report total number of IPOs and grouped into which market segment the IPO was launched (Full listings, First North and Aktietorget). Market capitalization is total number of outstanding shares multiplied with offer price. First day stock turnover is total number of shares traded on the first day divided by total number of outstanding shares. First week stock turnover is the average of the first five daily stock turnovers. First month turnover is the average of the first 21 trading days stock turnover. Capital raised is the total number of shares offered multiplied with offer price. Initial return is the difference of closing price minus the offer price divided by the offer price on the first trading day. Fraction of shares sold is total number of shares sold divided by total number of outstanding shares. Money left on the table is the difference between the closing price on the first trading day and the offer price multiplied by total number of share offered.
Panel A: Number of IPOs in Sweden over the time period 2000-2010
Year # IPOs Full listing First North Aktietorget
2000 17 17 0 0 2001 7 7 0 0 2002 4 4 0 0 2003 0 0 0 0 2004 5 1 4 0 2005 5 3 2 0 2006 25 8 17 0 2007 46 6 20 20 2008 23 1 5 17 2009 14 0 0 14 2010 26 3 3 20 Totals 172 50 51 71
Panel B: Full listings
Firm characteristics Mean Median Min. Max
Market capitalization (SEK million) 8,210.5 1,657.2 268.9 255102.0
First day stock turnover (%) 16.21 15.51 1.07 31.22
Offer characteristics
Capital raised (SEK, million) 2,513 537 49.5 75,055
Initial return (%) 4.54 2.50 -22.9 95.71
Fractions of shares sold (%) 33.94 29.40 5.09 68.94
Money left on the table (SEK, million) 139 9 145 3,090 Panel C: First North
Firm characteristics
Market capitalization (SEK million) 434.6 121.3 29.3 10990.1
First day stock turnover (%) 9.06 8.17 0.02 35.71
Offer characteristics
Capital raised (SEK, million) 73 0.30 7.67 679.80
Initial return (%) 7.41 0.44 -51.25 119.31
Fractions of shares sold (%) 27.92 28.06 6.19 61.73
Money left on the table (SEK, million) 2.9 0.11 40.40 39.25 Panel D: Aktietorget
Firm characteristics
Market capitalization (SEK million) 40.3 27 0.4 190.7
First day stock turnover (%) 4.15 2.12 0.45 73.96
Offer characteristics
Capital raised (SEK, million) 7.56 7.99 2.89 36.58
Initial return (%) 7.95 1.67 -70.00 116.58
Fractions of shares sold (%) 27.14 22.02 8.30 74.17
-12- Table 2 Offer Price and Initial Return
This table shows the relationship between offer price and initial return (the difference between the closing price and the offer price divided by the offer price on the first trading day) across our sample firms. Data have been sorted into five equally weighted portfolios based on the offer price. In Panel A we report findings for the full sample of IPOs. Panel B, C and D shows results for Full listings, First North, and Aktietorget respectively. Note that the break points is different for Aktietorget
Offer price, SEK Initial return, %
Price range (SEK) Mean Median Min. Max. Mean Median Min. Max n
Panel A: Full Sample
OP < 25 6.39 5.38 0.06 22.50 8.06 1.67 -70.00 119.31 102 25 ≤ OP < 50 34.62 34.00 25.00 47.50 3.17 0.88 -22.89 38.75 25 50 ≤ OP < 75 59.61 60.00 40.00 74.00 -2.15 -1.35 -21.54 18.75 23 75 ≤ OP < 100 84.38 85.00 75.00 93.19 2.12 4.12 -8.97 10.00 11 100 ≤ OP 115.05 110.00 100.00 161.00 18.45 7.39 -1.84 95.71 11 All 29.84 12.49 0.06 161.00 6.35 2.00 -70.00 119.31 172
Panel B: Full listing
OP < 25 13.25 13.25 6.50 20.00 2.69 2.69 -10.00 15.38 2 25 ≤ OP < 50 36.04 36.00 25.00 47.50 0.11 1.32 -22.90 17.24 12 50 ≤ OP < 75 59.69 60.50 50.00 74.00 -0.43 -0.36 -16.10 18.75 16 75 ≤ OP < 100 83.50 84.50 75.00 91.00 1.82 2.06 -8.97 10.00 10 100 ≤ OP 115.70 110.00 100.00 161.00 20.48 9.45 1.50 95.71 10 All 68.12 62.50 6.50 161.00 4.54 2.50 -22.90 95.71 50
Panel C: First North
OP < 25 10.14 9.20 0.50 22.50 10.43 2.66 -51.25 119.31 32 25 ≤ OP < 50 34.10 35.00 25.00 45.00 4.15 2.60 -22.33 38.75 10 50 ≤ OP < 75 59.43 58.00 50.00 68.00 -2.78 -2.68 -21.54 14.00 7 75 ≤ OP < 100 n/a n/a n/a n/a 5.16 5.16 5.16 5.16 1
100 ≤ OP n/a n/a n/a n/a -1.84 -1.84 -1.84 -1.85 1
All 25.16 16.00 0.50 68.00 5.44 0.44 -51.25 119.31 51 Panel D: Aktietorget OP < 1.00 0.54 0.60 0.06 0.95 9.19 -2.00 55.56 -21.33 12 1.00 ≤ OP < 2.00 1.45 1.50 1.00 1.80 15.07 11.11 56.25 -16.67 11 2.00 ≤ OP < 3.00 2.13 2.00 2.00 2.40 26.17 10.00 -36.17 116.50 9 3.00 ≤ OP < 4.00 3.35 3.35 3.00 3.70 10.26 -18.67 39.19 2 4.00 ≤ OP 9.31 6.75 4.00 42.00 0.87 -70.00 69.37 37 All 5.53 4.00 0.06 42.00 7.95 1.67 -70.00 116.50 71
-13- Table 3 Stock Ownership in IPOs
This table reports different measures of institutional and individual ownership as of the end of the closest quarter following the flotation for Swedish IPO-firms. Data are obtained from the Central Security Registrar in Sweden, Euroclear Sweden. In Panel A we report holdings grouped by total domestic institutional investors, total foreign institutional investors and total domestic individual investors. Number of investors holding the stocks are just the number of institutions or individuals holding the stock. Ownership fraction is holdings divided by total outstanding shares for each ownership group respectively. Breadth of ownership is the ratio of number of investors holding a stock to the total number of investors and expressed as a percentage. In Panel B we report the same variables as in Panel A but sorted into three groups based on the size of the initial return. The last two columns in Panel B report test statistics for differences in means (paired t-test) and medians (Wilcoxon-test) in ownership between IPO firms with high and low initial return. p-values are reported in brackets.
Panel A: Institutional and individual holdings in IPO firms
Domestic institutional investors Foreign institutional investors Domestic individual investors
Mean Median Mean Median Mean Median
Number of investors holding the stock 525 448 175 113 4,228 3,573 Ownership fraction 0.3312 0.2438 0.2775 0.1435 0.3913 0.4414 Breadth of ownership 0.0022 0.0017 0.0003 0.0002 0.0055 0.0028
Panel B: Institutional and Individual stock ownership in IPO firms partitioned by size of the initial return
Low (or negative) initial return (L) Moderate initial return High initial return (H) Test of difference H-L Mean Median Mean Median Mean Median t-statistic
[p-value] W-stat [p-value] Domestic institutional investors 0.2834 0.2279 0.4117 0.3172 0.3133 0.2563 2.78 [0.001] 8.88 [0.000] Foreign institutional investors 0.2441 0.1193 0.1374 0.0900 0.4165 0.3100 3.99 [0.001] 10.25 [<0.001] Domestic individual investors 0.4725 0.5624 0.4509 0.4846 0.2702 0.3345 -6.55 [<0.001] -5.45 [<0.001]
-14-
Table 4 Regression Results on Stock Ownership for IPOs
This table reports OLS-regression results of stock ownership on firm and offer characteristics for our sample of 172 IPOs in Sweden over the sample period 2000-2010. In Panel A we use total number of shares held divided by total outstanding shares in each firm and for each group of investors as the dependent variable. In Panel B we use breadth of ownership, the number of investors in each group which hold the stock relative to all investors and for each group respectively. All ownership data have been obtained from the Central Security Registrar in Sweden, Euroclear Sweden. Offer price is the final offer price in the IPO, market value of equity is total number of outstanding shares multiplied by the offer price (expressed in natural log), fractions sold is the number of shares sold in the offering divided by total outstanding shares in the IPO, and initial return is the closing price minus the offer price divided by the closing price on the first trading date. t-statistics are in parentheses. ***, **, and * denote statistical significance at the 1%, 5% and 10% levels, respectively.
Panel A: Ownership Measured by Total Holdings Relative to Total Outstanding Shares
Domestic institutional Investors Foreign institutional investors Domestic individual investors
(1) (2) (1) (2) (1) (2) Intercept 0.5415*** (6.21) -0.0703 (-0.15) 0.0948 (1.06) -1.0367 (-1.46) 0.3638*** (4.65) 2.1092*** (3.70) Offer price -0.0015 (-1.32) -0.0022* (-1.65) 0.0032*** (2.77) 0.0020 (1.40) -0.0017* (1.69) 0.0002 (0.19) Market value of equity 0.0334 (0.98) 0.0541 (1.56) -0.0874*** (-3.14) Fraction sold -0.1464 (-0.63) 0.1658 (0.70) -0.0197 (-0.10) Initial return -0.0108 (-0.05) 0.0081 (0.04) 0.0026 (0.01) R2 adjusted 0.016 0.0219 0.128 0.129 0.039 0.177 # 166 166 166 166 166 166
Panel B: Ownership Measured by Breadth of Ownership Intercept 0.0035 (0.26) -0.4445*** (-5.50) -0.0011 (-0.10) -0.3913*** (-5.45) 0.0010 (0.04) -0.8463*** (-4.97) Offer price 0.0002 (0.90) -0.0003** (-2.01) 0.0002 (0.98) -0.0003** (-1.96) 0.0002 (0.51) -0.0007*** (-2.10) Market value of equity 0.0227*** (5.75) 0.0198*** (5.65) 0.0429*** (5.16) Fraction sold -0.0113 (-0.42) -0.0096 (-0.40) -0.0240 (-0.42) Initial return -0.0066 (-0.26) 0.0002 (0.09) -0.0238 (-0.44) R2 adjusted 0.019 0.423 0.0224 0.417 0.020 0.358 # 166 166 166 166 166 166
-15-
Table 5 Regression Results on Initial Return for IPOs
This table reports OLS-regression results of the initial return, defined as the closing price minus the offer price divided by the closing price on the first trading date, on firm and offer characteristics for our sample of 172 IPOs in Sweden over the sample period 2000-2010. Offer price is the final offer price in the IPO, we also use the square of the offer price as a control variable (offer price)2 , market value of equity is total number of outstanding shares multiplied by the offer price (expressed in natural log), fractions sold is the number of shares sold in the offering divided by total outstanding shares in the IPO. t-statistics are in parentheses. ***, **, and * denote statistical significance at the 1%, 5% and 10% levels, respectively.
(1) (2) (3) (4) Intercept -0.0878 (-1.40) 0.1836* (1.90) 0.1913 (1.72) -0.1441 (-0.32) Offer price 0.0019** (2.36) -0.0066** (-2.56) -0.0066** (-2.53) -0.0070** (-2.63) (Offer price)2 0.0001*** (3.44) 0.0002*** (3.40) 0.0001*** (3.41) Market value of equity -0.0211 (1.25) -0.0095 (-0.06) Fraction sold 0.0168 (0.77) R2 adjusted 0.0963 0.282 0.264 0.257 # 166 166 166 166
-16- References
Adams, M., B. Thornton and R. Baker, 2009. Asymmetric Price Adjustment: Are IPO Prices too “Sticky”?, Journal of Business & Economics Researach, 7 (5), 55-61.
Badrinath, S., S. Wahal, 2002. Momentum trading by institutions. Journal of Finance 57, 2449-2478.
Bradley, D., J. Cooney, Jr., S. Dolvin and B. Jordan, 2006. Penny Stock IPOs. Financial Management (Spring), 5-29.
Chambers, D. and E. Dimson, 2009. IPO underpricing over the very long run. Journal of Finance 64 (3), 1407-1443.
Cohen, R., P. Gompers and T. Vuolteenaho, 2002. Who underreacts to cahs-flow news? Evidence from trading between individuals and institutins. Journal of Financial Economics 66, 409-462.
Fernando, C., S. Krishnamurthy and P. Spindt, 1999. Offer Price, Target Ownership Structure and IPO Performance. Unpublished working paper, The Warthon School, University of Pennsylvania.
Fernando, C., S. Krishnamurti and P. Spindt, 2007. Are share price levels informative? Evidence from the ownership, pricing, turnover and performance of IPO firms, Journal of Financial Markets 7, 377-403.
Gibson, S., A. Safieddine, and R. Sonti, 2004. Smart investments by smart money: Evidence from seasoned equity offerings. Journal of Financial Economics 72, 581-604.
Jenkinson, T., and H. Jones, 2010, IPO pricing and allocation: a survey of the views of institutional investors. Electronic copy available at: http://ssrn.com/abstract=891396.
Kang, H-c, D-W Lee, and K-S Park, 2010. Does the difference in valuation between domestic and foreign investors help explain their distinct holdings of domestic stocks? Journal of Banking & Finace 34, 2886-2896. Liu, X. and J. Ritter, 2010. Economic consequences of IPO spinning. Review of Financial Studies 23 (5), 2024-2059.
Loughran, T., J. Ritter and K. Rydqvist, 1994. Initial public offerings: International insights. Pacific-Basin Finance Journla 2, 165-199.
Meoli, M., S. Paleari and S. Vismara, 2008, Does Ownership Structure Affect IPO Valuation? Electronic copy available at: http://ssrn.com/abstract=1102227.
Sias, R., L. Starks and S. Titman, 2006. Changes in institutional ownership and stock returns; Assessment and methodology. Journal of Business 79, 2869-2910.
Vong, A., and D. Trigueiros, 2010. The short-run price performance of initial public offerings in Hong Kong: New evidence, Global Finance Journal, 21, 253-261.