MASTER'S THESIS
The Potential of Woody Biomass in
Sweden
A Meta-Analysis
Jerker Abrahamsson
Jonathan Enbom
2016
Master of Science in Business and Economics (Civilekonom) Business and Economics
Luleå University of Technology
The potential of woody biomass in
Sweden
A meta-analysis
Jerker Abrahamsson & Jonathan Enbom
Luleå University of Technology
Economics
SE 971 87 Luleå, Sweden
ABSTRACT
The objective with the thesis was to make a comprehensive review of scientific articles and other studies on the potential of woody biomass in Sweden. Furthermore, the impact different approaches, restrictions and type of study have had on the reported outcome from the different studies have been examined. The method is based on a meta-analysis using ordinary least square (OLS) regression estimations. The theoretical framework is based on optimal harvesting rates of renewable resources and a supply and demand model of woody biomass, identifying the factors that affect the supplied amount of woody biomass. The results imply that the choice of restrictions (economical, technical, ecological and theoretical), as expected, had a large impact on the estimated potential of woody biomass. However, the result for using economical restrictions suggests an increased potential, which was unexpected. Conclusively, the thesis suggests that there is further potential to increase the utilization of woody biomass in Sweden.
Keywords: Meta-analysis, woody biomass, potential, factors affecting the supplied amount of woody biomass, Swedish forests
SAMMANFATTNING
Syftet med denna studie var att göra en metaanalys av vetenskapliga artiklar och andra studier som bedömer potentialen för skoglig biomassa i Sverige. Vidare estimeras hur stor påverkan valda metoder, begränsningar och typ av studie har haft på resultaten i de olika studierna. Metoden baseras på en metaanalys där minsta kvadratmetoden tillämpas för att estimera den statistiska signifikansen och påverkan av de olika identifierande determinanterna. Den teoretiska utgångspunkten är baserad på teorin om optimalt uttag av förnybara resurser samt på en utbuds - och efterfrågemodell där de faktorer som påverkar utbudet, och därmed potentialen, av skoglig biomassa diskuteras. Resultatet visar att valet av begränsningar (ekonomiska, tekniska, ekologiska och teoretiska) har haft en stor inverkan på potential bedömningarna. Resultatet visar att den ekonomiska begränsningen har en positiv påverkan på potentialen, vilket var motsatsen till vad som förväntades. Slutligen, framgår det av studien att det finns en möjlighet att öka användningen av biomassa från skogen i Sverige.
Nyckelord: Meta-analys, skoglig biomassa, potential, faktorer som påverkar utbudet av skoglig biomassa, svenska skogar
ACKNOWLEDGEMENT
First of all we would like to thank our supervisor Robert Lundmark for his outstanding help with his great advises and guidance during this project. We also want to thank all of the other people that have helped us in one way or another to finish this project.
TABLE OF CONTENTS
CHAPTER 1 INTRODUCTION ... 1
1.1 BACKGROUND ... 1
1.2 PURPOSE AND RESEARCH QUESTION ... 3
1.3 METHODOLOGY ... 3
1.4 SCOPE AND LIMITATIONS ... 3
1.5 OUTLINE ... 4
CHAPTER 2 BIOENERGY ... 5
2.1 SWEDISH FORESTS ... 5
2.2 WHAT IS BIOENERGY? ... 6
2.3 WOODY BIOMASS ... 6
2.4 BIOENERGY UTILIZATION IN SWEDEN ... 6
CHAPTER 3 THEORETICAL FRAMEWORK ... 9
3.1 OPTIMAL HARVESTING RATE ... 9
3.2 SUPPLY AND DEMAND ... 10
3.2.1 Main product ... 11
3.2.2 By-product ... 11
3.2.3 Supply and demand theory ... 11
3.2.4 Competitiveness of woody biomass ... 13
CHAPTER 4 META-ANALYSIS ... 15
4.1 META-ANALYSIS ... 15
4.2 THE DEPENDENT VARIABLE ... 16
4.2.1 Biomass types ... 16 4.3 INDEPENDENT VARIABLES... 17 4.3.1 Time period ... 17 4.3.2 Type of study ... 17 4.3.3 Author(s) specialization ... 17 4.3.4 Restrictions ... 17
4.3.5 Methods & approach ... 18
CHAPTER 5 LITERATURE REVIEW ... 19
5.1 RESEARCH STRATEGY ... 19
5.2 CONVERSION RATIOS ... 20
5.4 BIOMASS TYPE ... 21
5.5 APPROACHES AND METHODS ... 22
5.5.1 Resource-focused approach ... 22
5.5.2 Integrated assessment approach ... 22
5.5.3 Cost-supply analysis ... 23
5.5.4 Energy-system models ... 23
5.5.5 Spatially explicit analysis ... 23
5.5.6 Statistical analysis ... 24 5.5.7 Demand-driven approach ... 24 5.6 TIME PERIOD ... 24 5.7 RESTRICTIONS ... 25 5.7.1 Theoretical conditions ... 25 5.7.2 Technical limitations ... 25 5.7.3 Economic conditions ... 26
5.7.4 Ecological, environmental and cultural restrictions ... 26
5.8 SCIENTIFIC PAPER ... 27
5.9 AUTHOR(S) SPECIALIZATION ... 27
CHAPTER 6 ECONOMETRIC SPECIFICATION AND DATA ISSUES ... 28
6.1 ECONOMETRIC SPECIFICATION ... 28
6.1.2 Heteroscedasticity ... 29
6.1.3 Multicollinearity ... 29
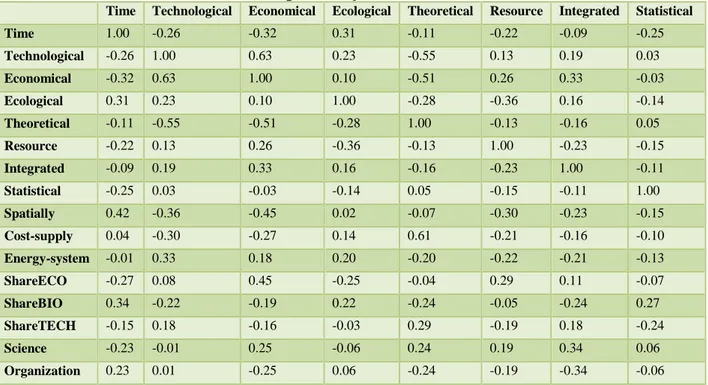
6.2 DESCRIPTIVE STATISTICS ... 30
CHAPTER 7 RESULTS & ANALYSIS ... 32
7.1 POTENTIAL OF WOODY BIOMASS ... 32
7.1.1 Total potential ... 32 7.1.2 Roundwood potential ... 34 CHAPTER 8 CONCLUSIONS ... 37 REFERENCES ... 39 APPENDIX ... 1 APPENDIX A ... 1 APPENDIX B ... 2
LIST OF FIGURES
Figure 1: Optimal harvesting rates of renewable resources p. 10
Figure 2: Supply and demand p. 12
LIST OF TABLES
Table 1: Energy utilization in Sweden p. 7
Table 2: Biomass utilization in Sweden by the year of 2013 p. 8
Table 3: Overview of studies included in the meta-analysis p. 20
Table 4: Correlation matrix of the explanatory variables p. 30
Table 5: Descriptive statistics p. 31
Table 6: Results for determinants of the woody biomass potential in Sweden p. 33
1
CHAPTER 1 INTRODUCTION
1.1 Background
Everybody is probably aware of the ongoing climate changes which may have devastating consequences. A suggestion that have been raised by the Intergovernmental panel on climate change is that global warming can be manageable if it stays at an increase of two degrees Celsius. Many species (including humans) ability to survive would be affected if global warming continues, for example; the ices of arctic and glaciers can melt which increases the level of the sea and global warming can cause more extreme weather with more natural disasters. With warmer climate harvesting of crops such as wheat and corn can be affected in several areas (IPCC, 2014).
When using fossil fuel, carbon dioxide and pollutions (e.g. Sulphur dioxide and methane gas) is released into the atmosphere which increases the greenhouse gas effect (SMHI, 2005). Carbon dioxide is needed for the environmental natural cycle but the vegetation and thereby the photosynthesis cannot take care of these increased emissions. WWF (2015) states that fossil fuels stand for approximately 80 percent of the world’s total energy production. However, approximately 75 percent of the excess emissions of carbon dioxide that damage the atmosphere come from fossil fuels (WWF, 2015). This is the reason why there are constant debates regarding how to mitigate the CO2 emission and its effect on the climate.
Renewable energy is extracted from natural sources such as wind power, solar energy, hydropower and bioenergy. In year 2013 renewable energy sources accounted for 19.1 percent of the world’s total primary energy consumption. The importance of developing renewable energy technologies is only vital in the aspect of environmental issues. Today there are billions of people that live without modern energy services, thus it is important to be able to provide clean energy for those people. This implies that we need to increase the total energy consumption without increasing the greenhouse gas emissions (REN 21, 2015).
2
The mayor problem that we need to overcome is the cost-efficiency of renewable sources. Even though the cost for renewable energy continued to decline in the year 2014, the choice of fossil fuel is still favored especially within the developing countries (REN 21, 2015).
The Swedish government (Prop. 2008/2009:163) set an environmental goal that the total energy usage shall consist of 50 percent renewable energy by the year of 2020. However, in the year of 2013 the Swedish use of renewable energy was 52 percent of the total energy usage (Swedish Energy Agency, 2015). Furthermore at the United Nations climate conference in Cancun 2010 they agreed to come up with strategies to reduce the total pollution by 80 percent from the year 2011 (Swedish Environmental Protection Agency, 2012) until the year 2050 also at the United Nations climate conference in Paris 2015 they agreed to limit the global warming to 1.5 degrees Celsius until the year 2050 (European Commission, 2016). The Swedish Environmental Protection Agency (2012) was given the task from the Swedish government to construct a layout for Sweden to be totally free from emission of greenhouse gases by 2050. To reach that goal it is clear that renewable energy sources must be more developed and more efficient to be able to replace for example fossil fuel that according to Swedish Energy Agency (2015) today stands for 30 percent of total energy production in Sweden.
Sweden has a large proportion of forest land, thus making woody biomass a likely source of more extensive utilized bioenergy. According to the Swedish Forest Agency biomass accounted for 23 percent of the total energy usage in Sweden in 2012 (Swedish Forest Agency, 2015). Biomass can be used as a renewable energy resource and is mainly extracted from wood (e.g. round wood, harvesting residues and stumps) in Sweden. Furthermore, biomass can also be derived from the agriculture in the form of residues from farming, crops or energy plants that is grown specifically in the purpose for biofuel.
Substituting fossil fuels for biofuels derived from agriculture and forests can decrease the carbon dioxide emissions since they release less greenhouse gases compared to the equivalent amount of fossil fuels (WWF, 2015). But more importantly, the carbon dioxide that is released when biomass is burned is neutralized by the photosynthesis, which implies zero net emission in the long-run, given a maintained level of biomass production (McKendry, 2002). Biomass could be a reliable and sustainable resource, which will also have positive social – and environmental impacts as it can provide sustainable livelihoods all over the world (WWF, 2015). Despite its advantages, bioenergy is still more expensive to produce than using fossil
3
fuel. Furthermore, biomass cannot efficiently be stored in large quantities in the long-term. This implies that technical and economic development is needed for biomass to be more competitive (Huang et.al., 2012).
There have been made a lot of studies lately that examines the Swedish potential to increase the yield of different assortments of forest biomass (e.g. Wetterlund et.al. 2013, Petterson et.al. 2015 and Eriksson et.al. 2004). Furthermore, the demand for forest and forest products has increased significantly (Olsson & Lundmark, 2014). However, the identification of the potential has been significantly different between the studies. It is here this meta-analysis comes in to fill in some blanks.
1.2 Purpose and research question
What is the potential of forest bioenergy products in Sweden given certain restrictions?
The purpose of this study is to make a better realization of the potential of woody biomass in Sweden by producing a review of previous scientific papers or organizational studies within the same field by conducting a meta-analysis.
1.3 Methodology
The theoretical framework for this study involves the optimal harvesting rate for a renewable resource and a general approach for the supply and demand. To be able to complete this study a meta-analysis is being used. A meta-analysis is a statistical technique that compiles the results from already published scientific papers with related research hypothesis; in this case it is regarding the potential of woody biomass in Sweden. Furthermore a meta-regression model with ordinary least square (OLS) estimations is used to examine the explanatory variables impact on the estimated potential of woody biomass in Sweden.
1.4 Scope and limitations
The biomass can be derived from agricultural sector, forestry and waste flows. We will categorize the biomass products as either a main or by product.
● Woody biomass includes all types of biomass that are directly or indirectly received from wood. Which includes roundwood (main product) as well as harvesting residues and stumps (by-products) from the forest sector but also products from the pulp and paper industry (black liquor) and from sawmills (chips and sawdust).
● Agricultural biomass includes all types of biomass received from the agricultural sector. For example, food and feed, residues and energy plants.
4
● Waste biomass includes primary residues (e.g. road side verges) as well as tertiary residues (e.g. municipal solid waste and vegetable waste) but also other waste (e.g. sludge and dredging spoils).
In this thesis the main focus lies on the potential of woody biomass in Sweden. The biomass from waste flows and agricultural will not be included in this study. The reason why agricultural biomass is not included is because the conditions for farming in Sweden are limited due to the cold climate. Moreover, as Ericsson & Nilsson (2006) states, Sweden only consist of 8 percent agricultural land.
1.5 Outline
This study contains of eight different chapters. In chapter 2 bioenergy as a resource is presented and woody biomass and its utilization in Sweden is described. Chapter 3 will present the theoretical framework for this study. In chapter 4 the meta-analysis will be described. Furthermore, the variables and quantification of the variables will be presented in this chapter. In chapter 5 there will be a literature review of previous studies regarding the estimated potential of woody biomass. In this review we will present the different restrictions and methods that have been used to estimate the different potentials of the woody biomass. In chapter 6 the econometric specification and related issues will be presented. In chapter 7 the regression results will be presented and interpreted. In chapter 8 conclusions and discussion of the result from this paper will be made. Furthermore, this chapter will involve suggestions for further resource.
5
CHAPTER 2 BIOENERGY
The objective with this chapter is to present an overview of what bioenergy is and how it is utilized today in Sweden. This chapter also describes how the production of woody biomass has been developed over time and how environmental policies (e.g. taxations and subsidies) have affected the energy market.
2.1 Swedish forests
Sweden consists of 40.7 million hectares of land and out of the total land area the productive forestland covers 23.2 million hectares. This implies that approximately 60 percent of Sweden is covered with forest. The total standing volume of forest has increased by over 80 percent since 1920. In year 2014 the total standing volume of productive forest was 3 billion cubic meters (m3) (land within national parks and nature reserves are excluded). Out of 3 billion m3; 39 percent consists of Scots pine, 42 percent is Norway spruce and 12 percent is birch (Swedish Forest Agency, 2014).
In year 2012, the ownership of productive forestland was dominated by individual owners that stood for a total of 50 percent. The rest of the distribution was 25 percent private sector (companies and corporations), 14 percent state owned companies, 6 percent other private owners, 3 percent state and 2 percent other public owners (Swedish Forest Agency, 2014). The largest forest area is in the northern parts of Sweden with approximately 6.7 million hectares of forest. However, the annual increment is higher in the southern parts of Sweden with a total of 31 million m3sk (standing volume of forest) per year (2009-2013). The total annual increment is approximately 100 million m3sk and the annual gross felling have been varying between 50 to 80 million m3sk over the last few decades (Swedish Forest Agency, 2014).
6
2.2 What is bioenergy?
Bioenergy is a type of renewable energy that comes from biomass products which is materials from trees, plants and waste materials (e.g from food, woodchips from sawmills and manure waste). The bioenergy can be converted into different types of energy such as biopower, bioheat, combined heat and power (CHP), biofuels and bioproducts.
Biopower is biomass used to produce electricity and it can be used alone or together with other fuels that usually is coal. Bioheat refers to the biomass that is used to produce heat. CHP is heat and power combined to produce energy for heating or cooling purposes by using biomass. Biofuels is fuel derived from biomass that often is used in the transportation sector and examples of biofuel is ethanol, biodiesel and renewable diesel. Bioproducts refers to the usage of biomass that produces commercial or industrial products such as soy ink, cellophane and food utensils (U.S EPA, 2009).
2.3 Woody biomass
Woody biomass comes from harvesting forests and can be divided into main product, which are stemwood and by-products from harvesting (stumps, tops, and branches) and industrial by-products (e.g. black liquor and chips). The biomass market is dominated by the woody biomass. In 2013 the energy produced in Sweden from biomass was 128 TWh (terawatt hour) and the biomass derived from forest accounted for approximately 80-85 percent of those 128 TWh (Swedish Energy Agency, 2015).
2.4 Bioenergy utilization in Sweden
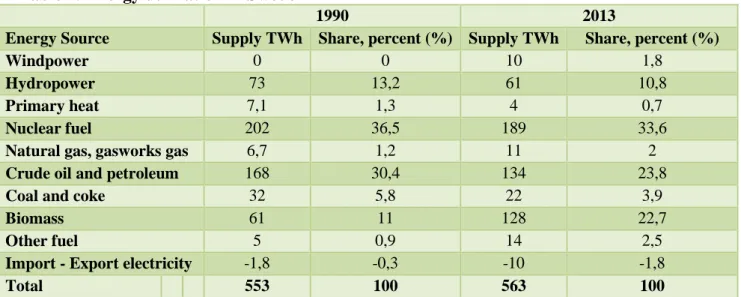
In Sweden the total energy supply have increased from 420 to a total of 565 TWh between 1990 and 2013, which is an increase by 35 percent. In Table 1 the energy utilization in Sweden is presented for the year 1990 and 2013. The biomass has increased from approximately 61 TWh to 128 TWh during the same time period, which is an increase with 114.7 percent. The biomass used for energy is mostly wood fuel and black liquor. Table 2 shows the utilization of the different types of biomass by the year of 2013. The sectors that are included can be divided into residential and service industry, industry sector, the transportation sector, electricity and district heating (Swedish Energy Agency, 2015).
7
From Table 1 it is possible to observe that the energy utilization in Sweden has increased slightly. However, the usage of biomass has increased significantly while the usage of fossil fuels has decreased during the time period 1990-2013.
Table 1. Energy utilization in Sweden
1990 2013
Energy Source Supply TWh Share, percent (%) Supply TWh Share, percent (%)
Windpower 0 0 10 1,8
Hydropower 73 13,2 61 10,8
Primary heat 7,1 1,3 4 0,7
Nuclear fuel 202 36,5 189 33,6
Natural gas, gasworks gas 6,7 1,2 11 2
Crude oil and petroleum 168 30,4 134 23,8
Coal and coke 32 5,8 22 3,9
Biomass 61 11 128 22,7
Other fuel 5 0,9 14 2,5
Import - Export electricity -1,8 -0,3 -10 -1,8
Total 553 100 563 100
Source: Swedish Energy Agency (2015)
In the transportation sector diesel and gasoline are the most popular choice of fuel in Sweden but the usage of fossil fuels has since 2007 been reduced in favor for biofuels. The largest usage of fuel is for road transportation which accounts for 93 percent of the total domestic energy usage, which has increased by approximately 11 percent between 1990 and 2013. Biofuel was introduced in the transportation sector 1995 and since than the usage have increased to 8.4 TWh (Swedish Energy Agency, 2015).
The energy utilization in the residential and service industry have decreased by approximately 2.7 percent, while the biomass utilization have increased by 27 percent over the time period 1990-2013. The largest usage of biomass for the sector in 2013 was in one- and two-dwelling buildings. In the industrial sector, the energy utilization has decreased by approximately 2.1 percent between 1971 and 2013. During the same period, the biomass usage increased by 28 percent. The industrial sector corresponds to 38 percent of Sweden’s total energy consumption and the biggest users of energy in the industrial sector are the pulp- and paper industry, the iron, steel and non-ferrous metals industry and the chemical industry. Together these three industries account for approximately 75 percent of the total energy usage in the industrial sector (Swedish Energy Agency, 2015).
8
The energy utilization in the electricity sector has decreased by 0.2 percent and the biomass used in this sector has increase by more than 283 percent since 1990. For district heating, biomass is dominating fuel. In 2013, the total energy usage was 62 TWh of which biomass accounted for 60 percent, which corresponds to 37.4 TWh. The energy utilization in the district heating sector has increased by 52 percent between 1990 and 2013 and biomass has increased from 5.3 to 37.4 TWh during the same time span (Swedish Energy Agency, 2015).
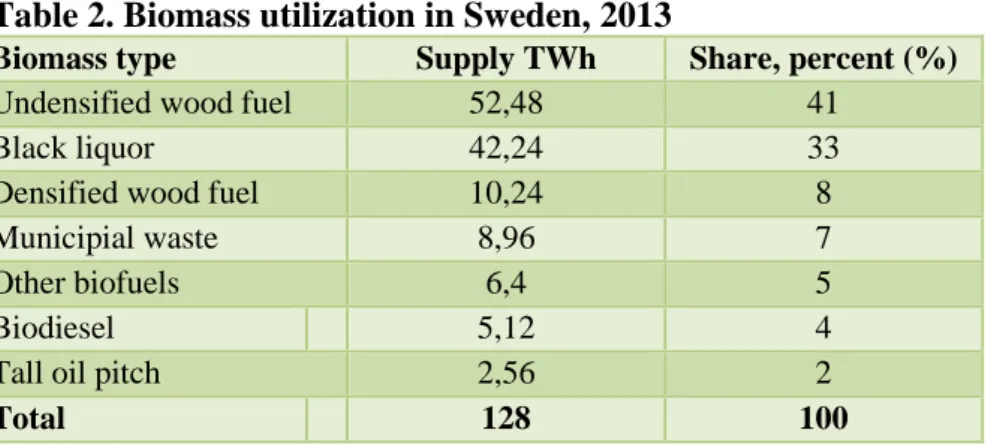
From Table 2 we can see that most of the biomass comes from wood fuel and black liquor. Table 2. Biomass utilization in Sweden, 2013
Biomass type Supply TWh Share, percent (%)
Undensified wood fuel 52,48 41
Black liquor 42,24 33
Densified wood fuel 10,24 8
Municipial waste 8,96 7
Other biofuels 6,4 5
Biodiesel 5,12 4
Tall oil pitch 2,56 2
Total 128 100
9
CHAPTER 3
THEORETICAL FRAMEWORK
This chapter includes a presentation of the theoretical framework that has been used in this study. This involves the theories that generally affect the demand and the supply of woody biomass in Sweden. The different studies included in the review have used some kind of theoretical framework concerning the supply and demand of woody biomass. Therefore, in this meta-analysis the general theoretical framework regarding the supply and demand is used. The theory of optimal harvesting rate is initially presented and discussed.
3.1 Optimal harvesting rate
The availability potential of biomass indicates to what extent it can be used and the feasibility to substitute biomass with e.g., fossil fuels. According to Lundmark & Söderholm (2004), we could if we wanted harvest all of the forest in Sweden but practically it is neither possible nor desirable. Because if we harvest all trees and forest in the country we would not be able to do it again for a long time due to the slow growth rate. Therefore, the harvesting rate should not exceed the growth rate of our forest. It is important to reduce the waste products as much as possible to be able to get more energy from our forests. However, in the long run it is still important that we plant trees at a greater extent to be able to harvest them in the future. If we only harvest and do not plant trees then the forests in Sweden will be depleted, which means that we cannot use woody biomass for energy production in the future.
Forests are a renewable resource, which basically means that the forest will reproduce itself if it gets the opportunity to grow back again. The fundamental difference between renewable resources and non-renewable resources is that non-renewable resources do not have a growth potential. However, both renewable resources and non-renewable resources can get fully exhausted. This means that eventually all trees available for harvesting have been harvested which will prevent the forest to reproduce itself. This will eventually happen if the harvesting rate is faster than the growth rate (Perman et.al., 2011).
10
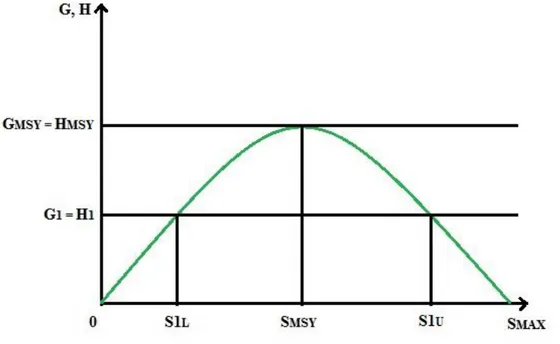
Figure 1 shows the relationship between optimal harvesting and optimal growth of the forest.
Figure 1. Optimal harvesting rates of renewable resources
Source: Natural Resource and Environmental Economics. (2011)
The model assume that given a certain period of time that the forest stock being harvested (H) is equal to the growth rate of trees (G). When this condition is satisfied an optimal harvesting rate is obtained that is sustainable for future harvesting of the forest. S is equal to the net change in availability of the forest, which is expressed by the condition S = G – H. However, if the harvesting rate is larger than the growth rate (H > G) then the forest stock will decrease. If this continues over a longer period of time then there is a risk that the forests in Sweden will be depleted. Steady-state harvesting will be obtained when S = 0, which means that the growth of the forest during a certain point of time will be harvested and the forest stock will thereby be constant over time. This will be obtained when the maximum growth rate (GMSY) is and a maximum harvesting rate (HMSY) is reached. When this condition is reach maximum sustainable yield (MSY) is obtained. However, a steady-state will also be achieved at any point on the growth curve which means that S1L and S1U is also a steady-state level of harvesting but MSY remains the optimal steady-state level (Perman et.al., 2011).
3.2 Supply and demand
The theory behind supply and demand can be viewed differently depending on if an economist, biologist or engineer is conducting the study. The authors, despite their different background have used some kind of framework regarding the supply and demand theory in
11
their studies. However, the framework of interest in this meta-analysis is the general approach stipulating the factors that affect the supply and demand of woody biomass.
3.2.1 Main product
The supply of forest products differs for main products (e.g., roundwood) and by-products (e.g. harvesting residues, woodchips). In the short run the supply for main products is affected by the harvesting capacity and the biological restrictions set by the growth rate. However, in the long run the supply could increase due to for instance improved harvesting techniques and development of new roads (e.g. rail roads and high roads) as long as the harvesting pace of the forest do not exceed the growth of the forest (Lundmark & Söderholm, 2004).
3.2.2 By-product
By-products are different since it is affected by the production of the main product. This means that the production of a by-product cannot increase at faster than the production of the main product. For example, if sawmills decrease the production of its main product (sawn wood products) they will also decrease their supply of by-products (woodchips). As a consequence, the supply of by-products is not affect by fluctuation in their own-price. Thus, an increase in demand could cause higher price increases than otherwise (Lundmark & Söderholm, 2004).
3.2.3 Supply and demand theory
The supply and demand model describes the quantity a buyer and a seller is prepared to trade given a certain price. The demand of woody biomass can be affected by the price, the price of a complement good, the price of a substitute good (e.g. fossil fuel), income and wealth, preferences, government regulations, information about different goods/services and expectations of future prices. The demand curve always has a negative slope because the demanded quantity for woody biomass will decrease at higher price-levels and vice versa. The supply is the quantity that is produced and sold at a given price-level. On a competitive market the supply is the marginal cost of producing woody biomass and is determined by production costs, technology and laws and regulations. The slope of the supply curve is mostly positive as the supply will increase at higher price-levels. Where the demand and supply curves intersect, the demanded quantity is equal to the supplied quantity and is referred to as the market equilibrium, which determines the equilibrium price level. However, this is a theoretical scenario as it is difficult to determine the actual demand and the supply curves
12
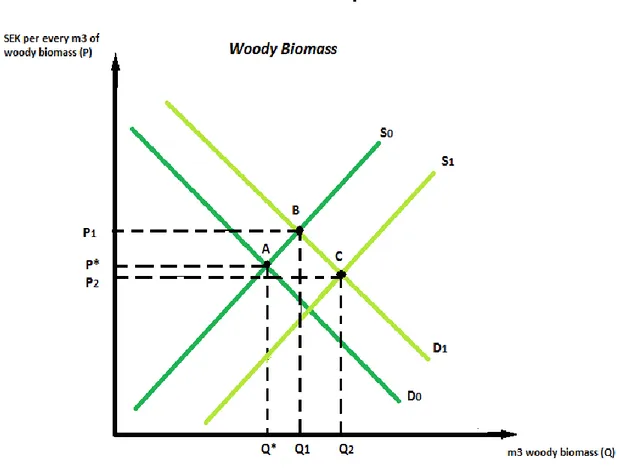
(Lundmark, 2010). Figure 2 shows the principal relationship between supply and demand for woody biomass.
Figure 2. Supply and demand
Source: Adapted from Mikroekonomi: Teori och tillämpning (2010)
On the Y-axis we have SEK per m3 of woody biomass and the X-axis shows the quantity of woody biomass measured in m3. At market equilibrium point A, the price level is P* and the quantity level is Q*. The price level of woody biomass is affected by for example taxes, cost of labour, price of substitute goods For instance, if the price on woody biomass increases then the demand of the good will decrease and the supply of the good will increase. The demand for woody biomass will increase if for example, the price of a substitute increases (e.g. fossil fuels). This can happen if, for example, environmental taxes increase on fossil fuels. The price change of fossil fuels will make the demand curve for woody biomass shift upwards (to the right) from D0 to D1 and increase the demand for other energy sources as woody biomass, we will end up at point B with the price level at P1 and the quantity at Q1. Furthermore, the supply of woody biomass will increase if the wages for the workers in the forest industry
13
decreases, i.e. the decreased cost of labour will cause a shift the supply curve downwards (to the right) from S0 to S1 and we will end up at point C with the price level of P2 and the quantity of Q2 (Lundmark, 2010).
3.2.4 Competitiveness of woody biomass
Lundmark & Söderholm (2004) stating that for woody biomass to be economically competitive for the energy sector two conditions need to be fulfilled. The first is that the price level of biomass has to be low enough to make sure that other energy sources (e.g., fossil fuel) do not become too competitive. The second condition implies that the economic yield for the forest owner to deliver to the energy sector need to be higher compared to delivering to the forest industry.
Woody biomass in Sweden is favored by policy instruments such as environmental taxes and subsidies. According to Lundmark & Söderholm (2004) the Swedish forest commodity markets are a consequence of taxes on emissions of such carbon dioxide. Taxation on carbon dioxide can be justified by the external costs that it entails, i.e., the market failures that occur. As long as the price for coal is low, the willingness to pay for forest products is higher in the forest industry relative to the energy sector. However, because of the external effects of fossil fuels, such as greenhouse gases security-of-supply, woody biomass is more attractive as it is more environmental friendly and domestically available. That is why the Swedish government levies a tax on the utilization of fossil fuel in heating plants. Therefore, the biofuel seems more alluring and the demand for woody biomass increases. Conclusively if there is different willingness to pay in the forestry and energy sector it may cause a problem for the sector that have lower willingness to pay due to that they have to pay a higher price despite no change in consumption and demand for their products (Lundmark & Söderholm, 2004).
Furthermore, it is important to develop technology that makes it possible to increase the production of woody biomass without reducing the demand. This implies that with new technology we could also extract biomass products at a greater extent without letting the price increase so much that the demand decreases for the biomass. To be able to do this the forest industry need to be better at taking care of harvesting residues and thereby reduce the waste, which will reduce the marginal costs. With decreased marginal costs the forest industry can offer the biomass at a lowered price, which will increase the demand and competitiveness that increase the usage of biomass products (Lundmark & Söderholm, 2004).
14
With the optimal harvesting rate and the supply and demand as foundation it will aid in the work of analyzing the scientific papers and other studies to create the meta-analysis.
15
CHAPTER 4 META-ANALYSIS
In this chapter the concept of meta-analysis as a method is presented, which also includes a discussion on its advantages and disadvantages. Furthermore, the determinants of the different potential estimations of woody biomass are categorized and quantified.
4.1 Meta-analysis
In our meta-analysis the dependent variable are represented by the estimated biomass potentials and the independent variables are represented by: (I) restrictions, (II) method, (III) type of study, (IV) time period for estimates, (V) author specialization. Our basic function is the following (see section 4.3 for further explanation of the variables):
𝑩𝒊𝒐𝒎𝒂𝒔𝒔 𝒑𝒐𝒕. = 𝒇(𝒓𝒆𝒔𝒕𝒓𝒊𝒄𝒕𝒊𝒐𝒏𝒔, 𝒎𝒆𝒕𝒉𝒐𝒅, 𝒕𝒚𝒑𝒆 𝒐𝒇 𝒔𝒕𝒖𝒅𝒚, 𝒕𝒊𝒎𝒆 𝒑𝒆𝒓𝒊𝒐𝒅 𝒇𝒐𝒓 𝒆𝒔𝒕𝒊𝒎𝒂𝒕𝒆𝒔, 𝒂𝒖𝒕𝒉𝒐𝒓 𝒔𝒑𝒆𝒄𝒊𝒂𝒍𝒊𝒛𝒂𝒕𝒊𝒐𝒏)
A meta-analysis is a statistical technique that compiles the results from already published scientific papers with related research hypothesis regarding the potential of woody biomass in Sweden. Different studies use different approaches, data sets and methods in their research which implies that the result may vary from study to study. Results from the meta-analysis indicate the rationale and factors that influenced the estimated potential of woody biomass. Meta-analysis is a quantitative method and something that a quantitative study lack is the extreme thoroughness. This means that a quantitative study focuses more on the amount of observations rather than a few deeper observations (qualitative study). However, in a meta-analysis the reviewed studies include both qualitative and quantitative studies (Hedges, 1986). A meta-analysis is beneficial in the way that it can improve and make better understanding of inconclusive results. Furthermore, we gain a greater insight of the impact the choice of methodology, restrictions and variables have on the results (Florax et. al., 2002).
16
By collecting many studies and putting them together in a comprehensive review we gain more variables, conclusions and results that can be examined which creates a larger and more efficient sample (Walker et. al., 2008). According to Noble (2006), a meta-analysis can point out important research questions and give more accurate calculations that need to be evaluated in future studies in the same area.
However, despite the advantages of a meta-analysis, it also has disadvantages. The choice of including or excluding independent variables will have an impact on the outcome. Therefore, an issue when conducting a meta-analysis is the identification and deciding of which explanatory variables that is going to be included in the study (Hedges, 1986).
Walker et. al. (2008) states that the most important issues with meta-analyses are: identification and selection of studies, heterogeneity of results, availability of information and analysis of the data. Identification and selection of studies means that it is important to have a critical view when reading previous studies. This means that studies with an optimistic and deterministic result that gives a positive view of the problem at hand cannot always be used (e.g., the potential of biomass in Sweden). Studies that have undesirable or inconclusive results also need to be included. Furthermore, the availability of information included can limit the possibility to analyze the data from previous studies. This is because it may get difficult to get a good result if the information available is limited which makes it problematic to compare the data collected. For example, if data from the different studies is inconclusive or if too few studies are available, then the result could be unreliable. In other words, it will be a high degree of heterogeneity in the results. However, even if the data have been identified and there is a lot of data available, then it is still not sure that it will give a good result because if the wrong analysis is made then it may cause an unreliable result. This can occur if the data have been interpreted incorrectly.
4.2 The dependent variable
The dependent variable is the estimated potential of woody biomass in Sweden. The potential of woody biomass is presented in the amount of available TWh that can be extracted from the forests in Sweden.
4.2.1 Biomass types
In the different studies there have been several estimations of the potential of different types of biomass: roundwood, harvesting residues and stumps. Some articles have for example only examined the potential of roundwood while others have taking into account all types of
17
woody biomass. To estimate the potential of the different woody biomass types, the energy processed from woody biomass measured in TWh has been used. First the total presented potential is used as dependent variable named TOTAL and then we do new regressions for each of the different type of biomass. The disaggregated dependent variables are labeled ROUNDWOOD, RESIDUES and STUMPS. The variable ROUNDWOOD only includes estimations on roundwood and the variables RESIDUES and STUMPS only includes estimations on harvesting residues and stumps, respectively.
4.3 Independent variables
4.3.1 Time period
This variable is used to account for the number of years in to the future that the different studies are estimating. To be able to measure the variable, it will be a discrete quantitative variable that can take the value 1, 2, 3, 10 etc. The variable will measure the amount of years from when the study is done to the year that is chosen by the authors for the estimates. This variable may also catch other influencing aspects such as technological development and changes in price on the energy market.
4.3.2 Type of study
To capture the impact of the purpose each different study has, i.e., where the study is going to be used or published. This variable is included to address whether the study is published in a scientific paper or magazine or if it is a report made for an institute or an organization (i.e., not a scientific article). This will be a dummy variable named SCIENCE that takes the value of one (1) if the study is published in a scientific paper and zero (0) otherwise.
4.3.3 Author(s) specialization
The type of author(s) specialization is included to capture the effect of the different author(s) background (e.g. economist, engineer/technician or a biologist). The nature of the different author(s) may have a different view and thereby have dissimilar objectives to estimate the potential of woody biomass. This will be measured with variables that are named
SHAREECO, SHARETECH, SHAREBIO that take the percentage value of how big of a share an economist, engineer or biologist have had in a study.
4.3.4 Restrictions
If the author(s) chooses to only estimate the theoretical potential the result may be expected to be higher compared to if a restriction is implemented. For instance, an economical restriction
18
can be that the extraction cost must be economical sustainable and a technological restriction can be a certain type of harvesting truck or that the technology is limited to one type of conversion technique. Furthermore, if an ecological or environmental restriction is implemented it can mean that the harvesting must not affect the nutrition in the soil. To measure this, four dummy variables will be used. The first is THEORETICAL that takes the value one (1) if the study has been using theoretical conditions and zero (0) otherwise. The dummy variable named ECONOMICAL takes the value (1) if the study is restricted by economic conditions only and zero (0) otherwise. TECHNOLOGICAL is a dummy variable that takes the value one (1) if the reported potential has been restricted to technical limitations, zero (0) otherwise. At last a variable named ECOLOGICAL is used and takes the value one (1) if the study is limited to ecological, environmental and cultural restrictions, otherwise it will take the value zero (0).
4.3.5 Methods & approach
The different studies have used different methods/approaches to estimate the potential of woody biomass in Sweden. The chosen method to estimate the potential of woody biomass can affect how results. To be able to capture the effect of every method/approach, a dummy variable have been used for each of the identified approaches. The dummy variable RESOURCE captures the studies that have used a resource-focused approach. This dummy variable takes the value of one (1) if the studies have used this approach and zero (0) otherwise. Furthermore, the dummy variable DEMAND takes the value of one (1) if the studies have used a demand-driven approach and zero (0) otherwise. The dummy variable INTEGRATED takes the value of one (1) if the studies have used an integrated assessment approach and zero (0) otherwise. The dummy variable WOOD captures the studies that have used a wood resource balance approach. This dummy variable takes the value of one (1) if the studies have used this approach or zero (0) otherwise. Furthermore, the dummy variable STATISTICAL takes the value of one (1) if the studies have used a statistical analysis approach and zero (0) otherwise. The dummy variable SPATIALLY takes the value of one (1) if the studies have used a spatially explicit analysis approach and zero (0) otherwise. Lastly, the dummy variables ENERGY SYSTEM and COST-SUPPLY will take the value of one (1) if the studies have used an energy system model and a cost-supply analysis approach respectively and zero (0) otherwise.
19
CHAPTER 5 LITERATURE REVIEW
In this chapter the relevant identified literature is reviewed. The chapter starts with a presentation of our search strategy, i.e., how we have been working to be able to collect the literature. The chapter continues with a review of the previous studies that concerns the potential of woody biomass.
5.1 Research Strategy
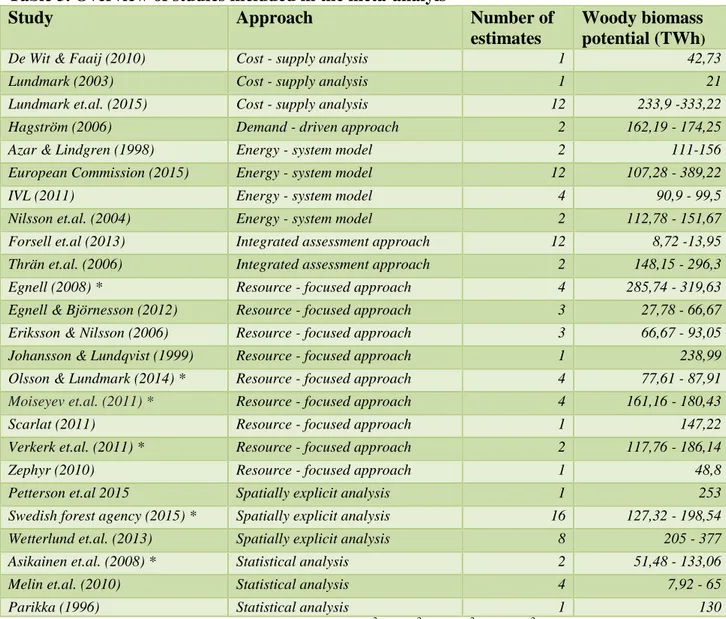
In this meta-analysis a lot of different studies have been read and analyzed and not all of them have been included in this study. We have obtained data from 25 different biomass potential studies, which provides a total of 107 estimations of the potential of woody biomass in Sweden. The 25 different theses in this study have been published in a scientific paper or it has been used as material for an institution, which contribute to the reliability of the data. The search we used following databases: Google Scholar, Web of science and Scopus. The studies have been published during the years 1998-2015 and present results to year 2110. Keywords when searching for the articles that have been used are presented in Appendix A. Table 3 shows a summarized presentation of the studies, it includes the approach or method used, number of estimates and the reported results measured in TWh. More studies have been analyzed but have been excluded due to lack of some sort of measurement for the potential of woody biomass in Sweden. The different studies have used different measures to estimate the potential of woody biomass. Some studies have estimated the potential in m3 while other studies have estimated the potential in joule (J) or TWh. By examining Table 3 it clearly shows that the reported potential of woody biomass has a large spread between the different studies.
20
Table 3. Overview of studies included in the meta-analyis
Study Approach Number of
estimates
Woody biomass potential (TWh)
De Wit & Faaij (2010) Cost - supply analysis 1 42,73
Lundmark (2003) Cost - supply analysis 1 21
Lundmark et.al. (2015) Cost - supply analysis 12 233,9 -333,22
Hagström (2006) Demand - driven approach 2 162,19 - 174,25
Azar & Lindgren (1998) Energy - system model 2 111-156
European Commission (2015) Energy - system model 12 107,28 - 389,22
IVL (2011) Energy - system model 4 90,9 - 99,5
Nilsson et.al. (2004) Energy - system model 2 112,78 - 151,67 Forsell et.al (2013) Integrated assessment approach 12 8,72 -13,95 Thrän et.al. (2006) Integrated assessment approach 2 148,15 - 296,3 Egnell (2008) * Resource - focused approach 4 285,74 - 319,63 Egnell & Björnesson (2012) Resource - focused approach 3 27,78 - 66,67 Eriksson & Nilsson (2006) Resource - focused approach 3 66,67 - 93,05 Johansson & Lundqvist (1999) Resource - focused approach 1 238,99 Olsson & Lundmark (2014) * Resource - focused approach 4 77,61 - 87,91
Moiseyev et.al. (2011) * Resource - focused approach 4 161,16 - 180,43
Scarlat (2011) Resource - focused approach 1 147,22
Verkerk et.al. (2011) * Resource - focused approach 2 117,76 - 186,14
Zephyr (2010) Resource - focused approach 1 48,8
Petterson et.al 2015 Spatially explicit analysis 1 253
Swedish forest agency (2015) * Spatially explicit analysis 16 127,32 - 198,54 Wetterlund et.al. (2013) Spatially explicit analysis 8 205 - 377 Asikainen et.al. (2008) * Statistical analysis 2 51,48 - 133,06
Melin et.al. (2010) Statistical analysis 4 7,92 - 65
Parikka (1996) Statistical analysis 1 130
*The studies where the results have been converted from hm3 and m3 (e.g. m3ob and m3ub) to TWh. 5.2 Conversion ratios
The converting ratios that have been used to convert m3 to TWh are based on the converting ratios presented by Bioenergiportalen.se. Further estimations regarding the conversion can be found in the appendix. When converting m3 to TWh we have assumed that roundwood under bark (m3ub) gives 2 MWh per m3ub. The energy from over bark roundwood (m3ob) has been calculated according to the conversion calculator from Skogssverige.se. According to the conversion calculator, each m3ob gives 0.88 m3ub and as mentioned before 1 m3ub gives 2 MWh. Therefore, every m3ob gives 1.76 MWh. Furthermore, each m3 of forest timber volume (m3t) will give 0.83 m3ub, which means that every m3t gives 1.66 MWh1. Assumptions have
1 ForestSweden. (2016). Conversion table of standard cubic meter measurements in the forest. Retrieved
21
also been made that every m3 of solid volume (m3s) will give 0.8 MWh that every m3 stumps gives 2.5 MWh and that every m3 of harvesting residues gives 2.3 MWh2.
5.3 Analytical sections
The defined analytical sections that are used to review the collected studies are what approach and method the author(s) have used (e.g., resource-focused approach, integrated assessment approach, energy-system models and cost-supply analysis). The time period that the estimations take place is another section that we take in to account for. How restricted the study is may cause the estimation to differ from one and another, therefore, the restrictions economic conditions, technological limitations, theoretical issues and ecological/environmental restrictions have been included as an analytical section. The type of study and authors specialization is also included. Lastly the choice of including or excluding different types of biomass will affect the reported outcome of the study and therefore biomass type is included in the analysis.
5.4 Biomass type
The choice of including or excluding a type of biomass in the primary studies will cause the estimations of the total biomass potential to differ and how the authors chooses to categorize the biomass will cause a similar effect. The woody biomass can be categorized in to different sub-categories. First, there is the main-product that is roundwood that is included in the majority of the studies. Second, the by-products are the harvesting residues that come from felling and can be further divided into branches and tops, small trees that have been left after the felling and stumps as well as industrial by-products (e.g., chips and black liquor).
The harvesting residues (stumps excluded) is also included in most of the studies, some exception (e.g., Ericsson & Nilsson 2006; Forsell et.al., 2013 and Moiseyev et.al., 2011) does not include any observation of harvesting residues in their studies. At last stumps, that also are a by-product, are taken into account in eight studies (e.g., Lundmark et.al., 2015; Wetterlund et.al., 2013 and Pettersson et.al., 2015). However, the authors have different views of the potential of stumps. For instance, Parikka (1996) implies that the energy content in stumps is large but it is not economically sustainable. Furthermore, Egnell, & Börjesson
2Bioenergyportal. (2014). Conversion ratio forest fuel. Retrieved 2016-03-29, from
22
(2012) implied that realistic expectations of the potential of stumps as an energy source is needed due to its lack of cost efficiency for most of the stumps.
Products from the pulp and paper industry provide black liquor and from sawmills we get chips. The most of the authors presents a potential, which includes all of the woody biomass. However, some of them choose to categorize the woody biomass into the different sub-categories that is mentioned earlier.
5.5 Approaches and methods
To estimate the potentials of biomass a number of different methods have been used in the previous studies. It is important to address which approach and method that have been used since it can affect the obtained results.
5.5.1 Resource-focused approach
A resource-focused approach is a supply-side approach to assess the total bioenergy resource base. The approach also analyzes the competition of how the forest is used. This approach have been used in studies made by Egnell & Björnesson (2012); Olsson & Lundmark (2014); Scarlat (2011); Eriksson & Nilsson (2006); Johansson & Lundqvist (1999); Egnell (2008); Verkerk et.al., (2011); Zephyr (2010) and Moiseyev et. al., (2011). The results indicate a large variation in estimated potential, from a low 28 TWh to a high 320 TWh. These studies includes different scenarios and different geographical focuses. For instance, Eriksson & Nilsson (2006) analyzed the potential of woody biomass on an international level in Europe and Scarlat (2011) had a Scandinavian focus while the other authors Egnell & Börjesson
(2012), Olsson & Lundmark (2014) and Zephyr (2010) main focus were on Sweden.
5.5.2 Integrated assessment approach
This is a combined demand-driven and resource-focused approach in which the technical, economic or environmental restrictions are imposed. This type of approach combines the bottom-up data on land-use and productivity with energy models which can provide an appropriate framework. Forsell et al., (2013) shows how energy models called MARKAL and TIMES that analyses future possibilities of biomass can assess a combination of demand-driven approach and resource-focused approach. Thrän et.al,. (2006) made an integrated assessment approach study and have used the EFISCEN model to conduct two different scenarios, to estimate the woody biomass in Sweden. Their reported outcome was 158-296 TWh.
23
5.5.3 Cost-supply analysis
A cost-supply analysis is a bottom-up approach of the potential, based on assumptions regarding the availability of forestry and forestry residues. This approach combines the cost-supply curves that are constructed are combined with the estimates of the cost of other energy systems or policy alternatives. Lundmark (2003) made a study regarding the supply of roundwood and harvesting residues and its cost structures. By analyzing the economical sustainability woody biomass he concluded that after 21 TWh extracted from harvesting residues it is more efficient to use roundwood for energy purposes. Lundmark et al., (2015) used Geographical Information System (GIS) to calculate forest biomass availability and procurement costs. The conclusive result was that stumps are to costly compared to roundwood and harvesting residues for energy purposes. de Wit & Faaij (2010) also used a cost-supply analysis to analyze the resource base of woody biomass in Europe. Their outcome of the study was that 43 are available in Sweden.
5.5.4 Energy-system models
Is an approach that simulate the dynamics of the demand and supply of energy, including bioenergy, by investigating economic and non-economic correlations. This approach also estimates the energy demand in different sectors and industries. European commission (2015) estimates the current state of biomass and its future potential in Europe using a model called JRC-EU-TIMES that are developed to analyze technologies and their possibilities to reach Europe´s environmental goals. IVL (2011) uses an energy system model approach to analyze the possibilities for Sweden to be 100 percent free from fossil fuels. The result reported in these studies varies from 9 to 100 TWh. Azar & Lindgren (1998) conducts two scenarios to analyze how different demand and production levels in the different sectors can affect the usage of biomass Their reported outcome was 111-156 TWh. Nilsson et.al., (2004) discusses if policy instruments or R&D have had a greater impact on the fuel prices for biofuels. Their presented result was 113-152 TWh.
5.5.5 Spatially explicit analysis
This approach includes spatially explicit data on forest availability in combination with calculations of forest yields and is used for the most advanced resource-focused assessments. The scenario analysis is based on for instance; policies and technological development. A model called BeWhere Sweden, a geographically explicit optimization model, is used by Wetterlund et al., (2013) to find optimal localizations for production plants for next generation biofuels in Sweden. The same model has also been used by Pettersson et. al.,
24
(2015). Wetterlund et. al., (2013) conducts scenarios with different restrictions and assumptions and it resulted in a reported outcome of 241 TWh to 377 TWh by the year 2030. Pettersson et al. (2015) had a result of 253 TWh per year based on quantities for year 2010. Swedish Forest Agency (2015) estimating the potential with six different scenarios Data from “Riksskogstaxeringen” regarding the supply of forest during the years of 2008-2012 is used. Their result indicates a potential between 127 and 199 TWh.
5.5.6 Statistical analysis
Statistical analysis is the least complex approach. The estimates for the potentials are based on assumptions regarding the yield per hectare which is based on field studies or a literature review. Assumptions regarding how much forest biomass that is available for energy purposes (accounting for land use and environmental and social barriers). Parikka (1996), Asikainen et.al., (2008) and Melin et.al., (2010) are the studies that have been using a statistical analysis to estimate the biomass potential in Sweden. Parikka (1996) used coordinates from NFS-system (National Forest Survey) to estimate the forest supply and present results on the potential of woody biomass on 130 TWh. Asikainen et.al., (2008) had their main focus on Europe (EU27) and used available statistical data for each country. Their result was between 51-133 TWh. The last study that used statistical analysis approach is Melin et.al., (2010) and have used historical data from NFI (Swedish National Forest Inventory) of the biomass supply to estimate the potential of stumps. The study presented a potential of 8-65 TWh.
5.5.7 Demand-driven approach
Demand-driven approach is typically applied when analyzing the competitiveness for biomass products, or when estimating the amount of biomass required to reach exogenous targets on climate policies. Hagström (2006) is the only study that is included in this meta-analysis that has used a demand-driven approach. Hagström (2006) used scenarios were the utilization of biomass is distributed among heat, electricity and vehicle fuel. The final reported outcome of the study is 162-174 TWh.
5.6 Time period
The estimations for future potentials have higher risk to be more uncertain then estimation that take place closer to the present. Therefore it is important to take into account the studied time period as the result can be over- or under-estimated. Johansson & Lundqvist (1999) and Azar & Lindgren (1998) point out that whether the estimated potentials are applicable or not depend on the future policies, technological developments and energy prices. This is because
25
policies, technology and energy prices may change over the years, which can affect the estimations of the future biomass potential in Sweden.
The most common year for the estimate is 2020. However, the amount of years up to 2020 depends on when the study is made. Therefore the time period differs quite a lot from study to study. For instance Zephyr (2010), Johansson & Lundqvist (1999) and European Commission (2015) are studies that have estimates for 2020 but the years studied in the future vary between 5 to 21 years. The total range of years studied are between 1 and 95. The mean value for number of years studied is 23.6. Swedish Forest Agency (2015) has estimates that include the year 2110. The studies that only have estimated the potential for woody biomass for the year it was conducted (e.g. Lundmark 2003, Egnell, & Börjesson 2012, Pettersson et. al 2015 and Melin et.al 2010) have been classified as 1 year in the future.
5.7 Restrictions
The choice of restrictions in the analyzed studies will affect the estimated potential of woody biomass in Sweden. The restrictions identified are: Theoretical condition, technical limitations, economic conditions, ecological, environmental, and cultural restrictions.
5.7.1 Theoretical conditions
The theoretical issues refers to the amount of forest that is assumed to be theoretical available for harvesting for bioenergy production. For by-products it is the fraction of the production level of the main product. The studies that have used theoretical conditions are Lundmark (2015); Wetterlund et.al., (2013); Pettersson et.al., (2015); Nilsson et.al., (2004); Scarlat et.al., (2011); Egnell & Börjesson (2012); Melin et.al., (2010); Verkerk et.al., (2011); Asikainen et.al., (2008) and Thrän et.al., (2006). The studies use the theoretical conditions differently. For instance,Pettersson et.al., (2015) take into account the entire Swedish forest inventory in their calculations, which makes it possible to estimate the theoretical potential using a program named HUGIN. Scarlat et.al., (2011) who focus on Norway but also includes Sweden calculated the theoretical potential of woody biomass using statistics of the amount of forest that exists in Sweden.
5.7.2 Technical limitations
Technical limitations are the fraction of the theoretical potential that is available under specific technological conditions (e.g., harvesting techniques, infrastructure and accessibility and conversion techniques). Wetterlund et.al., (2013); Zephyr (2010); Eriksson & Nilsson (2006); Johansson & Lundqvist (1999); European Commission (2015); Forssel et.al., (2013);
26
Lundmark (2003); Nilsson et.al., (2004); IVL (2011); Olsson & Lundmark (2014); Egnell, & Börjesson (2012); Melin et.al., (2010); Egnell (2008); Verkerk et.al., (2011); Asikainen et.al., (2008) and de Wit & Faaij (2010) have all used technical limitations. The technical limitation can be used in different ways and have different assumptions. For example, Ericsson & Nilsson (2006) assumes different harvesting techniques in the scenarios that includes different amount of residues that can be extracted per ton roundwood. Another study that assumes technical restrictions is Melin et.al., (2010). They assume different intensities in the felling that allows different volumes and size of stumps to be extracted per year.
5.7.3 Economic conditions
Economic conditions are the share of technical potential that meets economic profitability criteria, given prevailing conditions. Wetterlund et.al., (2013); Zephyr (2010); Johansson & Lundqvist (1999); European Commission (2015); Forssel et.al., (2013); Lundmark (2003); Nilsson et.al., (2004); IVL (2011); Olsson & Lundmark (2014); Egnell & Börjesson (2012); Melin et.al., (2010); Egnell (2008); Verkerk et.al., (2011); Moiseyev et.al., (2011); de Wit & Faaij (2010) and Hagström (2006) have all used economic conditions. This restriction can also be used differently. For instance, Forsell et.al., (2013) conduct different demand scenarios with the purpose do calculate the amount of woody biomass that is needed to make it more efficient and make it more competitive as an energy source. Lundmark (2003) calculate the amount of harvesting residues that are available given certain technologies and cost structure. Given those conditions it is only economically sustainable to harvest 21 TWh per year.
5.7.4 Ecological, environmental and cultural restrictions
Ecological, environmental and cultural restrictions is the share of the economic potential that is left after accounting for e.g., nature reserves, land use change, emissions and abatements. Lundmark (2015); Ericsson & Nilsson (2006); Parikka (1996); Azar & Lindgren (1998); IVL (2011); Egnell (2008); Swedish Forest Agency (2015); Thrän et.al., (2006); Wetterlund et.al., (2013); Johansson & Lundqvist (1999); European Commission (2015); Forssel et.al., (2013); Nilsson et.al., (2004); Olsson & Lundmark (2014); Egnell & Börjesson (2012); Melin et.al., (2010); de Wit & Faaij (2010) and Hagström (2006) have all used ecological, environmental and cultural restrictions. Different calculations can be made using ecological restrictions. For instance, the calculations made by Azar & Lindgren (1998) are estimated given certain CO2
reduction scenarios. The scenarios assume varying utilization levels of energy consuming products (e.g., heating for houses and building or traveling with cars and airplane). Verkerk
27
et.al., (2011) is assuming constraints in their estimates. For instance the soil productivity needs to be at a level that is prevent negative impacts on the nutrition in the soil when extracting and excluding areas that are protected from harvesting.
5.8 Scientific paper
Whether the primary study is a scientific paper and published or if it is an organizational report or an institutional report is important to take into account. Due to what purpose the study has may cause the reported potential to differ, depending on if the study has a special “angle” or aim. The share of scientific paper and organizational reports (institutional reports included) are relatively equal, 47 percent and 53 percent respectively.
5.9 Author(s) specialization
The specializations of the author(s) may cause the angle or approach to differ between the studies and this can affect the outcome of the study. The specializations that are included in this meta-analysis are; if the author has an economical background, engineering or technicians or if they have a biological or an environmental background. The author(s) have been categorized based on their recent research and their background. Most of the studies have a mix of all three specializations. However, a few studies (e.g., Olsson & Lundmark 2014; Moiseyev et.al., 2011 and de Wit & Faaij 2010) are exclusively made by economists. Studies that have authors with only a technical or engineering background are Eriksson & Nilsson (2006); Azar & Lindgren (1998); Hagström (2006) and Scarlat et.al., (2011). There are four studies that have exclusively biologists authors: Egnell (2008); Parikka (1996); Melin et.al., (2010) and Swedish Forest Agency (2015).
28
CHAPTER 6
ECONOMETRIC SPECIFICATION AND DATA ISSUES
In this chapter the econometric model is presented and discussed. Finally a table with the descriptive statistics for the different included variables is presented.
6.1 Econometric specification
A meta-regression model is used to examine the explanatory variables impact on the estimated potential of woody biomass in Sweden, measured in TWh. When conducting a meta-regression it includes a choice of modeling data where there are a couple of approaches available. The first is panel data which includes the fixed effect model and the random effect model. However, neither of these models is suitable for this meta-regression because the different studies are not identical. Therefore, a fixed effect model has not been used in this study. Furthermore, both of the two conditions (unobserved variables have been randomly selected and the response variable is uncorrelated with the explanatory variables) for a random effect model to be suitable is not fulfilled. Therefore, the random effect model is not used in this study (Dougherty, 2011).
Pooled ordinary least square (OLS) is another option to choose in our regression model. In this model there are no unobserved effects and the observations are compiled into a single sample and therefore treat it like a regular OLS (Dougherty, 2011).
A meta-regression model with an ordinary least square estimation makes it possible to drop one of the explanatory variables too see how this variable estimate an influence on the dependent variable. Since we have defined variables as characteristics this model makes it possible to estimate what effect the different restrictions and approaches have on the dependent variable. The model we are going to used is regular ordinary least square since the above methods have been tested and the best fit for our estimations were the regular OLS. When using OLS problems in the form of heteroscedasticity and multicollinearity can occur, these problems need to be taken into account (Dougherty, 2011).