of Orthodontics. This paper has been peer-reviewed but does not include the
final publisher proof-corrections or journal pagination.
Citation for the published paper:
Ganzer, Niels; Feldmann, Ingalill; Liv, Per; Bondemark, Lars. (2018). A
novel method for superimposition and measurements on maxillary digital 3D
models-studies on validity and reliability. European Journal of Orthodontics,
vol. 40, issue 1, p. null
URL: https://doi.org/10.1093/ejo/cjx029
Publisher: Oxford University Press
This document has been downloaded from MUEP (https://muep.mah.se) /
DIVA (https://mau.diva-portal.org).
measurements on maxillary digital 3D models:
Studies on validity and reliability
Niels Ganzer
∗, Ingalill Feldmann
†, Per Liv
‡, Lars Bondemark
§April 22, 2017
This is a pre-copyedited, author-produced version of an article accepted for publication in the European Journal of Orthodontics following peer review. The version of record of article cjx029 is: Eur J Orthod, Volume 40, Issue 1, 23 January 2018, Pages 45–51, ePub ahead to print 22 April 2017. The version of record is available online at:
https://doi.org/10.1093/ejo/cjx029.
∗DDS, PhD Student at Malmö University and Center for Research and Development Uppsala University / Region Gävleborg, Senior Consultant Orthodontist at Public Dental Service Region Gävleborg, Gävle, Sweden.
Corresponding author.
Contact: niels.ganzer@regiongavleborg.se
†DDS, PhD, Senior Consultant Orthodontist at Public Dental Service Region Gävleborg, Senior Researcher at Center for Research and Development Uppsala University / Region Gävleborg, Gävle, Sweden
‡PhD, Statistician at Center for Research and Development Uppsala University / Region Gävleborg, Gävle, Sweden §DDS, PhD, Senior Consultant Orthodontist, Professor and Head of Department of Orthodontics, Malmö University,
Abstract
Background
Serial 3D models can be used to analyze changes, but correct superimposition is crucial before measurements can be assessed. Earlier studies show that every palatal structure changes due to growth or treatment. Here, we describe a new method that uses an algorithm-based analysis to perform superimpositions and measurements in maxillary 3D models. This method can be used to identify deformations. In a second step, only unchanged areas are used for superimposition.
Objectives
This study investigates the validity and reliability of this novel method.
Methods
Digital 3D models from 16 cases were modified by an independent 3D engineer to simulate space closure and growth. True values for tooth movements were available as reference. Measurements and repeated measurements were performed by four observers.
Results
The total tooth movement had an absolute mean error of 0.0225 mm (SD 0.03). The intraclass correlation coefficient (ICC) was 0.9996. Rotational measurements had an absolute mean error of 0.0291 degrees (SD 0.04 degrees) and an ICC of 0.9999.
Limitations
Serial models need to be taken with a moderate interval (1 to 2 years). Obvious changed areas in the palate need to be cropped before processing the models.
Conclusion
The tested method is valid and reliable with excellent accuracy and precision even when changes through growth or orthodontic treatment occur.
Introduction
Traditionally, orthodontists have used lateral ceph-alograms and study casts to establish diagnoses and to develop treatment plans. Changes as the result of growth or treatment are commonly evalu-ated through superimposition in order to describe what changes have taken place between the two registrations.1,2
When superimposition is made on study casts, the palatal rugae have been used as references.3
Study casts, however, are rapidly being replaced by digital 3D-models, a technique that has proven to be valid and reproducible for linear measurements such as overjet, overbite, arch width, and tooth width.4–8 Consequently, measurements on digital
3D models are generally considered comparable to measurements using study casts, making 3D models a viable replacement for traditional study casts.9
As with any superimposition, stable anatomical structures are required as references. Because the medial points of the third palatal rugae were found to be stable enough in untreated patients and in patients treated with premolar extractions and en masse retraction,10 the palatal rugae have been
used as reference landmarks even for the first at-tempts to superimpose 3D models. This principle of manually selecting a few corresponding points giving a rough initial alignment is called coarse or raw matching.11Although raw matching is used in
most software packages for orthodontic treatment planning and analysis, the manual selection and measurement of matchings can be a source of error.
The next generation of superimposition ap-proaches used the palatal vault or parts of it as a reference by using a best-fit method.12–15 This
technique of fine matching uses thousands of refer-ence points instead of a few landmarks and is based on iterative closest point algorithms (ICP).16 The
effect of outliers is reduced while accuracy and reliability markedly improves for superimposition of serial 3D models. A five-year follow-up study found that even the position of the third rugae is changed slightly in the vertical plane, a finding that was true for both adolescents and adults due to growth and remodelling.17 Moreover, a trial in
pa-tients treated with rapid maxillary expansion and maxillary protraction headgear reported significant changes in the vertical plane due to orthodontic treatment.18 In addition, it has been shown that
palatal height changes several millimetres due to
growth in adolescents.19,20 Therefore, it remains
unclear whether parts of the palatal vault can be considered stable enough to be used as a reference landmark for superimposition.
There is evidence that in adolescents the palatal vault changes in the sagittal, transversal, and ver-tical planes, so there is no anatomical structure that in general can be considered stable. However, this instability does not mean that there are no structures at all that can be used for superimpos-ition. Computer programs detect morphological changes in a series of models. By using this deform-ation analysis, all structures that have changed can be filtered out, leaving only unchanged structures for superimposition.
Through several series of test-measurements, we found that the best results came from a combina-tion of raw matching, fine matching, and deform-ation analysis. This novel method, that we call RFD-superimposition, can handle variations in local point resolution, can differentiate outliers from morphological changes, and can use several techniques for sample size reduction. We hypothes-ized that RFD-superimposition introduces min-imal measurement error. The aim of this study was to analyse the validity and reliability of meas-urements on serial 3D models that use the RFD-superimposition method.
Material and Methods
Materials
Sample size requirements were determined based on data from Choi et al.12; they reported standard
deviations between 0.12 and 0.2 mm for the mean differences between digital and manual point-to-point measurements. Assuming the within-case standard deviation to be within that range and the between-case standard deviation to be approx-imately 0.75 mm, based on clinical experiences within the research group, the value of the intra-class correlation coefficient (ICC) lies between 0.93 and 0.96. A power analysis using the programming language R21 and the ICC.Sample.Size package22
showed that including 16 cases would give 80% power with an anticipated ICC of 0.95 when test-ing the null hypothesis that the ICC is equal to 0.80.
A list of 16 randomly selected cases was gen-erated using R. These cases were derived from a randomized controlled trial on anchorage.23
Eth-ical approval was obtained from the Uppsala Uni-versity ethics committee. All patients and their parents gave written informed consent. Study casts of these 16 cases were fabricated from alginate impressions at the in-clinic laboratory within 24 hours. These casts were then digitalized with a R700 desktop scanner (3Shape, Copenhagen, Den-mark). The 3Shape system has been validated in earlier studies.24,25 The 16 digital models served
as start models.
Specimen
To simulate an orthodontic treatment and growth, the 16 start models were modified by an independent 3D engineer. This modification was used to simulate space closure after extraction of the first premolars. Since tooth movements were performed artificially, the true value for transla-tion and rotatransla-tion of the right maxillary first molar (tooth 16) could be used as a reference. The
pal-atal vault was then changed morphologically to simulate growth and to challenge the matching process.
Superimposition
The RFD-superimposition is based on a series of matchings. A matching places one object on top of another object using as many corresponding points as possible from both objects. To improve the accuracy, the matching process is repeated several times. For every repetition, the starting position is improved although matching two different objects cannot result in 100% congruence. Therefore, the matching result does not improve after a certain number of repetitions. Since every repetition needs time for calculation, it is crucial to choose a bal-anced number of repetitions: As many times as necessary, as few times as possible.
The same principle applies for the number of points included in the calculation. The part of the palate that was included in the matching process contains about 11 000 points. If deformation ana-lysis is performed for each point, the calculation will take hours and the influence of outliers will in-crease. By reducing the number of points included, calculation times are shortened and outliers are excluded. The number of repetitions and points mentioned in the following description was found suitable in the test series.
When matching two objects, one of the objects has a fixed position and it is called the master object; the other object (the object to be superim-posed) is called the slave object. Superimposition
of maxillary 3D models was accomplished in three steps: raw matching, fine matching, and deforma-tion analysis.
Raw matching: Since the median point of the third rugae was considered most stable, the su-perimposition started with a coarse positioning of the models according to six corresponding points in this area (Figure 1). The corresponding points were individually selected for every case. The selec-tion was based on clear and characteristic surfaces that could be found in both models.
Fine matching: The fine matching, performed using Final Surface® software, uses a point to
tri-angle best fit method, a technique that is less sensitive to variations in the local point resolution. To minimize the effect of outliers, the maximum number of reference points was limited to 1000. From these 1000 reference points, the best 900 were used for the matching. Beyond this, the con-vergence method was used - i.e., the fine matching was repeated until a certain level of agreement between the matching objects was reached. The level of agreement was defined as 0.000001 mm. The maximum number of repetitions was 50.
Deformation analysis with the ICProx algorithm: An algorithm is a predefined set of operations. The main task of the Iterative closest proximity algorithm (ICProx) is to detect deformations (26). Deformations can generally be detected by asso-ciating corresponding points from master to slave model. The ICProx algorithm puts a grid of reg-ularly distributed points onto the master model. After these so-called candidate points are estim-ated, the median distances between the candidates and their adjacent points are calculated. Next, a surface with a radius of this distance is created that surrounds every candidate point.
For the slave model, candidate points are estim-ated in the same way. Every candidate point from the slave model has a corresponding surface on the master model. This point-to-surface approach gives the algorithm a robust tolerance against point resolution variations since the corresponding point is matched somewhere on the surface and not ex-actly on the corresponding candidate.
Deformations are then detected by applying an octree cell structure onto the model. Octrees are used to subdivide 3D space into cubes. A grid of cubes with an edge length of 0.5 mm was put into the model and the algorithm identified one candidate point per cube. The candidate points
Figure 1: Palatal vault of start (blue, master model) and specimen (red, slave model) with corresponding reference points.
were then filtered by merging cubes into cells with 1.5 mm edge lengths (Figure 2). Cells where the distances between the candidate surface and the corresponding point exceed a certain threshold are understood as containing morphological changes and are excluded from the following matching.
Figure 2: Palatal vault after deformation analysis. Used reference
points are marked red. The 3D grid consisting of filter cubes is shown in light grey.
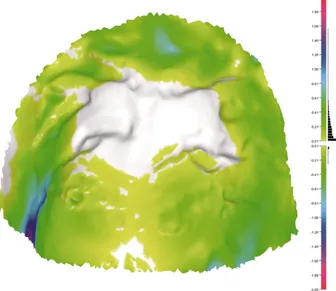
This three-step process is repeated 15 times to minimize the distance between the corresponding points and surfaces. The final result of the su-perimposition is shown in Figure 3. The ICProx algorithm was originally developed in order to monitor morphological changes in terrestrial laser scans.26 With this algorithm point clouds with
large inherent deformation zones can be matched.27
RFD-superimposition is the result of an interdis-ciplinary approach to transfer this knowledge to the dental field. The ICProx (iterative closest prox-imity) algorithm is not to be confused with ICP (iterative closest point) algorithms. ICP algorithms match corresponding points from two objects. The ICP fails to conduct a correct superimposition as soon as the two objects differ too much in their morphology. Best-fit methods are usually based on ICP algorithms.
Figure 3: Distance analysis with true values showing an
un-changed area (white coloured) in the centre of the palatal vault.
Measurements
Four senior consultant orthodontists independ-ently conducted the superimpositions followed by
the measurements. Repeated superimpositions and measurements were performed by all four observ-ers after at least two weeks. The observobserv-ers were blinded to the true value until the repeated meas-urements were completed. After the initial exercise program, measurements could be performed within ten minutes per case.
3D-model analysis
All 3D models were imported as .stl-files into the Final Surface® software including the
Defo-Scan++ Plugin (v 6.0.2, Society for the Promotion of Applied Computer Science, Berlin, Germany). Superimposition and measurement are presented in
Supp1-InstructionVideo.mov and were performed
as follows (the start model is the master and the specimen is the slave):
1. Cropping of the palatal vault: In a first step, both the start and the specimen model were cloned. The clones were named start palatum and specimen palatum. All areas known to be unstable were removed leaving the palatal vault from distal of the second premolar to the papilla incisiva.
2. Raw matching through six individually chosen corresponding points near the median point of the third rugae.
3. Fine matching with up to 50 iterations. 4. Deformation analysis and superimposition
with the DefoScan ++ Plugin with 15 itera-tions. Collector parameter was set to octree cell size 0.5 mm edge length and filter para-meter to octree cell size 1.5 mm edge length. 5. Superimposition of the uncropped models
was performed by loading the transformation matrix of specimen palatum into the spe-cimen model, transferring the result of the RFD-Superimposition of the palatal vault to the original models.
Measurements were then executed as follows: 1. The superimposed models start and
speci-men were cloned. The clones were named start 16 and specimen 16. Then the occlusal
surfaces of the right maxillary first molar in both models were selected and cropped. The weight centres were centralised and the posi-tion of start 16 was measured (PreTX x-, y-, z-coordinates).
2. Start 16 was then cloned again and named
start 16a. This new clone was moved towards
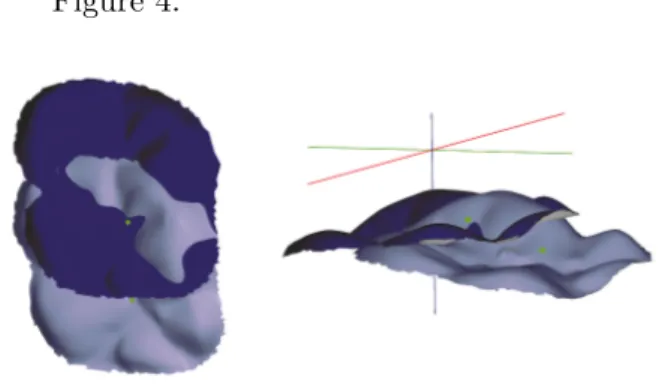
the position of specimen 16. This was done through an initial raw matching followed by repeated fine matchings until the number of iterations was fewer than ten. The position and rotation angles of the occlusal surface 16 were measured. The position of the two objects start 16 and start 16a are shown in Figure 4.
Figure 4: Pre- and post-treatment position of tooth 16s occlusal
surface.
Variables
Tooth movement was calculated by subtracting the PreTX coordinates from the PostTX coordin-ates, giving a translation for x (transversal), y (mesio-distal), and z (vertical). The total
move-ment, d, was calculated as d =p
(x2+ y2+ z2).
In addition to translation, the rotation was meas-ured. Measurements of tooth 16 were separated into rotations around the three principal axes.
Statistics
For the purpose of examining the relationship between measured total movement and true total movement, a mixed effects model was fitted with measured total movement as the dependent vari-able, true total movement as a fixed covariate, and cases and observer as random factors. A variance components structure was used in the model. The mixed model can be explained as a simple linear regression model of the relationship between meas-ured and true total movement, but this also ac-counts for dependence between observations made on the same case and by the same observer.
As a measure of relative reliability, ICCs were estimated for the following variables: total move-ment; x-, y-, z-translations; and x-, y-, z-rotations. Random effects models were estimated with each of these as a dependent variable and case and observer as random effects. The ICCs were es-timated as follows: σ2bs
is the between-cases variance component, σ2bo is the inter-observer variance component, and σ2e is the residual variance of the model. This ICC estimates the correlation between two repeated measurements on the same case performed by the same observer. Confidence intervals (CI) with 95% confidence levels for the ICCs were estimated us-ing parametric bootstrappus-ing with 2000 iterations. The R-Code that was used for statistical analysis can be found in Supp2-RCode.R. The raw data is presented in Supp3-RawData.csv.
Results
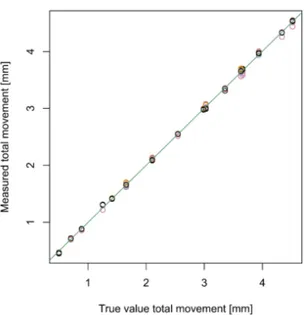
The differences between measured total movements and true total movements are presented in Figure 5. The mean absolute error for total movement was 0.0225 mm (SD 0.03 mm). The arithmetic mean er-ror was -0.0017 mm. The range of total movements was from -0.07 mm to 0.08 mm. The ICC for meas-ured total movement was 0.9996. Figure 6 shows the measured total movements plotted against the corresponding true total movements. Thus, the distribution of the measurements is generally very close to the line of identity. This indicates that this technique is as accurate for measuring small distances as it is for measuring longer distances.
Estimated parameters from the mixed model, describing the relationship between measured and true total movement, are presented in Table 1. The intercept (-0.007) and the slope for the true movement (1.003) were very close to the line of identity (intercept = 0, slope = 1), indicating that any systematic errors of the measurements were very small. Random measurement errors (i.e., the variability of the random effects) were dominated by the residual error (56.9% of total variance), vari-ability due to cases (32.4%), and varivari-ability due to observer (13.7%). However, the random measure-ment errors were also small; the standard deviation of the random effects due to cases, observer, and
residuals were 0.0177 mm, 0.0115 mm, and 0.0229 mm, respectively.
Figure 6: Measured total movement versus True total movement.
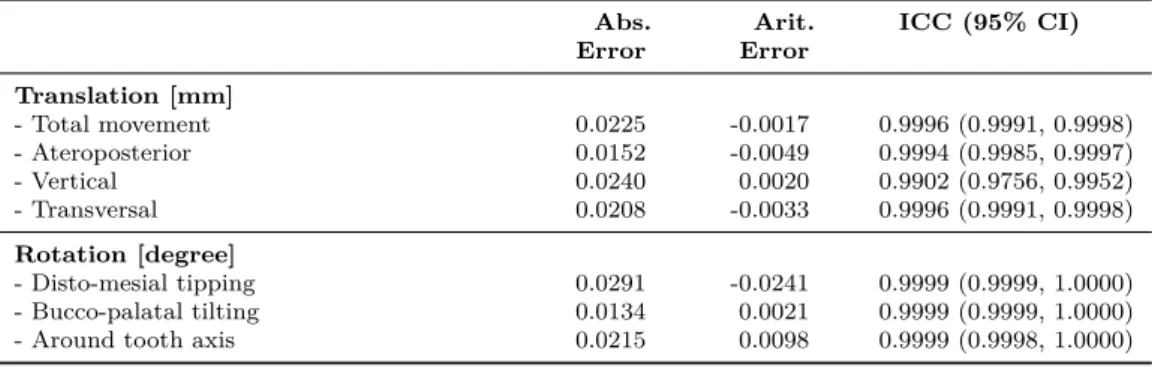
The results of translational and rotational meas-urements are presented in detail in Table 2. Model diagnostics were performed using various graphs of residuals and fitted values. QQ-plots of the re-siduals showed somewhat heavy tails for some of the mixed effects models but were considered to be within the limit of what could be acceptable. More details can be found in the supplementary material.
Table 1: Estimated parameters for total tooth movement of the
mixed model.
Fixed effect Estimate Std error
- Intercept -0.007 0.01
- True value (slope) 1.003 < 0.01
Random effect Variance Std deviation
- Cases 0.0003142 0.017
- Observer 0.0001327 0.011 - Residual error 0.0005228 0.023 - Total variability 0.0009697 0.031
Figure 5: Differences between measured total movements and true total movements. Each of the four observers is represented by a
unique colour.
Table 2: Absolute mean errors, arithmetic mean errors and ICC with estimated 95% CI. Abs.
Error ErrorArit. ICC (95% CI)
Translation [mm] - Total movement 0.0225 -0.0017 0.9996 (0.9991, 0.9998) - Ateroposterior 0.0152 -0.0049 0.9994 (0.9985, 0.9997) - Vertical 0.0240 0.0020 0.9902 (0.9756, 0.9952) - Transversal 0.0208 -0.0033 0.9996 (0.9991, 0.9998) Rotation [degree] - Disto-mesial tipping 0.0291 -0.0241 0.9999 (0.9999, 1.0000) - Bucco-palatal tilting 0.0134 0.0021 0.9999 (0.9999, 1.0000) - Around tooth axis 0.0215 0.0098 0.9999 (0.9998, 1.0000)
Discussion
The combination of raw matching, fine matching, and deformation analysis (RFD) superimposition delivers accuracy and precision in a dimension far beyond measurements on cephalometric X-rays, plaster casts, or 3D models with point-to-point measurements. The RFD superimposition delivers results that describe tooth movements not only as translation but also in terms of tipping, tilting, and rotation. This technique takes measurements by matching objects rather than by manually selecting measurement points. The identification of points is difficult and has been reported as a source of er-ror.28,29 Nalcaci et al.30, comparing manual point
measurements of molar distalization on cephalo-metric X-rays, photographs, and 3D models, found a standard deviation of about 1.3 mm for all three
techniques. No statistical significant difference was found. Therefore, it can be assumed that this new technique can eliminate the error associated with manual selection of measurement points.
Although earlier validation studies have ana-lysed different techniques for superimposition and reported measurements with high accuracy and precision, these studies compared measurements on digital 3D models with measurements on plaster casts or on lateral cephalograms.12,15,18 Hoggan
et al.3, comparing measurements on plaster casts
with cephalometric X-rays, found no statistically significant differences in measurements of move-ment of the maxillary first molar, but they did find that the standard deviation for measurements on plaster casts was between 1.6 and 2.1 mm and on cephalometric X-rays it was 2.0 mm. Because RFD-Superimposition has a standard deviation of 0.03
mm, it can be assumed that these techniques, al-though widely used, suffer from more measurement errors than measurements gathered from digital 3D models. Therefore, these techniques may no longer be considered the gold standard.
Chen et al.13, using unloaded miniscrews as
reference points, conducted measurements on 15 adult patients. Although unloaded miniscrews are regarded as stable in this study, they reported changes in miniscrew positions of up to 0.5 mm. This movement indicates that miniscrews might not be suitable as a reference for a technique with minimal measurement errors.
Thiruvenkatachari et al.14actually used a setup
where the true values for translation were used as reference. This study was a source of inspiration for our current work. The use of specimen is an elegant way to avoid a situation where measure-ments assessed with a new technique have to be compared to another technique that obviously has more measurement error. However, in their study both master and slave models were identical in the palate. Technically, this validation matched identical surfaces. It would have been surprising if the matching process had failed. Moreover, their study did not measure rotational movement.
Unlike earlier studies, our study used true values as reference and the master and slave model did not have identical surfaces in the palate.12–14,18,30
Consequently, our results showed that our new technique was robust for changes in the palate, im-plying that this new method can be used in growing patients subjected to orthodontic treatment.
The measurements were performed by senior consultant orthodontists with different computer skills. After thorough instruction, any orthodont-ist would be capable of performing these measure-ments. The time needed per case (10 minutes) was comparable or even shorter for the time needed and duration to carry out, for example, tracing and superimposition of cephalometric X-rays. If the RFD superimposition is applied, the lateral head radiographs are not needed for evaluation of tooth movements. That is, an added benefit of the technique is that patients are not exposed to X-ray radiation.
Limitations
Despite the impressive accuracy and precision of the assessed RFD superimposition found in this study, there are three important circumstances to note:
First, there has to be at least some structure that in fact is unchanged. Since differences correl-ate with time, it is important to keep the interval between the two registrations short enough. In adolescents, an interval of one to two years is ap-propriate.
Second, one basic assumption in the workflow of this technique is that the area surrounding the median point of the third rugae is some-how stable.10,18 Use of this area during the
raw-matching is therefore crucial. Impression or scan-ning errors could give an inaccurate 3D model. Local swelling of the gingiva after treatment with, for example, a Nance-appliance or palatal min-iscrews could generate an inaccurate 3D model. Therefore, areas that obviously have been changed need to be cropped before the superimposition process is started.
Third, sometimes growth or treatments like rapid maxillary expansion follow an asymmetric pattern. This asymmetry needs to be taken into account when corresponding points are picked dur-ing the raw-matchdur-ing. Thus, for raw-matchdur-ing one would only use the median point of the third ruga on the non-effected side.
It is important that this technique has to be used under the conditions discussed above. The algorithm will always process the models that are put in. If there is an asymmetry or other abnormal growth pattern that is visible to the naked eye, one has to check whether the result of the superimpos-ition is feasible or reasonable. The morphological changes caused by growth and treatment are very complex. Therefore, this technique is far from a one-click-solution and it is performed in specialised 3D software.
Consequently, for correct RFD superimposition it can be advisable to involve serial models taken with a moderate interval (1 to 2 years), to re-move obvious changed areas in the palate, and to consider clinical information about asymmetric treatment effects.
We believe that deformation analysis will be a key-element in future superimposition-techniques. There may be several algorithms that could do the trick. However, these algorithms will probably be more complex than a simple best-fit method.
Conclusions
The novel RFD-Superimposition method is a valid and reliable tool for measuring tooth movements in the maxilla. This method can tolerate morpho-logical changes in the palate and gives excellent precision and accuracy. In addition, this method is robust for variances in the local point resolution and may also be used in growing subjects who undergo orthodontic treatment.
Acknowledgements
The authors gratefully acknowledge the senior consulting orthodontists Lena Zettergren Wijk (LZW) and Anke Krämer (AK) for their help with the measurements and computer engineers Daniel Krueger and Lothar Paul for the great support when developing the method of measurements.
All authors have completed the ICMJE Con-flict of Interest Disclosure form and declare the following: Niels Ganzer reports grants and nonfin-ancial support from the Centre for Research and Development, Uppsala University/Region Gävle-borg, Sweden, and grants from the Swedish Dental Associations Scientific Funds during the conduct of the study.
Ingalill Feldmann reports grants from the Thuréus Foundation for the Promotion of Dental Science, Uppsala University, Sweden, during the conduct of the study.
The funding sources had no influence on study design, collection, analysis, or interpretation of the data, writing the article, or in the decision to submit the article for publication. There are no financial relationships with any organizations that might have interests in the submitted work in the previous three years. There are no other re-lationships or activities that could appear to have influenced the submitted work.
References
1. Ricketts RM. A four-step method to distin-guish orthodontic changes from natural growth. J Clin Orthod. 1975;9(4):28.
2. Pancherz H. The mechanism of Class II cor-rection in Herbst appliance treatment. A ceph-alometric investigation. American J Orthod. 1982;82(2):104–113.
3. Hoggan BR, Sadowsky C. The use of palatal rugae for the assessment of anteroposterior tooth movements. Am J Orthod Dentofacial Orthop. 2001;119(5):482–488.
4. Reuschl RP, Heuer W, Stiesch M, Wenzel D, Dittmer MP. Reliability and validity of meas-urements on digital study models and plaster models. Eur J Orthod. 2016;38(1):22–26. 5. Wiranto MG, Engelbrecht WP, Nolthenius
HET, van der Meer WJ, Ren Y. Validity, reliability, and reproducibility of linear meas-urements on digital models obtained from in-traoral and cone-beam computed tomography scans of alginate impressions. Am J Orthod Dentofacial Orthop. 2013;143(1):140–147. 6. Akyalcin S, Dyer DJ, English JD, Sar C.
Com-parison of 3-dimensional dental models from different sources: diagnostic accuracy and sur-face registration analysis. Am J Orthod Dento-facial Orthop. 2013;144(6):831–837.
7. Bootvong K, Liu Z, McGrath C, Hagg U, Wong RW, Bendeus M, et al. Virtual model analysis as an alternative approach to plaster model analysis: reliability and validity. Eur J Orthod. 2010;32(5):589–595.
8. Grewal B, Lee RT, Zou L, Johal A. Royal London space analysis: plaster versus digital model assessment. Eur J Orthod. 2016;. 9. Aragon ML, Pontes LF, Bichara LM,
Flores-Mir C, Normando D. Validity and reliability of intraoral scanners compared to conventional gypsum models measurements: a systematic review. Eur J Orthod. 2016;38(4):429–434. 10. Bailey LT, Esmailnejad A, Almeida MA.
Stability of the palatal rugae as landmarks for analysis of dental casts in extraction and nonextraction cases. Angle Orthod. 1996;66(1):73–78.
11. Diez Y, Ferran R, Llado X, Salvi J. A Qualitative Review on 3D Coarse Registra-tion Methods. ACM Computing Surveys. 2015;47(3):45:1–45:36.
12. Choi DS, Jeong YM, Jang I, Jost-Brinkmann PG, Cha BK. Accuracy and reliabil-ity of palatal superimposition of three-dimensional digital models. Angle Orthod. 2010;80(4):497–503.
13. Chen G, Chen S, Zhang XY, Jiang RP, Liu Y, Shi FH, et al. Stable region for maxillary dental cast superimposition in adults, stud-ied with the aid of stable miniscrews. Orthod Craniofac Res. 2011;14(2):70–79.
14. Thiruvenkatachari B, Al-Abdallah M, Akram NC, Sandler J, O’Brien K. Measuring dimensional tooth movement with a 3-dimensional surface laser scanner. Am J Or-thod Dentofacial Orthop. 2009;135(4):480–485. 15. Cha BK, Lee JY, Jost-Brinkmann PG, Yoshida
N. Analysis of tooth movement in ex-traction cases using three-dimensional re-verse engineering technology. Eur J Orthod. 2007;29(4):325–331.
16. Pomerleau F, Colas F, Siegwart R, Magnenat S. Comparing ICP variants on real-world data sets. Autonomous Robots. 2013;34:133–148. 17. Christou P, Kiliaridis S. Vertical
growth-related changes in the positions of palatal rugae and maxillary incisors. Am J Orthod Dentofa-cial Orthop. 2008;133(1):81–86.
18. Choi JI, Cha BK, Jost-Brinkmann PG, Choi DS, Jang IS. Validity of palatal superimposi-tion of 3-dimensional digital models in cases treated with rapid maxillary expansion and maxillary protraction headgear. Korean J Or-thod. 2012;42(5):235–241.
19. Thilander B. Dentoalveolar development in subjects with normal occlusion. A longitudinal study between the ages of 5 and 31 years. Eur J Orthod. 2009;31(2):109–120.
20. Yang ST, Kim HK, Lim YS, Chang MS, Lee SP, Park YS. A three dimensional observation of palatal vault growth in children using mixed effect analysis: a 9 year longitudinal study. Eur J Orthod. 2013;35(6):832–840.
21. Team RC. Team RC, editor. R: A Language and Environment for Statistical Computing. Vienna, Austria: R Foundation for Statist-ical Computing; 2018. Available at: www.R-project.org.
22. Rathbone A, Shaw S, Kumbhare D. Rathbone A, editor. ICC.Sample.Size: Calculation of Sample Size and Power for ICC. R
package version 1.0. https://CRAN.R-project.org/package=ICC.Sample.Size. CRAN; 2015. Available from: https://CRAN. R-project.org/package=ICC.Sample.Size. 23. Feldmann I, Bondemark L. Anchorage
capa-city of osseointegrated and conventional an-chorage systems: A randomized controlled trial. Am J Orthod Dentofacial Orthop. 2008;133(3):339.e28.
24. Sousa MV, Vasconcelos EC, Janson G, Garib D, Pinzan A. Accuracy and reproducibil-ity of 3-dimensional digital model measure-ments. Am J Orthod Dentofacial Orthop. 2012;142(2):269–273.
25. Hayashi K, Sachdeva AU, Saitoh S, Lee SP, Kubota T, Mizoguchi I. Assessment of the accuracy and reliability of new 3-dimensional scanning devices. Am J Orthod Dentofacial Orthop. 2013;144(4):619–625.
26. Wujanz D, Krueger D, Neitzel F. Identification of Stable Areas in Unreferenced Laser Scans for Deformation Measurement. The Photo-grammetric Record. 2016;31.
27. Avian M, Wujanz D. Movement of Hinteres Langtalkar rock glacier 2009 - 2013 by us-ing the ICProx-algorithm at very high resolu-tion point clouds from terrestrial laserscan-ning. In: EGU General Assembly Confer-ence Abstracts. vol. 16 of EGU General As-sembly Conference Abstracts; 2014. p. 12152. Provided by the SAO/NASA Astrophysics Data System. Available from: http://adsabs. harvard.edu/abs/2014EGUGA..1612152A. 28. Sjögren AP, Lindgren JE, Huggare JA.
Or-thodontic study cast analysis–reproducibility of recordings and agreement between conven-tional and 3D virtual measurements. J Digit Imaging. 2010;23(4):482–492.
29. Asquith J, Gillgrass T, Mossey P. Three-dimensional imaging of orthodontic models: a pilot study. Eur J Orthod. 2007;29(5):517–522. 30. Nalcaci R, Kocoglu-Altan AB, Bicakci AA, Ozturk F, Babacan H. A reliable method for evaluating upper molar distalization: Super-imposition of three-dimensional digital models. Korean J Orthod. 2015;45(2):82–88.