PAPER WITHIN: Production Systems, Production Development & Management
AUTHOR: Raghunandan Bangalore Rajanna & Harvind Prasad Nallaye Karthikeyan
JÖNKÖPING:November 2020
Value Stream Analysis of
Online Deliveries at
Ecommerce Department in a
Logistic Company
This exam work has been carried out at the School of Engineering in Jönköping in the subject area Production system with a specialization in production development and management. The work is a part of the Master of Science program. The authors take full responsibility for opinions, conclusions and findings presented.
Examiner: Kerstin Johansen Supervisor: Denis A. Coelho Scope: 30 credits (second cycle)
Date: 2020-11-01
Postal address: Visiting address: Phone:
Box 1026 Gjuterigatan 5 036-10 10 00
Acknowledgement
This master thesis is a case study for analysing the current value stream map at the case company. We have received a lot of support and guidance throughout the whole thesis, without which the output of this thesis wouldn’t been possible. We want to express our sincere gratitude towards our supervisor Denis A. Coelho at Jönköping University who gave us valuable feedback and support on every stage of our thesis work. His insightful comments and suggestions helped us to carry out our work in a proper way and to achieve our desired goal. Special gratitude to our company supervisor Thomas Arnesson, Logistics Development and Controlling Manager of case company for providing us valuable advice and all the necessary information and data of the company needed for the thesis. We would also like to extend our gratitude to Alex Karyakous, Online Department Manager. He has constantly helped us in understanding the com-plete process in the production line of the company and supported us with all the nec-essary data. We convey our gratitude and appreciation to other employees and staff of company for their support and cooperation during the whole period. This thesis is a work of our collective efforts. Lastly, we would like to thank our family and friends for their continuous support and motivation.
Jönköping, November 2020
Abstract
Lean production is one of the proven approaches for identifying and eliminating the activities that do not add value to the customers and delivering and provide the best possible quality service to customers. Implementation of lean is deemed to be feasible in any organization regardless of its size or industry background. For initiating lean in an organization there are many tools, techniques and approaches that are available. Value Stream Mapping (VSM) is one such tool that is touted as cost-effective and easy to be implemented. This thesis proposes to conduct Value Stream Analysis (VSA) at at e-commerce (online) department at the case company to understand their material and information flows by analyzing the current state and develop implementable solutions to improve the overall productivity of the online deliveries. The tasks to perform are: • To map the current state value stream.
• To identify wastages and propose solutions to eliminate them. • To provide productivity improvement proposals.
A mix of quantitative and qualitative methods were used in this study for data collection and data analysis. This project, which is designed as a longitudinal case study that pri-marily focuses on gathering accurate, real-time data related to the product family, and on drawing a visual representation of the current materials and information flow. VSM has been implemented and the data were analysed. The results obtained from this study concludes that, VSM is an appropriate technique to initiate lean ways of work in larger firms that lacks sufficient knowledge and experience on lean. In addition to it, produc-tivity improvement proposals provided in this study are considered to be key factors in initiating lean transformation in an organization from a technical point of view while, management support and acceptance of change is necessary from an organizational point of view. This thesis will be useful to researchers, professionals and others con-cerned subject to understand the significance of value stream mapping in larger e-com-merce logistic firms.
Keywords
Lean Production, Value Stream Mapping, Value stream analysis, Material and Infor-mation Flow, Cycle Time, Lead Time
Table of Contents
1 Introduction ... 1
1.1 BACKGROUND ... 1
1.2 PROBLEM STATEMENT ... 2
1.3 RESEARCH GAP ... 2
1.4 PURPOSE AND RESEARCH QUESTIONS ... 2
1.5 THE SCOPE AND DELIMITATIONS ... 3
1.6 STRUCTURE OF THE THESIS... 3
2 Theoretical background ... 5
2.1 TOYOTA PRODUCTION SYSTEM ... 5
2.2 LEAN CONCEPT ... 10
2.2.1 WHY LEAN? ... 12
2.3 VALUE STREAM MAPPING... 14
2.3.1 WHY VALUE STREAM MAPPING? ... 16
2.4 5S METHOD ... 17 2.5 CONTINUOUS IMPROVEMENTS ... 19 2.6 JUST IN TIME ... 20 2.7 REMOVAL OF WASTE ... 21 2.8 VISUAL MANAGEMENT ... 23 2.9 STANDARDIZATION ... 23
2.10 ONLINE ORDERING AND DELIVERY SYSTEM: ... 24
2.11 ORDER PICKING ... 25
2.12 ZONING ... 25
2.13 WAREHOUSE MANAGEMENT AND UTILIZATION OF SPACE ... 26
2.15 IMPLEMENTATION OF LEAN TOOL IN AN ORGANIZATION ... 28
3 Methodology ... 30
3.1 RESEARCH METHOD ... 30 3.1.1 Quantitative Methods ... 31 3.1.2 Qualitative Methods ... 31 3.1.3 Mixed Method ... 31 3.2 RESEARCH APPROACH ... 32 3.2.1 Inductive Approach ... 32 3.2.2 Deductive Approach ... 33 3.2.3 Abductive Approach ... 33 3.3 RESEARCH DESIGN ... 343.4 DATA IDENTIFICATION AND COLLECTION ... 34
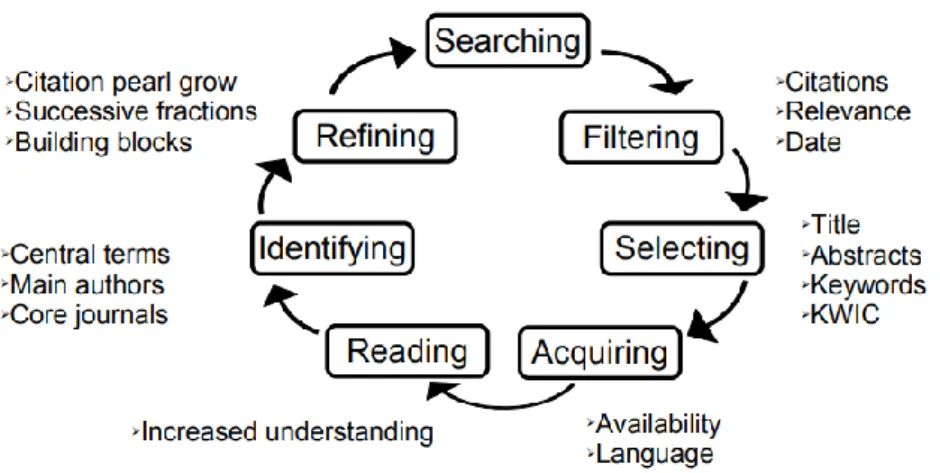
3.4.1 Literature Review ... 34
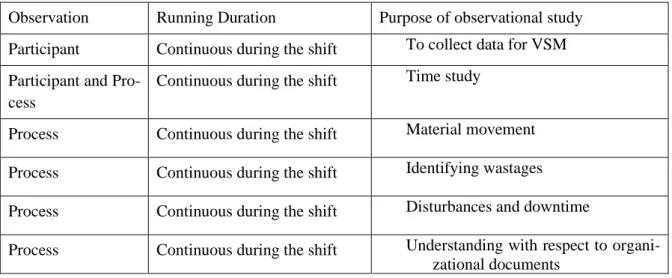
3.4.2 Observations ... 36
3.4.3 Time Studies: ... 38
3.4.4 Organizational Documents ... 38
3.4.5 Interviews ... 38
3.4.6 Other Information Gathering ... 40
4 Findings and Data Analysis ... 41
4.1 CURRENT STATE ANALYSIS ... 41
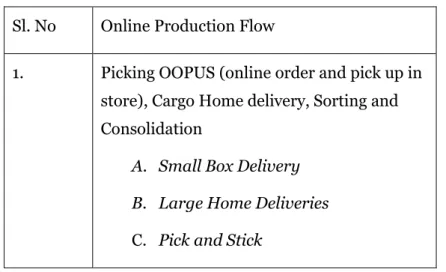
4.1.1 Production Flows of Online Deliveries ... 41
4.1.2 Production Layout ... 42
4.1.3 Picking Areas ... 43
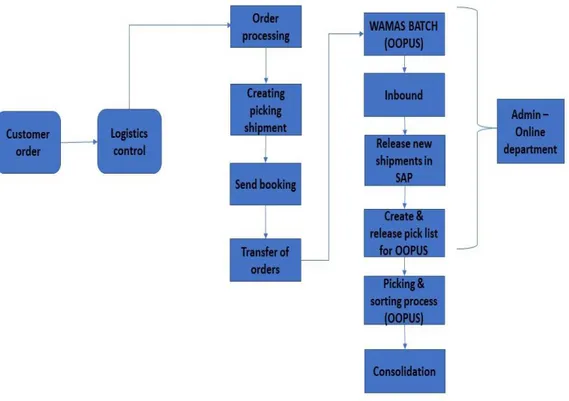
4.1.4 Online Deliveries Process flow description: ... 44
4.1.5 Online Deliveries picking flow: ... 45
4.1.6 Small Box Delivery: (Manual picking 103) ... 47
4.1.7 Large Home Deliveries: (Manual picking 101&104) ... 48
4.1.8 Pick and Stick: (Area 007) ... 49
4.1.9 Time Study ... 51
5.1 VALUE STREAM MAPPING ... 54
5.2 IDENTIFICATION OF WASTE THROUGH VSM ... 56
5.3 CATEGORIZATION OF THE IDENTIFIED WASTAGES: ... 57
6 Improvements and suggestions ... 61
6.1 ELIMINATING WASTAGES ... 61
6.2 PRODUCTIVITY IMPROVEMENT PROPOSALS ... 65
6.2.1 Technical point of view ... 65
6.2.2 Organizational Point of View ... 67
7
Discussions and Conclusions ... 69
7.1 DISCUSSION OF METHOD ... 69
7.1.1 Validity ... 69
7.1.2 Reliability ... 70
7.1.3 Credibility conclusion ... 70
7.2 DISCUSSION ON RESEARCH QUESTION ... 70
7.3 CONCLUSION ... 72
7.4 FURTHER RESEARCH ... 73
8.
References ... 74
9.
APPENDIX ... 81
APPENDIX 1: INTERVIEW GUIDE... 81
APPENDIX 2: VSM SYMBOLS ... 82
APPENDIX 3 : ONLINE FLOW WORKING PROCESS MANUALS ... 85
APPENDIX 4:TIME STUDY GRAPHS ... 88
APPENDIX 5 : VALUE-STREAM REVIEW TEMPLATE ... 91
List of Figures
Figure 1 - Lean House Liker (2009) ... 8
Figure 2 - The 4p model Liker (2009) ... 10
Figure 3 - Benefits of "Lean" (Source – Authors own) ... 13
Figure 4 - 5S method implementation (Source - authors own) ... 18
Figure 5 - Data collection (Source: Authors Own) ... 30
Figure 6 - Hermeneutic Circle of Reviewing Literature (Boell & Cezec-Kecmanovic , 2010) ... 36
Figure 7 - Online delivery-process flow (source - authors own) ... 45
Figure 8 - Online picking flow (source - authors own) ... 46
Figure 9 - Small box picking process in floor 2 (source - authors own) ... 47
Figure 10 - Larger home delivery process flow (101&104) in floor 1 & 2 ... 48
Figure 11 - User interface for picking and stick (source - authors own) ... 50
Figure 12 - Stick & sort process at floor 1 (source - authors own) ... 50
Figure 13 - Value stream mapping (Source: Authors own) ... 55
Figure 14 - Business process (source: authors own) ... 56
List of Tables
Table 1 Purpose of observations (Source - authors own) ... 37
Table 2- Interview list ... 39
Table 3 Production flow of online deliveries ... 42
Table 4 Working areas and process ... 44
Table 5 Activities and their description ... 47
Table 6 Activities performed and their description ... 49
Table 7 Activities and their description ... 51
Table 8 Template of value stream review (Rother & Shook, 2009) ... 91
Abbreviations
VSM Value Stream Mapping VSA Value Stream Analysis CMS Current State Mapping FMS Future State Mapping FIFO First in - First Out JIT Just in Time CT Cycle Time
MRP Manufacturing Resource Planning ERP Enterprise Resource Planning NNVA Necessary Non-Value Added NVA Non-Value Added
VA Value Added
SMED Single Minute Exchange of Dies TPS Toyota Production Systems WIP Work In progress
Explanation of Terms
Value Stream A value stream is a flow of raw materials into the hands of the customers which includes all actions, infor-mation and material flow.
Value Stream Mapping A lean tool that streamlines flows in production sys-tems and works with continuous improvements. Continuous Flow Multiple processes being connected without any
stag-nation.
Current State Current value stream
Lead Time Total necessary time required by the product to go through a collection of processes. Involves inventory, assembly, waiting times, etc.
Cycle Time (C/T) The time taken between one part coming off a process to another part coming off.
Flow Represents a constant motion.
Jidoka To make sure everything is done right from the begin-ning and to stop the process if anything goes wrong.
JIT Just in Time - To ensure the right product is produced
in the right quantity at the right time.
Kaizen ‘Kai’ meaning way and ‘zen’ meaning good, together
accounts for continuous improvement process.
Muda A non-value-added activity, essentially a waste.
Non-value-added activity An activity that utilizes resources but does not create any value for the customer.
Value-added time Time utilized by the work elements which transform the product in a way customer is willing to pay for.
1 Introduction
This chapter provides a background for the study and the problem area the study is built upon. Further, the problem statement and the research questions are presented. The scope and delimitations of the study are also described. Lastly, the disposition of the thesis is outlined.
1.1 Background
Lean manufacturing can be used for maximizing productivity and resource utilization by reducing waste. It is all about eliminating activities that do not add any value to the end product and focus on delivering the best possible qualitative product to the cus-tomer as quickly as possible and finally having the least barriers in the system as pos-sible (Womack & Jones, 2005). The rapid change in the global market has made many companies think about reducing the complexity of processes. Lead time reduction plays an important part in an organization which is aiming to intensify its productivity, effi-ciency, customer responsiveness and improve their production performance. A com-mon applied philosophy in order to improve production performance is called “lean thinking”. This philosophy is derived from the Toyota Production System (TPS) which seeks minimizing non-value added and wasteful activities, maximizing customer value and competitive strength of the organization. (Ohno , 1988)
This report is based on the e-commerce department at the thesis host company. Where the increasingly competitive environment in e-commerce and online sales was felt, to-gether with increasing demands in terms of lead times and delivery service, moreover in the current way of working it seemed difficult and challenging to make smart im-provements to meet customer expectations. Although there are various lean tools avail-able, it is necessary to implement these tools in a systematic way depending upon the context of the problem. Selecting the right method, technique, and tool is very important in understanding the problem and enhancing production performance of the organiza-tion. A methodological framework was developed for reducing lead time, improving the efficiency and effectiveness of online deliveries using VSM. (Bhasin & Burcher, 2005)
1.2 Problem Statement
Increased online sales together with increasing demands in terms of lead times and de-livery services had made the current way of working of online department (ecommerce) challenging. In recent times the company’s online customers had increased exponen-tially. The high speed of increasing volumes had put pressure on fast process improve-ments in order to reach efficiency and to meet productivity targets. Their targets were always set higher than the previous year to keep up with delivery of much higher vol-umes and simultaneously moving ahead quickly with long-term process improvements had been challenging. Along this process, finding smart improvements to meet cus-tomer expectations had also become challenging.
1.3 Research Gap
Based on the current industrial needs, it has been found that there has been less concrete research reported on the integration of VSM framework within e-commerce logistics. pecific studies that illustrate the scope of lean principles for ensuring sustainable and productive material-information flows within e-commerce logistic industries is to be justified. The application of VSM as a tool for identifying the improvement proposals in logistic industries towards enabling leanness forms the scope of this research study. 1.4 Purpose and Research questions
The purpose of this study is to conduct value stream analysis in the online delivery flow (from customer order to dispatch of order at distribution centre) in order to reduce the lead times in online order deliveries, while also giving further smart improvement sug-gestions towards increased productivity. To be able to fulfil the purpose, the research question has been framed in the form of two questions. Hence, the study’s research questions are:
1. How can Value Stream Analysis be used/ applied in searching for wastes in the process flow of online deliveries?
2. What can be done to reduce or eliminate the wastes to improve the overall productivity of the online deliveries?
To answer the questions and thereby to fulfil the purpose, a case study was conducted at the case company.
1.5 The scope and delimitations
The goal of implementing value stream mapping, is to optimize online order delivery flow, and identify ways to reduce the lead time and improve productivity by accom-plishing the following objectives, to identify and eliminate non-value-added activities and reduce wasteful operations, i.e. transportation, unnecessary movements or motion, over-processing, idle time, etc; And also, to develop implementable solutions to im-prove the overall productivity of the online deliveries (e.g. by decreasing material han-dling activities, or by simplifying and standardizing working methods).
This thesis is focusing on a focal company, outcome of answering research questions as well as the conclusions of this thesis would be generalizable to some extent.
The thesis focusses on analysing only the present/current state at case company. Devel-oping a future state is not a part of the thesis description provided by the case company and also due to the constrained time frame. Owing to ethical obligations, confidential-ity, and security of information, not all means of information could be disclosed. Apart from online flows the report does not involve any other physical process which is car-ried out in the case company. The work focuses on material and information flow for activities that are a part of only online order and pick up in store (OOPUS) and not any other cargo deliveries. In VSM analysis, the time studies for the activities involving inbounding and refill of products at the online department have not been considered. Among several data-driven tools, this study majorly focuses on lean tool Value Stream mapping because of the benefits it provides in identifying and eliminating wastes and maintaining an effective material and information flow. Furthermore, this study is made on a single case study. The names and other details of the interviewees were not re-vealed in order to make the interviewee feel comfortable and avoid biasing. The lan-guage was also an issue during our walkthrough interviews and observational study as employees were not comfortable in speaking English.
1.6 Structure of the thesis
This study is majorly divided into 7 sections where the first sections represents the background of the study and problematization, and also defines the research gap and the research question and how it was developed. The next section 2 consists of existing theories and concepts that were reviewed through considering the various bodies of literature in the related field of study. Section 3 is a methodology that explains how this
research is conducted by describing the research method, strategy, design and the ap-proach used. The next section 4 discusses the finding and the data analysis conducted for this study. Section 5 explains how Value stream mapping was conducted to identify the wastages. Section 6 describes the suggestions and improvements that the authors of this study have developed and also involves productivity improvement proposals. In the last section 7, the authors conclude their study by discussing the conclusion and future scope.
2 Theoretical background
This chapter presents the theory and principle on which the study is based. Focusing lean manufacturing, the origin and history of lean is explained and background infor-mation about the principle is presented. This is followed by classifying the value stream mapping technique. This chapter also includes perspective and reflection towards the theory of lean and value stream mapping.
2.1 Toyota Production System
The Toyota production system is followed by many manufacturing companies and its aim is focused on eliminating waste and non-value-added steps in the production pro-cess which was founded at the end of the second world war by Toyoda Kiichiro, presi-dent of Toyoda motor company. It was essential for the Japanese industries to put forth their best efforts in order to produce better quality goods having higher added value even during lower production compared to other countries. Toyota motor corporation adapted this idea, when they needed to produce different cars models and trucks with very short lead time, so the company needed to produce the right cars when needed and deliver them to customers. (Seth & Gupta, 2005)
To improve the process flow, (Ohno , 1988) suggested arranging the machines accord-ing to the flow instead of puttaccord-ing machines of one process together, this change avoided the process of carrying parts back and forth between processes. Here just in time the process is followed, in order to have a balanced inventory and required amount of equipment and workers.
Toyota’s production system is based on 14 principles which is distinguished into four main categories namely, philosophy, process, employees and partners, problem solving (Bhasin & Burcher, 2005).
1. Long-term philosophy
The company must always stay true to the long-term philosophy based on which the decisions are made even if it might have a negative impact on the business in the future. Everyone in the company must work towards a common goal and develop by making the right decision in terms of employee, company, and its customers. (Bhasin & Burcher, 2005)
2. Continuous process flow
The processes must be arranged in a way to obtain the highest quality and productivity with the shortest possible delivery time and lowest cost. Nonvalue added activities and services must be eliminated to the maximum extent possible. Having good communi-cation between people and processes is essential to detect and eliminate defects. (Bhasin & Burcher, 2005)
3. Avoid overproduction
To avoid overproduction, it is important to follow the pull system where based on the customer demand you control the production and eliminate unnecessary inventories. A “pull” system is achieved when Just-in-time is implemented to avoid overproduction. (Bhasin & Burcher, 2005)
4. Equalize workload – Heijunka
The workload between employees should be distributed evenly. Heijunka comes from Japanese language and the core idea of it is about creating a uniform product sequence. Variation can be reduced by dividing production by volume and by production mix. It is always better to build stock of finished products and not to produce according to the customer’s demands as it varies greatly. (Bhasin & Burcher, 2005)
5. Integrate quality
To prevent inaccuracies assurance methods can be used to integrate quality with the product. Jidoka, a Japanese word is about using human intelligence in combination with equipment. With this the system can notify if something is wrong and prevents prob-lems in the later steps which in turn reduces unnecessary reworks. Important to under-stand the philosophy of stopping to fix the problems to get the quality right at the first time. (Bhasin & Burcher, 2005)
6. Continuous improvement and employee engagement
Through standardized work and right information availability high production effi-ciency with high quality can be achieved. It is important for employees to have the right to have individual opinions and to share them. Improvement suggestions from the em-ployees are to be encouraged and if suitable can be implemented and standardized. (Bhasin & Burcher, 2005)
7. Visualization
A structured work environment with clear visual descriptions using symbols, writings, markings on the floors or signal benefits a standardized way of working. The visuals should be easy and clear to be understood by the employee. (Bhasin & Burcher, 2005)
8. Technology
An organisation must have continuous, advanced, latest technology adaptation, new technologies contribute to greater improvements and should be encouraged but to be considered with caution. The technology must be tried and tested properly before im-plementing it. The aim is to make use of technology as a tool to facilitate employees’ work. (Bhasin & Burcher, 2005)
9. Leaders
The task of a leader is just not to perform tasks or distribute them. A leader characterizes the companies' philosophy and is a role model for the employees. (Bhasin & Burcher, 2005)
10. Teamworking
It is important to encourage employees to collaborate and achieve the improvement by solving problems together. Working together towards a common goal will create a sta-ble culture with clear vision, values to aim and strive for in the future. (Bhasin & Burcher, 2005)
11. Partners and suppliers
Sharing knowledge and developing each other must be practiced. Guiding subcontrac-tors to reach their goals and to challenge them to develop. (Bhasin & Burcher, 2005)
12. Question problems
Create a full knowledge and understanding of a problem-situation by questioning it. Questions and queries should be encouraged no matter what position that you are work-ing in. The defects or problems that have developed can be understood from the pro-duction back to the purchasing stage by questioning and examining. Think and speak based upon personally verified data. (Bhasin & Burcher, 2005)
13. Make decisions
It is important to consider various parameters and alternatives before deciding. It should be reviewed thoroughly before considering the decision. An individual who will be in-fluenced by the decision must be allowed to participate in the decision-making events. (Bhasin & Burcher, 2005)
14. Continuous improvements - Kaizen
No organization is perfect and there is always room to get better. Continuous improve-ment efforts are small steps taken to be better than the previous day. There must be relentless reflection and continuous improvement in a learning organization. (Bhasin & Burcher, 2005)
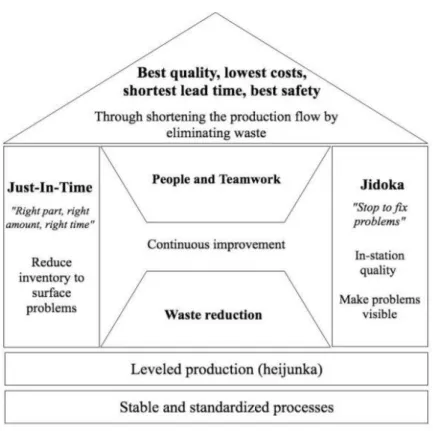
Figure 1 - Lean House Liker (2009)
As shown in Figure 1 – Lean House, the guidelines and principles of TPS represent how an organisation should be according to Toyota’s values. Striving for a common goal including all the levels of the organisation is the basic foundation for prosperity. The Toyota Production System is usually illustrated in a house model where the prin-ciples, methods, tools and systems are integrated. The TPS house is a framework that
is structured where every part of the house e.g., ground, pillar, roof are the essential parts for an organisation that act together as a whole. (Liker, et al., 2009)
The TPS system relies if the elimination of waste, different preliminary steps are iden-tified (Liker, et al., 2009)
• Waste of overproduction • Waste due to waiting time • Unnecessary transportation • Unnecessary process • Waste due to inventory
• Waste due to defective products.
Ohno explains that operation efficiency can be improved by eliminating the different kinds of wastes and TPS achieved this by providing the exact needs which is wanted during the process (i.e., manpower, raw materials, tools etc.) thereby Toyota provided only the required quantity of employees needed for the process to achieve efficiency and the other workers are use else were until they are needed. Secondly, TPS used is by standardizing the methods for the different procedures in the plant and they are done from the shop floor. There by calculating the cycle time for a process, work sequence (constant order is followed to complete a process) and standard inventory (minimum number of work-in-progress). This worksheet gives a clear picture of WIP and helps in identifying the areas needed to be improved. Finally, Ohno created the mental team-work, where the workers help each other (i.e., a worker of one station helps the other, if he/she delays the process) to prevent waiting time in between the processes. (Ohno , 1988)
(Haung & Liu, 2005) closed with the proof of early consequences of the program, just as various key learning focuses for different associations wishing to follow a compara-tive way. They have applied the seven VSM devices for squander end in Toyota Pro-duction System (TPS). In addition, they have likewise utilized Value Stream Analysis Tool (VALSAT) for empowering the choice of successful VSM instruments. They have applied VSM for the improvement of a provider organizes around a conspicuous mer-chant of electronic, electrical and mechanical parts by given a guide with regards to how VSM can give fundamental data to the investigation of hardware substitution choice issues experienced in lean manufacturing usage. (Haung & Liu, 2005)
2.2 Lean concept
Lean thinking is a well-known term that refers to the lean production approach whose pioneer is Toyota. Due to the growth of global competition, especially in the last dec-ade, manufacturing countries are adopting a new management approach to stay com-petitive in the global market (Ohno , 1988). The concept of lean is a well-renowned management approach which has become popular, due to its positive effect on imple-mentation and its results (Melton, 2005).
The idea of lean originated in Japan after the second world war, when Japan found out that they can’t find the huge investments required to build facilities equal to the USA. As a result, they selected the idea of lean to reach notable heights in production. The beginning of lean concept eventually induced removal of waste by reducing the buffer time in the production line which results in reducing the cost. (Bamber & Dale, 2000)
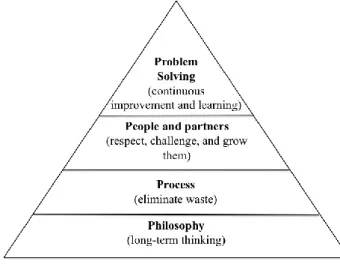
Figure 2 - The 4p model Liker (2009)
According to Liker (2009) lean is defined as “a five-step process that includes defining customer value, defining the value stream, creating “flow”, “pulling” from customers and striving for excellence”. He says that lean is not just a tool which can be imple-mented but it is also a long-term philosophy that is a foundation of the Toyota Produc-tion System (TPS) which includes 14 principles that are subdivided into 4 categories namely people, process, philosophy and problem solving as shown in Figure 2. The lean concept leads the company to re-think their current way of working to a new and more effective way of working which decrease the cost and improve the quality and simultaneously superseding the scope of the item at a diminished time (Ohno , 1988). Lean manufacturing worldview is centred on annihilating NVA activities and tries to
reduce the manufacturing space, a smaller number of laborers, less stock and less NVA time (Shah & Ward, 2007).
In the lean concept, by using the term “Pull” which drives replenishment, removes bot-tle necks throughout the supply chain, eliminates waste effort, waste time and waste monitoring, which all contributes to the direct improvement of the process in the indus-try. By implementing lean manufacturing in a company, it reduces the waste in the human effort and inventory (Melton, 2005). The lean manufacturing technique implies diminishing the deformity, yet additionally lessening the expense of production (Bhasin & Burcher, 2005).
The Small and medium enterprise (SME) is utilized to construct the estimation and basic models, as there are different lean manufacturing devices, for example, 5s, kaizen procedure and VSM that are followed to decrease the wastage. Lean manufacturing objectives are zero breakdowns, zero postponements, zero deformities, zero invento-ries, zero mishaps and zero paper. The TPS was first presented in the time of 1977. (Ohno , 1988)
As the lean approach centres around the elimination of waste, takes place in many forms and it is found at any time and in any place, it might be found hidden in policies, pro-cedures, process and product designs and in operations. Waste consumes resources but does not add any value to the product (Melton, 2005). (Russell & Taylor, 1999: p. 19) defines waste as “anything other than the minimum amount of equipment, effort, mate-rials, parts, space and time that are essential to add value to the product” other than the mentioned terms all others are considered to be waste from a company point of view. The customer's satisfaction is increased by meeting their demands, by eliminating the waste in the value creation process it reduces the cycle time of a process. (Bamber & Dale, 2000)
The waste is a time-consuming activity within a process that neither creates value for the customer nor serves a critical business function for the supplier. Value, meanwhile, can be defined “as an activity that the consumer pays for willingly because it seems to be truly necessary to solve the problem” (Womack & Jones, 2005: p. 25). By adapting the lean principle, suppliers strive to meet the customer demands by following five steps to achieve lean concept (Womack & Jones, 1997).
1. (Womack & Jones, 1997) Identified the value desired by customers. According to him today’s customers place the following demands on their suppliers:
• Solve customer’s problem completely – Retain the customer.
• Do not waste customers time, that is to minimize cost due to consumption – Increases the value to money, for which the customer pays.
• Provide exactly what the customer needs, eliminate unnecessary actions – Im-plementation of lean, to eliminate waste.
• Deliver value where customers want it – Increases customer satisfaction. • Supply value to customers, as they want it.
2. Identify the value stream for different processes and eliminate the steps that do not create value. The VSM is used to map, both current- and future-state mapping. It illus-trates how a process can be redesigned to yield greater efficiencies. (Womack & Jones, 1997)
3. Line up the remaining steps in a continuous flow, thereby eliminating waiting and inventory costs. A future-state map is “better” than the current-state map if lean provi-sion in the future state generates a solution that more closely matches the customer’s preferences for timing and quantity. When there is a mismatch between the pace and volume of the provision and consumption process, waiting and inventory costs are gen-erated. (Womack & Jones, 1997)
4. Transition from a sales philosophy that relies primarily on the push method of selling, an approach that more effectively enables the customer to pull value from the firm. This may be the most revolutionary of all the lean concepts for sales and marketing. Instead of trying to convince customers to purchase something that has already been produced, this lean principle suggests that suppliers should strive to produce the quantity of a solution that is needed exactly for the customers when it is needed and not before. (Womack & Jones, 1997)
5. Repeat the above steps in continual pursuit of improvement continuously (Womack & Jones, 1997).
2.2.1 Why Lean?
As Lean production is now expanding in the field of supply chain it has been applied in all aspects to maximize the benefits of an organization (Melton, 2005). In all over the world lean manufacturing guideline are applied in 32% of the organizations and 68% of the organizations have not yet taken the lean reasoning (Adnan et al., 2013).
Customer demands are increasing rapidly in a globalized world where competitiveness is getting stronger. Due to this reason the customer demand has become a central issue for businesses that are running today. Customer demand has become so prominent in some business areas that the customers often dictate all the conditions, and the supplier follows and delivers them, so it is important to follow lean concept to obtain better results. (Melton, 2005)
Figure 3 - Benefits of "Lean" (Source – Authors own)
Figure 3 represents the various outcomes after successful implementation of lean in an organisation. According to (Pavnaskar & Gershenson, 2002), a successful work with lean positively affects a company's competitive parameters such as:
• Cost • Quality • Flexibility • Delivery time • Delivery dependability • Decrease in stress
• Safer working environment • Secured employment
• Improved communication with customers
• Lean also has positive effects in strengthening employee satisfaction and moti-vation. (Pavnaskar & Gershenson, 2002)
2.3 Value Stream Mapping
The value stream mapping is a lean tool used for measuring, evaluating and integrating activities in order to achieve a competitive advantage, this special tool identifies the nonessential activities that do not add value to the activity (Manos, 2006), VSM tool starts with the Current state mapping and applies the improvements in the future state (Abdulmalek & Rajgopal, 2007). VSM has been described as “one of the most powerful lean tools for an organization wanting to plan, implement and improve on its lean jour-ney” (Manos, 2006: p. 64) and is considered a critical step in the lean management process because it allows a company to document, measure, and analyse a complex set of relationships between activities, as well as plot a course to create an improved oper-ating strategy and organization design (Keyte & Locher, 2004). VSM tools were popu-larized by the concept was initially developed with two requirements: Firstly, to under-stand the interdependence of function and secondly to capture a holistic view about a situation where the conventional industrial engineering recording tools do not help much (Russell & Taylor, 1999).
The VSM is created in three stages, the initial step is plotting the present status map shows the current situation of processes. The second step involves distinguishing the underlying drivers of waste and its process upgrades by creating future state guides to accomplish a lean process stream. The third step is building up enhancements through usage plans and increased venture goals by Kaizen movement. As VSM is a part of lean when it is defined as “the endless transformation of waste into value from the cus-tomer’s perspective”. (Womack & Jones, 2003: p. 25)
According to (Singh & Sharma, 2009) the value stream mapping process begins within a product or service. Firstly, the current state is examined for identifying various waste and non-value-added activities, particularly activities which lead to overproduction and impede continuous flow. The future state of mapping is done to minimize waste and increase value to the process, further planning of action is carried out to implement the value stream depicted in the future state. By initiating the Value stream mapping tool, it is necessary to begin mapping the inter-company and intra-company and find the added value to the products or service under consideration. (Singh & Sharma, 2009) CSM (current state map) is a chart that is used to define the present flow of information and material as a product goes through the manufacturing process which is from first in to first out. This is vital to understand the need for change and to understand where the
opportunities are applicable to develop the process. A FSM (future state map) is a chart that suggests how to create a future lean flow (material and information flows). (Manos, 2006) It proposes to close the gap between the CSM and the future prediction (Womack & Jones, 1997). It uses lean manufacturing techniques to reduce or eliminate wastes and minimize non-value-added activities. The FSM is used to help make decisions that create future process improvements (Manos, 2006).
VSM is a lean tool that was developed by the lean production movement for redesigning production systems (Upadhye et al., 2010). According to (Upadhye, et al., 2010), there are basically five main steps namely:
• Define the value,
• Identify the value stream, • Flow of the product, • Pull system and
• Strive for perfection of the final product
These steps are imbedded in the concept of Value Stream Mapping and it is also iden-tified as an effective step in a model for implementing lean programs, which helps to identify flaws in the system that requires a redesigning and need to be prioritize for making immediate improvements. (Womack & Jones, 1997)
Defining the value: The first step in lean thinking is to determine the value, described by the customer. Value is the information or product that the customer is willing to pay for and can only be defined by the ultimate customer When customers no longer accept what they are given, producers tend to use techniques such as lowering pricing or of-fering a variation of the same products, in order to entice buyers to purchase their prod-uct. (Womack & Jones, 1997)
Identifying the value stream: A value stream needs to be identified and then combine all actions, which are undergone during the process and sort which are value-adding and as well as non-value adding actions. Identifying value streams helps to demonstrate how the process operates by explaining detailed timing taken for step-by-step activities involved. The systematic approach that empowers the company to plan and improve the process, it results in meeting the customer demands. (Hines & Rich, 1997)
Flow the product: Flow is a progressive achievement of tasks along the value stream, the process started from converting raw material to till it is delivered on hands of the
customer, where it undergoes different processes, from scrap to finished product. (Womack & Jones, 1997)
Pull system: Pull is a concept of letting the customers to pull the product rather than pushing products onto the customers. It means making what the customer needs and only when the customer wants it. The idea is, nothing is made until it is needed or ordered by the customer, and then made as quickly as possible once the order is made. A pull is created by having the ability to design, schedule, and make exactly what the customer desires when the customer wants it. The disadvantage of the pull system is that it is critical in fast moving consumer goods. (Hines & Rich, 1997)
Strive for perfection: There is no end to reduce costs, scrap, mistakes, space, etc. These terms are continuously focused to achieve perfection in a production process, it is an unachievable goal unless the organization aspires to continuously improve. Lean is al-ways working towards improvement and its application has yielded positive results in various sectors in all key performance areas of business. So, the companies are moving towards lean principles. (Bamber & Dale, 2000)
2.3.1 Why Value stream mapping?
Singh & Sharma (2009) stated that VSM is a pencil and paper tool, which is created using a predefined set of standardized icons. According to him, the three important steps in VSM are to choose the product family, draw the current state map and create the future state mapping, which is the picture of how the system should look and use VSM to categorize value added and non-value-added activities. VSM was applied as an ap-proach to the industry to identify and remove Non-value-added activities and various NVA activities present in the stream were identified. The authors have described the application of a new variant of process benchmarking called VSM to the development of a supplier network. (Singh & Sharma, 2009)
VSM was applied as a way to deal with the business to recognize and evacuate NVA exercises and different NVA exercises present in the stream were distinguished, also to eliminate different obstructions for efficiency improvement. The authors also portrayed a utilization of VSM, improved by recreation, to a devoted product offering in an archi-tect to-arrange movement control items manufacturing plant. They depicted the utiliza-tion of both present status and the future state for the product offering, just as the inves-tigation and results acquired from reproduction. (Dal Forno et al., 2014)
Sullivan (2002) have finished up with a conversation of future examination and appli-cations around there. They talked about the VSM utilized for tackling gear substitution choice issues. Specifically, they showed that VSM set-up of devices can be utilized to plan the present status of a production line and planned an ideal future state and delin-eated how VSM can give vital data to the investigation of hardware substitution choice issues experienced in lean manufacturing execution. They have depicted the utilization of another variation of process benchmarking called VSM to improve provider arrange-ment. This included mapping the exercises of the firm, distinguishing open doors for development and afterward attempted improvement programs. (Sullivan, et al., 2002) From the value stream map, different value-included exercises, non-value included ex-ercises and container necks are recognized and evaluated in time. (Mohanram, et al., 2012) It is discovered that there is a crisscross of cluster request timing and sizes of the group request is the significant issue and not adapt to the current degree of interest. It is seen that about 55% value added exercises contrasted with 45% non-value included exercises are available in the manufacturing framework. (Mohanram et al., 2012) Hence Value Stream Mapping tool is an ideal start to change a process towards creating lean enterprises as lean thinking is necessary to implement lean systems in an organi-zation. (Womack & Jones, 1997) The tool helps an organization to reduce lead times, inventory, improve quality and achieve better on-time deliveries and utilization of re-sources and contributes towards operation cost reduction, flexibility and ability to meet the customer demands (Upadhye et al., 2010). Reduction of non-productive activities (waste) eventually saves resources and allows reallocation of resources to improve throughput and profit of an organization. (Singh & Sharma, 2009)
2.4 5S Method
The 5S method was found in Japan, as this method a part of lean, which is used to optimize a process in an organization, it contributes a positive impact to improve qual-ity, safety and health at workplace, where this was found by Taiichi Ohno, who de-signed the Toyota production system. (Bednár, 2012) According to him a clean work environment, efficient and visual sign of dangers is a sheltered work environment. Dif-ferent lean instruments are utilized to decrease the wastage and cost. Whereas the 5s philosophy is followed in an industry to diminish the wastage. Different activities, for
example, the board, cooperation preparing, test research facility choice, control assign-ment, execution group foundation, usage arranging, dispatch meeting, 5s foundation, usage advancement, different labs advancement and persistent improvement have de-creased the expense. (Bednár, 2012)
The manufacturing business is distinguished and VSM is drawn. The squandered zone is recognized and 5 why strategy is actualized to know the explanation behind wastage. The process business is recognized and VSM is drawn. The lean devices 5s, JIT, kaizen and Kanban are utilized to lessen the wastage. (Meyers & Stephens, 2000)
(Michalska & Szewieczek, 2007) stated that the 5s approach is applied in different ven-tures, having points of interest of process improvement, wellbeing improvement, im-provement of workplace and imim-provement in correspondence process. The lean prac-tices and execution had been diminished the workers with raised restitutions just as low pressure. Lean six-sigma is a multi-variation instrument utilized in application reason and gathering processes. To conclude this lean tool creates and maintains a well-orga-nized, clean, highly efficient, high-quality work place and reduces failures and breaks which eventually increases the quality and safety of the work. (Michalska & Szewieczek, 2007)
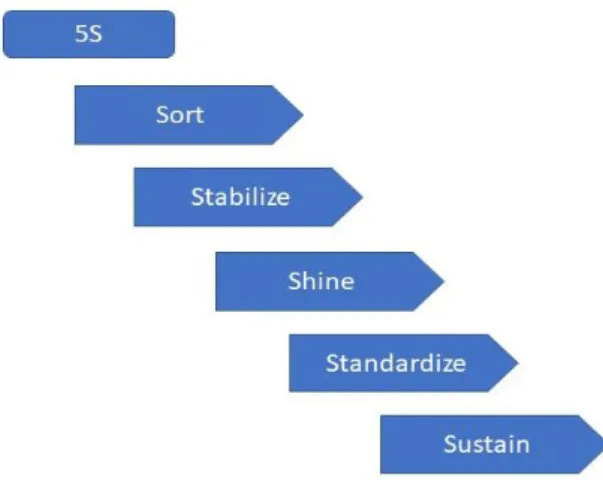
Figure 4 - 5S method implementation (Source - authors own)
The definitions of 5s strategy as shown in Figure 4 according to (Filip & Marascu, 2015) are;
Sorting:
1. Perform sorting activity at your workplace i.e. into wanted and unwanted things. 2. Remove all the unwanted things that are at the workplace.
3. Only keep those things that you need. Stabilize:
1. Decide place for everything that you need. 2. Give proper identification to it for ease of search. 3. Keep everything at its defined place after use. 4. Make sure every time that everything is at its place. Shine:
1. Always keep cleanliness at your workplace. 2. Keep the tools always clean after its use. 3. Areas should be properly marked or painted. Standardize:
1. Define standard method/way of doing the work i.e. prepare standard operating pro-cedure (SOP).
2. Do the work in that method/way only. 3. Maintain the discipline in your work. Sustain:
1. Maintain consistency in the method of doing work.
2. Stick to the ‘5S’ rules for proper workplace management.
3. Encourage the participation of all, for consistency in ‘5S’ activities. 4. Perform ‘5S’ activities periodically. (Filip & Marascu, 2015)
2.5 Continuous Improvements
Sundara et., al (2014) stated that when process soundness is set up, continuous Improve-ment component apparatuses are required to decide the main driver of wasteful aspects and apply viable counter measures to decrease those wasteful aspects. Wastes in lean manufacturing are characterized as any human movement which ingests assets however makes no value. 'Muda' is a Japanese word for waste, and it perceived seven habits of waste, given as transportation, pointless movement, pausing, improper processing, and imperfection and over production, which are otherwise called lean manufacturing. (Sundara, et al., 2014)
(Taylor & Brunt, 2001) identified that lean production is progressively appropriate, giv-ing greater duty to laborers and controllgiv-ing the manufacturgiv-ing processes. The system for lessening lead times, improving item quality and expanding adaptability are the sig-nificant variables. A portion of the lean manufacturing methods are TQM and TPM, Kaizen, Kanban, SMED and VSM are applied to lessen the wastage and cost. The dif-ferent lean apparatuses are TQM, TPM, Kanban, kaizen, SMED and poka-yoke and they are utilized to continuously decrease the wastage. OEE is the most ideal approach to break down the adequacy of a manufacturing framework to lessen the cost. The issue of hardware supplanting choice with lean manufacturing execution clarified the seven VSM instruments. (Taylor & Brunt, 2001)
(Deif, 2012) evaluated lean manufacturing dependent on framework's fluctuation for both process durations and stream the time required to catch inconsistency information and ascertaining the co-proficient of numerous improvement difficulties and find ad-dressing questions, for example, decreasing the better usage of production framework. Further examination is required to confront decrease the WIP level, lessen non-value included time and lead time and guarantee sources in the production framework and assisted with diminishing the changeability level, study uncovered that the new instru-ment prevailing with regards to catching different fluctuation catching and decreasing inconstancy over the production. (Deif, 2012)
2.6 Just in time
Just in time plays a vital role in the field of supply chain management as they have a major advantage of reducing the lead time which is associated with delivering high -quality products to customers (Yang & Pan, 2004). Due to higher benefits many com-panies have started to implement JIT in their long-term business plan. As the production process lead time which has to be controlled and reduced (Kim & Park, 1985). In addi-tion, JIT reduced the source of waste, unnecessary inventory and scrap in production (Alternburg et al., 1999). Karlsson & Ahlstrom (1996) stated that JIT is a way of think-ing define that it delivers the item at the opportune time and at the correct structure and material is pulled at whatever point there is an ascent popular.
The concept of Just in time is to have the right part and quantity when it is needed by the customer (Adnan et al., 2013). While using the pull system in a company reduces
financial risk, inventory, value input, work in progress, finished goods and work in pro-gress. As the finished goods inventory reduces and reduce cycle time (Kros et al., 2006). As a result, the entire inventory of supply chain reduces with reduce in the inventory cost (Helo,P, 2004).
2.7 Removal of waste
The waste removal focuses on adding value to the process. As there are many unwanted processes carried due to which it increases the throughput time, it is evident that by removing the internal waste it redeems the deficiencies. To carry out the result, partic-ular terminology is taken into consideration to adapt it to a part of the value stream and the terminology is also considered by the Toyota production system. (Hines & Rich, 1997)
Ismail et al., 2014 identified that lean six-sigma is utilized to lessen the wastage and cost of the business. The squanders are arranged into three gatherings: lead time (LT), non-value-added time (NVAT) and change over time (C/O). The significant level of CT just as NVAT is decreased. (Ismail, et al., 2014)
(Allen, et al., 2019) identifies different types of wastes such as: • Faster-than necessary pace,
• Waiting, • Conveyance, • Processing, • Excess stock,
• Unnecessary motion and
• Correction of mistakes (reworks
Faster-than necessary pace: This term is essentially used for performing an action that doesn’t add value to the overall process, which is carried out inside the company. Re-garding the most serious waste, basically this tends to excessive lead time and high storage time, it also makes an effect to miss the defect which reduces the quality of work and leads to excessive work in progress (WIP). This terminology supports the push system, which means by doing unwanted procedures end up in waste, to overcome this system, Kanban is used. As this study demands the same as waste reduction, main-taining flow, and increasing productivity; thus, only lean tool VSM and the focus to
develop it will be discussed throughout the thesis, which was followed by Toyota. (Allen, et al., 2019)
Waiting: The waiting term has an effect when the process which is followed in the company is not being worked or is not moving further to the next step in the process, this has an effect on both goods and workers. By reducing the waiting time, the idea is to make the process faster and efficient. (Allen, et al., 2019)
Conveyance: Any of the unnecessary movement in the company is said to be an un-necessary activity. The action of double handling and excessive movement are likely to be added to the term unnecessary transport. In addition, it causes damage and deterio-ration with distance communication where the response rate is also decreased between departments. (Allen, et al., 2019)
Processing: The complex solutions are transformed to a simple procedure in order to increase the flexibility, such as a poor layout leads to excessive transport and poor com-munication. Thus, overly complex processes decrease the flexibility and increase the complexity of the process. Due to which the company does not meet their quality in order to retain their customers. (Allen, et al., 2019)
Excess stock: The excess stock leads to increase in space and prevents rapid identifica-tion of problems. Stocks are waiting for a long time in the inventory without any need and it requires more space. As the problems are hidden in inventory, costs for the pro-cess are increased simultaneously. In addition, unnepro-cessary inventory leads to increased storage cost and hence reduces the competitiveness of the company. (Allen, et al., 2019) Unnecessary motion: This involves an ergonomics perspective in a company, where the worker must stretch, bend, move or pick, where these actions could be unnecessary. So, these actions could be avoided to increase the productivity and increase the quality of the process. (Allen, et al., 2019)
Correction of mistake: The mistakes which are made during the process have an impact on direct cost to the production. These effects should be taken into consideration rather than trading it off. This defect is solved immediately by the Kaizen effect. (Allen, et al., 2019)
2.8 Visual Management
The visual management system is followed by many companies which attempts to im-prove the organization performance through connecting and aligning organizational vi-sion, core values, goals and culture with other management systems, work processes, workplace elements, and stakeholders, by means of stimuli, which directly address one or more of the five human senses (sight, hearing, feeling, smell and taste). (Liff & Posey, 2004)
(Eaidgah et al. 2016) describes visual management as a practice/tool of visualizing in-formation or displaying requirements to set direction, which allows the employees to make the right decision. This tool increases the performance of the process which is carried out at the workplace. The tool has been followed by many logistics companies which makes them to have better communication requirements and manage effective-ness and efficiency of action. (Eaidgah et al., 2016) The visual management system was developed while the Toyota production system (TPS) was involved and some of the visual management tools are value stream mapping, flow charts and name boards) (Eaidgah et al., 2016). Providing better visual management can achieve company goals and productivity of current performance and this can be done by continuous improve-ment, which also brings transparency and discipline into the system. For example, traf-fic lights are the best example for visual ergonomics. (Eaidgah, et al., 2016)
2.9 Standardization
According to (Denniss, 2002) standardization is one of the main blocks of lean. The various tools of standardization help to identify the value added and non-value-added process and aids to improve efficiency in the process. He says (Denniss, 2002) standard is a clear image of the desired condition. It makes anomalies and abnormalities instantly obvious so that preventive and corrective actions can be taken. It is always good when it is clear, simple and visual. (Denniss, 2002)
A standardized work procedure is the key factor of building in the quality, which was developed by well-trained group leader at Toyota, which ensures zero defects in the process. The visualization of the standard procedure is done to reach the efficiency which is reached through several pictorial representations which includes writings, ar-rows to direct the employees to take a correct step which eventually. By following the
standardized work procedure, it demonstrates the employee to perform the task straight-forward and need no additional reading and memorizing. In addition, standardized work procedure is used to train the new employee as a well experienced one doing their job. (Liker, et al., 2009)
According to (Denniss, 2002) the benefits of standardized work are: • Process stability
• Training
• Employee involvement and poka-yoke • Organisational learning
• Kaizen
Takt time, cycle time and work sequence are the most important elements for standard-ized work. Takt time says how frequent a product should be produced and cycle time says actual time it takes to produce a product. The aim is to synchronize takt time with cycle time. (Denniss, 2002)
2.10 Online ordering and delivery system:
Delivery of goods to customers is a critical activity in any business. As, Vehicle routing has a major impact in on time delivery of product to the customers, a major problem of the vehicle routing in the electronic commerce (EC) environment where the process of buying, selling, or exchanging products, services and information is done through the internet. The main concern is to have better coordination during the order generation, order taking, order fulfilment and their distribution. (Du, et al., 2005)
Since consumers place their orders through the Internet which comes under an online B2C environment, the orders are unpredictable as there can be various barriers before they reach the customer, but the service response is expected to be fast to increase the customer satisfaction. One way to meet the consumer’s needs is to find an algorithm that can satisfy both the capacity and time constraints in a timely manner. In order to find a feasible solution, this study adopts the soft-time-window policy, but the severity of the late penalty is not considered. (Du, et al., 2005)
In the aspect of online delivery, product quality is an important factor of purchasing decisions from the customer point of view. The research has argued that the online market has faced increased competition and creation when related to physical market purchasing and the quality can be judged on the amount of available information, the
product quality of the company, difference in price and it is also evaluated by online criteria such as the number of connections or the accuracy of match between requested and delivered departure/return time, according to the customer needs. (Malone et al., 1987)
2.11 Order Picking
There has been a dramatic increase in online shopping due to the advent of the Internet era. The recent focus of the distribution centres is to deliver the products on-time, even if the customer places the order late, they are under pressure to follow a quick picking and delivery process. In general, the lead time for the process is under pressure for the online retailers due to customer pressure. (Ranganathan & Ganapathy, 2002)
According (Yu & De Koster, 2009), the traditional way of doing the picking process is to pick a batch of orders and release them to the shop floor from where they are packed and sorted according to their respective destinations. However, the batch information takes time and as the number of daily orders increases, the time required to process increases and required lead time decreases. The picking process is of two types namely: part-to-pick and pick-to-part system. As pick-to-part system, this is where the orders are picked by walking around or driving along the aisles to pick the items, whereas the pick-to-part system is further distinguished into two; pick by order or pick by article which is also known as batch picking. The picking procedure should be structured in an efficient way, so the picking can be done in batches or individually, which results in short travel distance. (Yu & De Koster, 2009)
(Brynzér & Johansson, 1995) says the picking process can be improved by the geo-graphical grouping of the products, if all the products have common information, it makes the process of picking easy. The main driver for batch picking is reducing the average picking travel distance and thereby increases the throughput and improves the data performance. The main factor of the order picking is a proper information of ware-house layout, storage capacity and proper routing policy. (Brynzér & Johansson, 1995) 2.12 Zoning
In the picking process the orders are picked from the storage location to fulfil the cus-tomer’s needs. As discussed before the order receiving is the most important activity in
the distribution centre, where the order can be small order (less ordered items) of larger volume or larger orders (many ordered items) of small volume which arrives as an early or late order, still the distribution centre should be ready to pick and distribute in short time. (Brynzér & Johansson, 1995)
As in the items shown on the picking list, storage policy and warehouse layout have an increasing effect in travelling distance. The distribution centres strive to fix the picking area size and fixed number of order picking zone to reduce the travel distance. There is a trade-off between these phenomena and thus by minimizing order zone the throughput time decreases. (Yu & De Koster, 2009)
2.13 Warehouse Management and Utilization of Space
Warehouse Management is a significant element of action from the supply of products, from raw materials and work in advance through to completed products. It is an integral element into the supply chain system in which it functions and because of its functions and goals ought to synchronize with the aims of the distribution chain. It is not a 'Stand-alone' part of action and it should not be a link in the supply chain system. (Ten Hompel & Schmidt, 2008)
According to (Taylor et al., 2001) warehouse management is expensive concerning hu-man resources and of equipment and those facilities and supply chain functionality will be affected on by its functionality. Handling or design of warehouse programs will also sabotage the upkeep of inventory integrity and the accomplishment of customer service levels, and result in expenses. The Pressures and Recent trends on supply chain increas-ing customer service levels price minimization and time compression have altered the structure of supply chains along with the location and functioning of warehouses within the distribution chains community. Surely the idea of warehouses since the setbacks to shop goods has been obsolete. Warehouses perhaps better known as supply facilities; exist to ease the movement of substances. In most uses, although there are exceptions like Strategic stockholding; efficient and effective movement of substances to the client is the secret, even though some stock needs to be held to attain them. (Taylor et al., 2001)
2.14 Efficient use of space and its benefits
Having assembled the knowledge about throughput goods and procedures some con-clusions can be made about the sort of storage and handling equipment and the design
of the warehouse. For warehouses, there might be no alternative except to utilize the design dependent on the knowledge it is likely to boost the efficiency in distribution centres. (He et al., 2011)
Some of the salient factors of appropriate utilization of space from warehousing are as follows:
• Zones: Typically, warehouses are broken up into several zones, which include groups of places such as storage, select faces racking, freezer and chiller. Prod-uct groupings normally refine these, such as course, slow and pet food. (Henn, 2012)
• Operational Regions: overlaying and frequently overlapping the zones at a warehouse will be the locations. These are defined around the sort of operators and gear who could function in these regions. The most important use for them is tasks to the operators at the region with the gear to perform the task's mission. (Henn, 2012)
• Workflow: The warehouse design can prescribe the workflow inside the ware-house. The diameter of the elevation of the stands at an area as well as the aisles will establish the sort of forklift that could get into the aisle and if the aisle is two or one-way. The management wills impact that operators put off tasks and need to travel across the aisles. Deciding these traveling paths is vital in enhanc-ing warehouse efficiency. (Tick, J, 2013)
• Labour Management: Using labour management performance, particularly task efficacy will improve when coupled with job interleaving. Task management will provide precise job status. Determining labour standards will help deter-mine the travel paths and number of operators and permit monitoring of the power of the warehouse operators. Labour preparation utilizes labour require-ments to be provided by labour standards. (Benvegnú et al., 2018)
Apart from this some of the benefits of space utilization in warehouses are as fol-lows:
• Optimized Space and Reduced Expenses: Warehouse management methods maximize warehouse flow by assessing the usage of floor space dependent on the job and material features. From the WMS implementations, space and floor plan investigation is utilized to ascertain how space must be used and provides opportunities for reducing waste of superior floor space and waste of time to
finding product. This may reduce cost caused by time consuming positioning, material motion, and recovery. By considering the places to store goods, in ad-dition to equipment or materials, a warehouse may lower its working expenses. (De Koster et al., 2007)
• Inventory Visibility and management: Utilizing a warehouse management pro-gram may provide visibility of True, real-time stock amounts. This enables a business Estimate distribution and prevention. Warehouse management prac-tices Work in combination with planning capabilities and the business ERP to supply by discussing details that are accurate regarding how, Requirement Prod-ucts are doing. Seasonality and Item demand is represented as Things are trans-acted and data communicated. So, with this planner, Advice could make con-clusions about which goods to Correct to your enterprise or mitigate declines. (Tick, J, 2013)
2.15 Implementation of lean tool in an organization
(Hines & Rich, 1997) have applied VSM apparatuses for squander disposal in Toyota Production System. Value Stream Analysis Tool was utilized for empowering the de-termination of compelling VSM instruments, they introduced a use of VSM alongside recreation of a committed production line by creating VSM for lean activity and process duration decrease in a company (Hines & Rich, 1997). (Lasar & Vila, 2008) demon-strated that VSM is a reasonable instrument for updating the production framework dependent on the lead of the contextual investigation. They have built up a value stream guide to assess breakdown support activities for the production process. (Lasar & Vila, 2008)
Lean is characterized in 5 different ways, for example, characterize client value, char-acterize value stream, and make it stream, build up pull and take a stab at greatness. The group manufacturing is moved into lean manufacturing and this lessens the ar-rangement time, expands the profitability and less space is required for manufacturing. The little and medium level organizations are restless about changing the mentality of laborers, slacking of mindfulness about lean rule, time and cost associated with usage of lean. (Easwaramoorthi et al., 2011)
The lean manufacturing rule is applied in the manufacturing organization, at that point VSM and man machine outline are utilized to show the current status. The waste region
is distinguished and utilizing lean device improves the VSM and man, machine usage. (Dal Forno et al., 2014)
(Abdulmalek & Rajgopal, 2007) broke down the advantages of lean manufacturing and VSM by reproduction in a process sector. VSM was utilized to recognize the open doors for lean strategies. A recreation model was created utilizing a framework demonstrating Corporation Arena 5 programming and applied when the usage of lean and hence the advantage of lean was represented. Additionally, the recreation can be utilized to assess fundamental execution gauges and dissect framework setups. Further it very well may be utilized to approve the choice on execution of lean manufacturing and can urge the organizations to actualize lean with a perspective on wanted outcomes. (Abdulmalek & Rajgopal, 2007)
3 Methodology
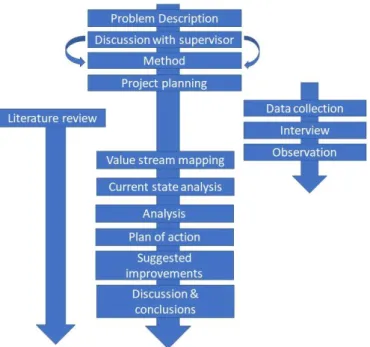
In this chapter we describe how the study is conducted in order to answer the research questions, this chapter provides an outlook of the selected research approach, research paradigm and the data collection methods. The validity and reliability of the collected data is also discussed.
3.1 Research Method
The project was initiated with the discussion of the research problems together with the logistic development and controlling manager of the case company along with the uni-versity professor. The method was reformulated to be followed as a framework for the thesis project. The plan of the project was made in accordance with meetings held with managers and other persons of interest. This was followed by a company tour around different departments and introductory meetings were held with department’s respec-tive managers in order to understand the overview and working of the business. Under-standing the current state and data collection was done based on observations and in-terviews. Literature survey was done throughout the remaining period of the study. Fig-ure 5 illustrates the methodological approach of the study and the different activities that were included in the work.