Department of Economics, Uppsala University
Bachelor Thesis
Ulrika Ahrsjö & Tove Malmholt Supervisor: Niklas Bengtsson Fall semester 2013
Food at All Costs?
─
Investigating attitudes towards genetically modified
crops
among small
-‐scale farmers in western Kenya
2
Abstract
The international debate on genetically modified crops as a means of ending world hunger is characterised by the polemic between environmental organisations and the biotechnology industry. In African developing countries, the much-needed increase in agricultural productivity could potentially be reached through commercialisation of GMOs, but the findings of this study show that consumer acceptance among small-scale farmers in western Kenya is low. The farmers are not shown to have been influenced directly by NGO advocacy on a local level, but their attitudes are likely swayed by the negative climate of the national debate on GMOs in Kenya. The results also indicate that small-scale farmers do not support environmentalist attitudes, making NGO advocacy and European foreign aid policies potentially misguided in their attempts to promote organic farming principles.
Key words: biotechnology, consumer, food security, GM food, Kenya, WTP
Acknowledgements
We would like to thank SIDA for providing the financial support that made this Minor Field Study possible and Niklas Bengtsson for supervising our work. We also send many thanks to the staff working at C-MAD and ARDAP for their invaluable help with performing our survey. Finally, a special thank you to: Wilton Mbinda for helping us understand the Kenyan GMO debate and our contact persons Evelyn Siaga and Benjamin Obiero for offering us an unforgettable experience in beautiful Kenya.
List of Abbreviations
FAO – Food and Agriculture Organization (of the United Nations) FCEC – Food Chain Evaluation Consortium
GM – Genetically modified
GMO – Genetically modified organism GE – Genetically engineered
IAASTD – The International Assessment of Agricultural Science and Technology for Development
IFPRI – International Food Policy Research Institute KES – Kenyan Shillings
PANNA – Pesticide Action Network of North America UNEP – United Nations Environment Programme WTP – Willingness to pay
3
Table of Contents
ABSTRACT ... 2
ACKNOWLEDGEMENTS ... 2
LIST OF ABBREVIATIONS ... 2
1. INTRODUCTION ... 4
2. BACKGROUND ... 7
2.1 WHAT ARE GMOS? ... 7
2.2 THE GMO DEBATE ... 8
2.2.1 Risks ... 8
2.2.2 Benefits ... 9
2.3 POLICY ... 11
3. THEORETICAL FRAMEWORK ... 13
3.1 INFLUENCES ... 13
3.2 WILLINGNESS TO PAY ... 15
4. METHOD ... 17
4.1 SURVEY AND SAMPLE ... 17
4.2 SURVEY ATTRIBUTES FOR GM AND TRADITIONAL MAIZE ... 20
4.3 DATA ANALYSIS APPROACH ... 23
5. RESULTS AND DISCUSSION ... 25
5.1 DIFFERENCE IN WILLINGNESS TO PAY ... 25
5.2 IMPACT OF THE SURVEY ATTRIBUTES ... 27
5.3 VALIDITY OF REGRESSION RESULTS ... 29
6. ANALYSIS AND CONCLUSIONS ... 31
6.1 ANALYSIS: EVALUATING ATTITUDES AND INFLUENCES ... 31
6.2 CONCLUSIONS ... 36
REFERENCES ... 38
APPENDIX ... 41
APPENDIX 1: SURVEY QUESTIONNAIRE ... 41
APPENDIX 2: MAIZE CHART EXAMPLE ... 43
4
1. Introduction
The world’s population is growing at an unprecedented pace and the agricultural sector in many developing countries is struggling to keep up the pace in order to feed the country’s hungry small-scale farmers. The productivity of African farmers is significantly lower than that of farmers in most developed nations, which is a contributing factor to the deepening of starvation and poverty, already present in vulnerable areas. The Kenyan economy revolves around agriculture. The agricultural sector is the largest contributor to GDP (approximately 25 per cent) and 75 per cent of the population is employed within this sector which implies that an improvement in agricultural productivity would benefit a majority of the population and specifically the small-scale subsistence farmers residing in rural areas (Alila & Atieno 2006:3).
According to Paarlberg (2008), Virgin (2013) and Herring (2007) among others, this much-needed increase in agricultural productivity could be achieved through the use of genetically modified crops. However, the topic of GMOs is controversial and no global consensus has been reached regarding what path African developing countries should take when faced with promising yet potentially questionable biotechnology. The GMO debate is characterized by its polarity where organizations such as Greenpeace, Oxfam and the IFOAM take a clear stand against GMOs as a way out of poverty and starvation, while other organizations and influential scientists such as Norman Borlaug (2000) and Robert Paarlberg (2008) claim GMOs represent the end to world hunger. Indeed, the World Bank and the Directorate-General of Research and Innovation of the European Union have stated that there are no proven dangers of GMOs (European Union 2010:16, The World Bank 2007:178) and many reports drafted by international institutions including IFPRI and FAO of the United Nations emphasize the possible benefits GM crops can bring small scale-farmers in developing countries.
Despite these statements, African countries remain largely sceptical towards GMOs and a prime example of this distrust is the Zambian governments’ rejection of food aid containing GM crops in the middle of a drought in 2002 (Annear 2004). The reason for why the Zambian president prevented GM food aid to be delivered to the starving population is discussed by Paarlberg (2008) who claims anti-GMO lobbyists and European influences have shaped the regulations and opinions towards GMOs in Africa in a negative way. Another case of prevailing negative attitudes towards GMOs in Africa is the Kenyan government’s ban on the
5 imports of GMOs in 2012, prohibiting small-scale farmers to grow GM seeds and making national GMO research initiatives come to a halt (Willingham 2012).
Considering this polemic it is of interest to investigate the consumer acceptance of GM crops in developing countries in order to take the attitudes of the population into account when developing policies and regulations. In many developed countries a large share of the population has values in accordance with environmentalist ideas of organic farming, which in many cases are reflected in these countries’ foreign aid policies (TNS Opinion and Social 2010, SIDA 2011). Paarlberg (2008) discusses the channels of influence through which developed countries can affect the African GMO debate, of which one is foreign aid turning away from investments in agricultural science and research on GMOs. But not only national governments exert influences on African governments’ and farmers’ attitudes toward GMOs, NGOs are to a great extent active in promoting organic farming in many developing countries, Kenya included. This raises the question if the attributes valued by farmers and the population in general in developed countries are identical to the values of small-scale farmers in Africa? It is not farfetched to assume there might be some discrepancies regarding what preferences the different populations have considering the great differences in income and education. In fact it might be a case of developed countries exporting values to a country and a context in which they do not fit. Kenyan small-scale farmers would be concerned with having enough food to feed the family, whereas this is a given for most people in developed countries. With this in mind, it is also of importance to study to what extent the influences mentioned by Paarlberg (2008), are shaping attitudes towards GMOs in Kenya and creating biased opinions supporting environmentalist values.
Kenya has been one of the forerunners in legislation and testing of GMOs in Africa and there is a high concentration of pro-GMO lobbyism in the country, supported by international foundations and multinational companies (Moola & Munnik, 2007:7, 40-41). These circumstances make Kenya an ideal location for a study of this nature. A willingness to pay (WTP) study performed by Chege Kimenju and De Groote (2008) in the country find that consumers are prepared to pay a premium for GM maize meal over their regular brands (Chege Kimenju & De Groote 2008:44). However, this study was performed before the Kenyan nationwide ban on GMOs was implemented in 2012, which makes a new study on the possible effects of the ban on the attitudes among the population in Kenya relevant. Consequently the objective of this study is to examine Kenyan small-scale farmers’ attitudes towards GM crops through a WTP-survey. In addition to concluding what preferences these
6 small-scale farmers have regarding traditional maize as opposed to GM maize, it is of interest to investigate what attributes and characteristics these farmers value when it comes to a choice between GMOs and local varieties. This will be done through a comparative analysis of the attributes with which the maize varieties were described in the performed study. If the sample is indeed unbiased, in this case meaning uninfluenced by environmentalist values originating in developed countries, the values of small-scale farmers should be predominately concerned withbenefits such as higher nutritional value and not environmentalist values such as conserved biodiversity. Provided that GM crops actually entail benefits, small-scale farmers should prefer GM crops to traditional ones. Are the current foreign aid policies of developed nations then in fact misguided, emphasising environmentalist values not in the best interest of small-scale farmers?
This paper will investigate two questions: (1) Considering the potential benefits GM-technology could offer, are small-scale farmers in Kenya as consumers willing to pay more for GM maize than for traditional varieties? (2) Are small scale farmers’ attitudes towards GM crops biased, as in influenced by NGOs on a national and local level, as well as by the negative stand in developed countries?
There have been no previous studies on the extent to which small-scale farmers of Kenya are influenced by environmentalist attitudes towards agriculture and GMOs. This study is therefore a first attempt at investigating the coherence of grass root preferences and “green” values. The findings of this study are that small-scale farmers are willing to pay a premium for traditional maize over GM maize, which contradicts the predicted results as implied by findings in Chege Kimenju and De Groote (2008). Through an analysis of each attribute used to describe the maize varieties in the study, the conclusion can be drawn that there is no evidence suggesting that the respondents place emphasis on environmentalist values. Therefore the sample cannot be interpreted as biased through influences by donors and NGO advocacy on a local level. However, since the results show generally negative attitudes toward GM maize there is a possibility of the sample in the study having been affected by the national debate through indirect and negative external influences, such as European attitudes and GM-regulations as well as environmentalist actions. Considering these efforts to promote organic farming principles against the background of small-scale farmers not supporting environmentalist values, it is possible to conclude that European foreign aid policies as well as environmentalist lobbyism to a certain extent are misguided in that these actors do not take the attitudes of farmers into account.
7 This paper proceeds as follows: subsections 2.1 through 2.4 gives an overview of the GMO debate discussing potential risks and benefits of the technology and policy issues. Section 3 outlines potential external influences on African GMO regulations as well as theories of consumer acceptance through the concept of willingness to pay. The fourth and fifth sections describe the methodology used as well as the results from the study. Section 6 and 7 discuss possible interpretations of the results and present conclusions thereof.
2. Background
2.1 What are GMOs?
Biotechnology, the technique by which GMOs are created, can broadly be defined by Article 2 of the Convention on Biological Diversity as "any technological application that uses biological systems, living organisms, or derivatives thereof, to make or modify products or processes for specific use" (FAO 2011:1). GM crops can specifically be described as: "... developed by a process of genetic modification by which selected individual genes are inserted from one organism into another to enhance desirable characteristics (‘traits’) or to suppress undesirable ones." (Fukuda-Parr & Orr 2012:1).
The process of enhancing desirable traits in plants has existed throughout history. Modern biotechnology makes this process faster and more precise. Where scientists previously had to rely on crossbreeding, a method in no way guaranteeing satisfactory results when trying to pass on a specific trait, they can now, through genetic engineering, identify the gene responsible for a wanted trait and directly insert the gene into a crop(Fukuda-Parr & Orr 2012:1-2).
A distinction is usually made between the first and second generation of GM crops where the first generation may give benefits to farmers as well as the environment, while the second generation may benefit human consumers directly through for instance enhanced nutritional value (Qaim 2009:666). Two types of crops out of the first generation have been grown on a commercial scale: herbicide tolerant (HT) and insect-resistant (Bt) varieties. HT crops have the inherent trait of resistance to certain herbicides, which leaves the crop unharmed when sprayed with chemicals such as glyphosate. This facilitates weeding in that the herbicide specifically targets the weed and does not damage the food crop. Bt crops are made poisonous to some species of insects through the insertion of the bacterium Bacillus thuringensis in
8 order to create a certain insect resistance which reduces the need to use insecticides limiting costs as well as harm to nature (Fukuda-Parr & Orr 2012:2, Fernandez-Cornejo & Caswell 2006:7).
The first commercialization of GM crops took place in the mid 1990s primarily in the US, but since then the technology has spread to a number of other countries. However, higher production levels of GM crops for commercial use are limited to a few countries where regulations concerning GMOs are less restrictive (Fukuda-Parr & Orr 2012:3). In 2008, 25 countries were growing GM crops on a substantial scale out of which the US, Argentina, Brazil, India and Canada were the largest producers using primarily HT crops. The European Union has a more restrictive legislation than the US with only a few countries permitting some GM technologies, but there is no production of GM crops on any significant scale in Europe (Qaim 2009:667). The African situation is similar to the European, with small areas of GM crops being cultivated and with predominately restrictive legislation; however the exception on the continent is South Africa with its relatively lax GMO policies (Moola & Munnik 2007:12).
2.2 The GMO debate
The subject of GMOs is a controversial one with debated empirical facts. There are numerous organizations opposing GMOs worldwide and regulations in the EU, amongst other places, have been designed with a high level of scepticism toward GM crops. At the same time other organizations are involved in promoting GM crops as a solution for food security in Africa (Moola & Munnik 2007:55). Both anti-GM and pro-GM organizations claim that they are concerned with the best interests of poor small scale farmers, at the same time as the global debate is influenced by the interests of multinational corporations that to a large extent control the biotech industry (Fukuda-Parr & Orr 2012:6). It is therefore difficult to make any unbiased assessment of the potential of GMOs for small-scale farmers in Africa (Herring 2007:21). Following is a discussion of potential benefits and risks related to the use of GM crops.
2.2.1 Risks
The risks and negative consequences that many organizations and individuals fear might be the result of widespread use of genetic modification of plants can be divided into two
9 categories involving: risks for adverse effects on the environment and risks for harmful effects on human and animal health (FAO 2003, Qaim 2009:673). On top of these direct negative effects on the environment and human/animal health, there are negative socioeconomic effects caused by what Fukuda-Parr and Orr (2012) call the "corporate control of the food chain". In their report they voice concerns regarding the dominance of the biotech industry by large multinational corporations (MNCs) such as Monsanto, Syngenta and Dupont. The shift in seed control from a local to a corporate level reduces farmers’ involvement in seed enhancement as well as control over “food sovereignty” (Fukuda- Parr & Orr 2012:6). In addition MNCs have the power to set the agenda governing what types of crops undergo genetic modification. Local African crops like cassava and sorghum receive little attention from MNCs, contributing to the fact that small-scale farmers in Africa reap little benefit from GM technology (The World Bank 2007:178). This dominance of the industry in combination with MNC controlled patents on intellectual property (the technology behind GM crops) raises prices of crops and slows public-sector research as it limits the sector's access to previous research (FAO 2003).
The report on the UN led project IAASTD points to the fact that small scale farmers stand to benefit the least from GM technology with the current shape of intellectual property rights (IPR). IPRs restrict farmers from saving seeds from one season to the next as well as from performing on-farm cross breeding which may result in small scale farmers losing their food security. While the technologies may potentially benefit small scale farmers in various ways, this potential cannot be harvested if IPRs (in combination with restrictive GMO regulations in various developing countries) restrict the use of the technologies, limiting farmers’ ability to use the seeds as well as limiting the ability of public research to adapt GM crops to local conditions in developing countries. The report claims that even if restrictive GMO legislation in many African countries were removed, the spread of GM crops would be of no significant scale due to the extensive protection of IPRs (IAASTD 2009:42-44).
2.2.2 Benefits
The negative aspects of GM crops are primarily voiced by NGOs and to some extent the European Union with its cautionary regulations as well as Japan (Chege Kimenju & De Groote 2008:37), however, the bulk of research done on the subject shows that there are no direct adverse effects resulting from genetic modification of crops (Paarlberg 2008:26-30). In fact, The World Development report on agriculture (2008) discusses the potential benefits
10 GM crops could provide small-scale farmers in developing countries (The World Bank 2007:177-179). A problem brought to light in the UN report (IAASTD) is that even when admitting there are potential benefits involved in growing GM crops, the technology in itself is not a solution without infrastructure and the adaptation of GM crops to local conditions, for which there is a lack of funds in developing countries (IAASTD 2009:42).
Matin Qaim's paper on the economic aspects of GMOs is largely positive towards GM crops describing the situation with: "Although potential risks need to be further analysed and managed, GM crops can also induce substantial environmental and health benefits." (Qaim 2009:675). The World Development Report (2008) stresses certain benefits specifically important to developing countries such as higher yield, possible vitamin enhanced crops such as “golden rice” (vitamin A-enriched rice) and a reduction in pesticide use which is a farming input most small scale farmers cannot afford (The World Bank 2007:177-179). The pest and disease resistant varieties of Bt crops can thus give resource constrained small-scale farmers an opportunity to control such problems without having to invest in costly pesticides (Virgin 2013:18).
GM crops have not been widely adopted in developing countries but the varieties that have been adopted have mainly been Bt crops (The World Bank 2007:177), however small-scale farmers in developing countries tend to use less insecticides and pesticides compared to large scale farmers in developed countries, which implies different characteristics of the benefits resulting from the use of Bt crops. Farmers using a substantial amount of insecticides in production stand to benefit the most from reduced costs for chemicals when growing Bt crops, whereas small scale farmers in developing countries, where there is usually more pests and diseases, benefit more from increased yields (Qaim 2009:670-671). In general, the gross margin effects of Bt crops are positive for most countries. As Matin Qaim shows in his paper: "... economic advantages associated with insecticides savings and higher effective yields more than outweigh the technology fee charged on GM seed." (Qaim 2009:673).
In a country like Kenya, with limited areas suited to farming, with arid land and land tenure issues, crops that could give a higher yield from less acreage, as well as crops resistant to drought, could greatly benefit small-scale subsistence farmers. Considering the benefits biotechnology could bring, small-scale farmers should be positive toward GM crops (Qaim 2009:681). High yielding GM crops could also be a step in the right direction for future global
11 food security with the world’s population rapidly approaching 9 billion people (Virgin 2013:7).
A growing population puts more stress on the productivity of available farmland. Paarlberg (2008) emphasizes the possibilities in Africa of GM led pro-poor growth. Small-scale farmers have greater land security on this continent compared to farmers in Asia and Latin America, which means that a technology improvement that is both pro-poor and pro-growth will lead to productivity gains for small-scale subsistence farmers. Biotechnology could deliver this scale neutral growth if “…it raises total factor productivity of small as well as large farms.” (Paarlberg 2008:85-86).
2.3 Policy
The Kenyan policy setting can best be seen in the light of the global GMO debate. Indeed, the GMO regulations in many African countries can be derived from a global context (Paarlberg 2008:13). Kenya is partaking in an influential endeavour to create a harmonized regulatory system governing the use of GMOs worldwide; the Cartagena protocol. Drafted in 2000 as an extension of the Convention on Biological Diversity1 the protocol seeks to ensure that all countries are provided with information about the potential risks of negative impacts on biological diversity, before importing or commencing production of GMOs (SCBD 2012). Yet, the global GMO policy debate has primarily been centred around the opposing regulatory systems of the US and the EU, where the US advocates a more allowingapproach contrasting the European precautionary view on GMOs (Davison 2010:2).
Europe is the part of the world with the most restrictive legislation surrounding GM crops (Davidson 2010:1), where the European legal framework developed in 2003 (Regulation (EC) 1829/2003 on genetically modified food and feed) regulates the introduction of GMOs into the market as well as the labelling of GM foods and feeds with emphasis on the safety aspects pertaining to GM crops. The EU legislation defines the risk assessment practices each country
11 The convention was approved in the Nairobi Conference for the Adoption of the Agreed Text of the Convention on
Biological Diversity in 1992, and signed by 168 countries before it was enforced in December 1993. The objectives of the Convention are defined as: “The objectives of this Convention, to be pursued in accordance with its relevant provisions, are the conservation of biological diversity, the sustainable use of its components and the fair and equitable sharing of the benefits arising out of the utilization of genetic resources, including by appropriate access to genetic resources and by appropriate transfer of relevant technologies, taking into account all rights over those resources and to technologies, and by appropriate funding.” (CDB Secretariat 2013).
12 should implement to harmonize the GMO regulations within the union (European Commission 2013). Since the EU legislation compared to for instance the US or Canada requires substantially more research on a GM crop before release into the market is allowed, possible negative aspects of the strict control is an increasing workload for the EFSA (European Food Safety Authority) and the Commission while Europe fails to reap the benefits of the technology (Bradley 2010:2).
The possible gains from GMOs outweigh the potential risks of using GM crops according to scientists such as Paarlberg (2008), Virgin (2013) and Conko & Miller (2004). They argue that regulatory systems governing the use of GM crops, which are too restrictive, will keep countries with such regulations from reaping the benefits of biotechnology. If small-scale farmers in Africa are to benefit, the GMO policies in most African countries, including Kenya, must be re-evaluated (Paarlberg 2008:19-20). In November 2012 the government banned all imports of GMOs to Kenya rooted in the belief that the technology was potentially harmful (Willingham 2012). This ban has been challenged and said to be rash as well as based on unscientific evidence showing harmful effects resulting from consumption of GM foods, and a number of scientists have criticized it claiming the ban was unsuitable for Kenya, a country in need of improving its agricultural productivity (Achia 2013, Okoth 2013, Owino 2012, Willingham 2012).
Based on unequal economic situations, the needs and values are different in developed countries as opposed to developing countries, which could potentially result in different laws and regulations being established. Consumers in developed countries have no need for further boosts of agricultural productivity as there are no food shortages in these areas of the world, which has lead consumers to see little benefits in GM crops as the first generation of these crops were introduced (Paarlberg 2008:18-19). At the same time, changing attitudes toward agricultural productivity enhancements and research in agricultural science have shifted public spending away from R&D investments directed toward agricultural science (Paarlberg 2008:78-79, The World Bank 2007:166). This shift in attitudes in combination with a global decline in the funding of agricultural research were the driving forces behind shaping the regulatory system governing GM crops in place in Europe today. The US went through a similar phase, but most of the public spending on agricultural science was replaced by private funding, which together with strong IPRs created a market for agricultural research (Paarlberg 2008:79). As the attitudes and policies in Europe turned toward a prohibitive approach to GM crops, these attitudes and policies were exported to Africa through four main channels of
13 influence; foreign assistance, intergovernmental organizations, international commodity markets and NGO advocacy (Paarlberg 2008:19, 111, 124).
Noteworthy is the European countries’ power to set the agenda through direct funding, for example the involvement of Swissaid with the Alliance Against Genetic Technology in Tanzania and the Dutch government assisting IFOAM, the most prominent NGO advocating organic farming in developing countries (Paarlberg 2008:101, Swissaid 2011, Eyhorn et al. 2002:3). Other examples of European influences on the GMO debate in Africa are a Norwegian NGO (Norway’s Institute for Gene Ecology) influencing the decision in Zambia to reject GM crops as food aid in 2002 and Friends of the Earth trying to persuade Sudan and Angola to decline such food aid. According to Paarlberg (2008) what small-scale farmers need are more chemical fertilizers to increase the fertility of the soil as well as increase productivity on the farms. The NGOs supporting organic farming are misleading small-scale farmers struggling with infertile soil to adopt farming practices that will not benefit them. He turns against the work of organizations like IFOAM, accusing them of having an inflexible approach which will fail to bring the productivity gains so desperately needed in small-scale farming (Paarlberg 2008:100-103, 138-146).
The channels of influence described by Paarlberg (2008) are brought up in a publication by IFPRI. The situation in many African countries is described as chaotic with government officials being “bombarded with multiple, mostly conflicting positions and messages about the appropriateness of GE crops in the African context.” (Falck-Zepeda et al. 2013:18). The book also quotes a statement issued by the African Union in response to the overwhelming situation, in which they point to the fact that there is a lack of African consensus on the subject of biotechnology which has created possibilities for different interest groups to push their own agenda with little regard to the African context (Falck-Zepeda et al. 2013:18).
3. Theoretical framework
3.1 Influences
In the book Starved for science (2008), Paarlberg describes the four channels through which European values impact the African GMO debate. The fact that many African countries, including Kenya, have adopted prohibiting policies on GMOs is explained by the channels of
14 influence and that the lion’s share of external influences on GMO regulations in Africa has come from Europe rather from the US. The first channel, foreign assistance, has a significant impact on policymaking in African countries, primarily because of these countries’ aid dependency. This dependency gives donor governments and organizations involved in aid work the power to set the agenda, which means that spending decisions are motivated and controlled by donor preferences. Since European donors contribute much more than the GM-friendly US, African governments and policymakers are to a greater extent influenced by European preferences.
Paarlberg (2008) describes the second channel as influences coming from intergovernmental organizations or simply, “the United Nation system”. Apart from setting the agenda through direct funding, European countries also outright discourage the use of GM technology in agriculture through involvement in anti-GMO projects run by organizations against biotechnology. In effect, developing countries are encouraged to adopt strict GMO regulatory systems based on the precautionary principle embraced by Europe through a global program on biosafety regulations run by UNEP (Paarlberg 2008:92, 127, 190).
The impact of the third channel, international commodity markets, is indirect and goes through European importers sending signals to African countries that their exports should be GM-free, otherwise European importers would not be interested in buying. Since the main part of African exports goes to Europe, African countries adopted the same precautionary regulations as Europe in fear of otherwise losing exports (Falck-Zepeda et al. 2013:145-146). However, this channel is not perceived as relevant for this study, seeing as Kenya is a net importer of food (Chege Kimenju & De Groote 2008:37).
Lastly, the influence of NGOs opposing biotechnology and advocating organic farming has been substantial. Environmental groups are actively working against their introduction in Africa with Greenpeace and Friends of the Earth as the main actors. Through the Cartagena Protocol, which promotes a precautionary approach, NGOs opposing GM crops were given an internationally accepted legal standard as a common reference point when criticizing the permissive legal framework in the US. International NGOs have been active in pushing the general opinion toward a negative stance on GM crops and have influenced governments and policymakers as well as farmers on a local level through partnering up with local organisations. Paarlberg (2008) describes the information given by NGOs opposing GMOs as
15 false and unfounded, pointing out that in some cases GM crops have been equated with poison, which has led many African government officials to assume a negative attitude.
3.2 Willingness to pay
Genetically modified crops have never been introduced commercially in the Kenyan market. Consequently consumer preferences can only be estimated hypothetically through a non-market valuation method, of which stated preference (SP) models with contingent valuation (CV) are the most commonly used (Qaim 2009:681). This family of approaches aim to measure an individual’s preferences in a fictional market, where the preferences are evaluated given (contingent on) certain conditions and specified characteristics of the good. SP methods have been used primarily to map preferences for public goods where positive externalities are involved, such as environmental resources, and were introduced to the public in the 1970s (Vredin Johansson 1999:1, 3).
A wide range of research exists that assess consumer acceptance of GM foods in monetary terms, through estimations of willingness to pay (WTP) for a specified good with certain attributes. This is usually done by eliciting by what amount their WTP for traditional goods surpass that for GM goods and thus determining the premium an individual would be willing to pay in order to avoid GM foods (Qaim 2009:681). By using the same price mechanism for GM respectively traditional foods, the difference between valuations can be studied and conclusions can be drawn about the underlying consumer preferences. Based on utility maximisation, the individual choses the good that gives him or her the most utility, when weighting the costs and the benefits of the alternatives at hand (Chege Kimenju & De Groote 2008:40).
The large part of GM consumer acceptance studies so far analyses the developed world. For example, Lusk et al. (2005) compile a summary of 25 WTP-studies for GM foods in the United States, Europe and Asia, comparing results for the different countries included and finding that the average valuation among European consumers for non-GM foods is 29 per cent higher than among Americans. This indicates stronger negative attitudes toward GM products in Europe, with a 40 per cent average WTP premium for non-GM. Another finding in the study is that estimated premiums for non-GM over GM foods are significantly lower for goods with clear consumer benefits, such as increased nutrition or shelf life (Lusk et al.
16 2005:36, 38). More generally, consumer acceptance studies in the US find a majority in favour of -or at least not opponent to- GM foods. Reservations are found in relation to health risks, while simultaneously more informed people (particularly those with higher levels of science education) tend to be less sceptic. Another factor for optimism towards GM foods is trust in government institutions (Chern & Ganiere 2004:10).
Meanwhile, studies made on the European population show less enthusiasm. In the Eurobarometer 73.1 survey on biotechnology, respondents are on average found to see no benefits with genetic engineering, even going as far as to consider GM foods harmful or unsafe, and they do not want such crops developed on European ground. Country variations are large, with the most sceptic consumers in Greece, Latvia and Cyprus among others. The populations of the UK and the Netherlands are less pessimistic, though the results are subject to some volatility due to absence of opinions. In contrast to American consumer surveys, the Eurobarometer finds that Europeans who are aware of GM foods tend to be more negative toward these. Another finding worth noting is that, while pessimistic about own use, the majority of respondents believe GM food can be advantageous for people in developing countries (TNS Opinion & Social 2010:7, 18, 22, 29). In a study on Swedish consumer acceptance, Carlsson et al. (2004) find that respondents do not view GM food as a perfect substitute to conventional food. The authors name three potential reasons behind the general European reluctance to accept GM food: scares such as BSE (the “mad cow disease”), successful campaigns by environmental activists, and cultural traditions concerning food and produce (Carlsson et al. 2004:9).
Contingent valuation can furthermore be used for evaluation of policy decisions on GMOs, by measuring the preferences of the people (Lusk et al. 2005:29). In the case of African countries (excluding South Africa, Burkina Faso and Egypt, who have already cleared GM crops for commercial production) the goal is to evaluate a potential future introduction of GM crops from a consumer welfare perspective. Challenges arise from the fact that consumers are likely to have little or no knowledge about GM crops in a county where such have never been introduced. Awareness on GM technology in Sub-Saharan Africa is low, especially in rural areas, which limits the potential of consumer acceptance studies (Falck-Zepeda et al. 2013:10, 223). Birol et al. (2009) attempt this by mapping consumer preferences for GM bananas among the Ugandan rural and urban population, using an experimental SP method. The study concludes that the population segments that are most likely to favour GM technology are rural banana-producers with little income and large families, in areas prone to pests and diseases.
17 Quite opposite to the findings in developed countries, this segment would be willing to pay a premium for GM bananas over traditional ones, and thus, GM versions of the Ugandan staple food are found to be a pro-poor technology for small-scale farmers (Birol et al. 2009:28). This finding is consistent with the overall results of WTP studies on GMOs in Sub-Saharan Africa, which show greater reluctance toward biotechnology in richer, urban segments of the population and higher estimates of WTP among rural consumers (Falck-Zepeda et al. 2013:223).
As for the Kenyan market, consumer acceptance of GM foods has been studied by Kimenju and De Groote (2008). Applying a contingent valuation method for preferences on maize meal, they elicited a higher consumer WTP for GM than for traditional maize among the population of Nairobi, a premium estimated to 13,8 per cent. 68 per cent of the studied population were willing to pay the same price for GM as for their normal brand of maize meal. In short, respondents were generally positive to an introduction of GM maize, but voiced concerns over adverse environmental effects and loss of land races. Consumers who are aware of GM technology tend to be more influenced in their attitudes by negative and unscientific claims of GM effects, than by empirical evidence of beneficial effects. 38 per cent said to be aware of GM crops. Attitudes differ significantly from those documented in Europe, but follow patterns of consumers in other developing countries such as China and Colombia (Chege Kimenju & De Groote 2008:43-44).
4. Method
4.1 Survey and sample
In order to study the attitudes towards GM food crops among Kenyan small-scale farmers, a survey estimating individual willingness to pay for maize was carried out during four weeks in May and June 2013, in the Migori and Busia counties of western Kenya. From each county, all but the most remote and hard-accessed districts were targeted, with an aim of even sample sizes from each district. Since no controlled randomization was deemed possible, the sample from each district comprised those who made themselves available for an interview. In practice, this means an uneven sample distribution geographically, but since the population across all districts was relatively homogenous, it is given little emphasis. The interviews were
18 done one-on-one with the assistance of a translator, in the setting on the respondent’s local village.
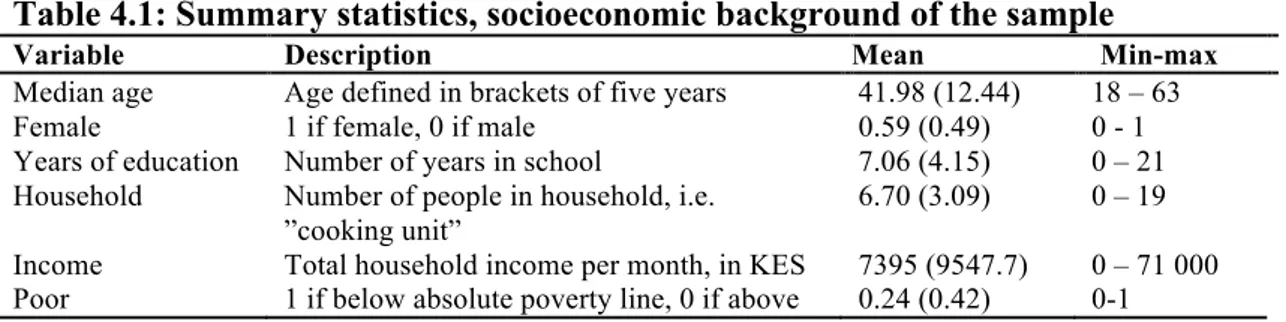
The number of included responses reached 210. A first test round of eight interviews were done to try the questionnaire, but were later excluded from the final sample due to survey construction imbalance. Table 4.1 displays some of the main characteristics of the survey sample. The share of women and elderly in the sample is relatively high, 59 per cent women and an average age of 42 years. This is most likely due to presence on the farm premises during daytime, when many men are out looking for temporary labour. The majority in the sample have attended, but not finished primary school, while a small share in each end have never attended school, or hold a college or university degree. On average, the farmers have charge of feeding seven people in their household, including themselves. This measure differs significantly between men and women, since prevailing traditions of polygamy means that many men count their cooking units for several wives and their respective children, while women count only their own family. As for income, the raw data measure is skewed due to large outliers, whereby the average monthly income of 7396 KES (approximately 87 USD) badly reflects the actual economic status of the sample. For reference, the median income in the sample is 4000 KES. To better describe their situation, a variable for absolute poverty was created, defined as household income below 1,25 USD per day, converted into purchasing power parity-adjusted KES.2
According to this calculation, 25 per cent of the sample population are living below the absolute poverty line, with less than 1500 KES per month.
Table 4.1: Summary statistics, socioeconomic background of the sample
Variable Description Mean Min-max
Median age Female
Years of education Household
Age defined in brackets of five years 1 if female, 0 if male
Number of years in school
Number of people in household, i.e. ”cooking unit” 41.98 (12.44) 0.59 (0.49) 7.06 (4.15) 6.70 (3.09) 18 – 63 0 - 1 0 – 21 0 – 19
Income Total household income per month, in KES 7395 (9547.7) 0 – 71 000
Poor 1 if below absolute poverty line, 0 if above 0.24 (0.42) 0-1
Note: Numbers within brackets are standard deviations. N = 210 for all variables. 1 USD ≈ 84,7 KES (2013-10-21).
2 1,25 USD/day is the World Bank definition of absolute poverty, since 2005 (The World Bank 2008). Exchange
19 The survey had three main sections: first, basic socioeconomic background data of the respondent was collected, along with general questions on farming and maize. In the second section, the hypothetical market scenario was described in the following way: When
answering the questions, imagine you are buying a 2 kg tin (gorogoro) of dried white maize in
the local market where you live, at this present time of year.3 The respondent was faced with a
chart of four different types of “hypothetical” maize varieties, two of which represented GM varieties and two of which characterised traditional (land race) varieties of maize. Facing one at a time of these four crops, the respondent was asked the two questions: Would you buy a
gorogoro of dried white maize with the following description? and secondly, If yes: which of these prices represents the maximum price you would be willing to pay for it? (in KES). The
purpose of the former questions was to give the respondent the choice of “opting out”, which is required in order for the choice set of preferences to be complete. In the case of a negative answer, WTP was noted at zero. Seeing as the respondents are both producers and consumers of maize, they were asked to state their answers specifically as consumers.
The second question was asked while displaying a “price sheet” with five close-ended maximum price options, ranging from 30 to 130. These prices reflect the fluctuation of the local market prices, from 30 during harvest season when maize is readily available, to 130, representing a higher price than even the worst drought periods normally induce. At the time of the survey, the prevalent average price in both the Migori and Busia regions converged around 80 KES per gorogoro. Between the five price options, the respondents were asked to choose one as their maximum WTP, while encouraged to think analytically and let the prices reflect preferences among the varieties displayed. This method, which can be classified as a stated preference contingent valuation study, was based loosely on Vredin Johansson (1999), Chege Kimenju and De Groote (2008) and Birol et al (2009), but modified for the sake of interview simplicity and in order for the survey to better fit the purpose. Theoretically, it is not of importance to this study that the WTP for GM maize represents the actual supposed price in case a transgenic crop were introduced on the market. The essential object is rather for respondents to easily identify with the prices, and therefore state their preferences for traditional and biotechnology crops in a comprehensive manner. Hence, the aim of this study is not to find a definite reservation price for GM food, but rather to investigate if the WTP
3 A gorogoro is the local entity used when buying maize, and the white variety is the most commonly used. The
custom is to dry the maize seeds, after which they are ground into meal and boiled with water to make ugali. Since the locals rarely eat maize in any other form, this was the preferred way to form the questions, as opposed to ask about fresh maize on the cob.
20 differs between food crops with traditional and GM attributes. Lastly, the third part of the survey asks a few basic questions about the interviewee’s awareness on GMOs, in order to derive a basic understanding of whether or not the rural population is conscious about the national debate concerning these.
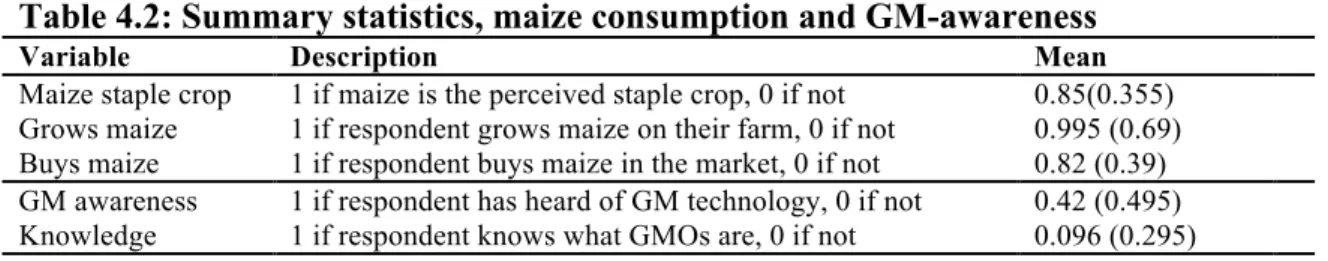
Maize was the obvious choice of crop to be studied, since estimations of WTP have been proven to perform better results, the more familiar the situation of the hypothetical market is to the interviewee. In western Kenya, the vast majority eat maize daily, and indeed 85 per cent of the farmers in the survey specify maize as their main staple crop. Moreover, 82 per cent say they buy maize on the market, and as many as 99,5 per cent grow maize on their farm (see table 4.2 for full statistics). Based on these facts, the main question of the sample was considered to be an everyday situation for the respondents, to which they would likely give accurate answers. When faced with the question of WTP for GM maize, the farmers were asked to state their answers as consumers. It is however not possible to completely distinguish whether or not the respondents’ answers have been influenced by their role as producers. Evidently the yield from a single farm is not enough to sustain the household all year, meaning most families are forced to purchase food at least some months and giving them this double role.
Table 4.2: Summary statistics, maize consumption and GM-awareness
Variable Description Mean
Maize staple crop Grows maize Buys maize
1 if maize is the perceived staple crop, 0 if not 1 if respondent grows maize on their farm, 0 if not 1 if respondent buys maize in the market, 0 if not
0.85(0.355) 0.995 (0.69) 0.82 (0.39) GM awareness
Knowledge
1 if respondent has heard of GM technology, 0 if not 1 if respondent knows what GMOs are, 0 if not
0.42 (0.495) 0.096 (0.295) Note: Numbers within brackets are standard deviations. N=210 for all variables expect
Grows maize (N=207) and Knowledge (N=208)
4.2 Survey attributes for GM and traditional maize
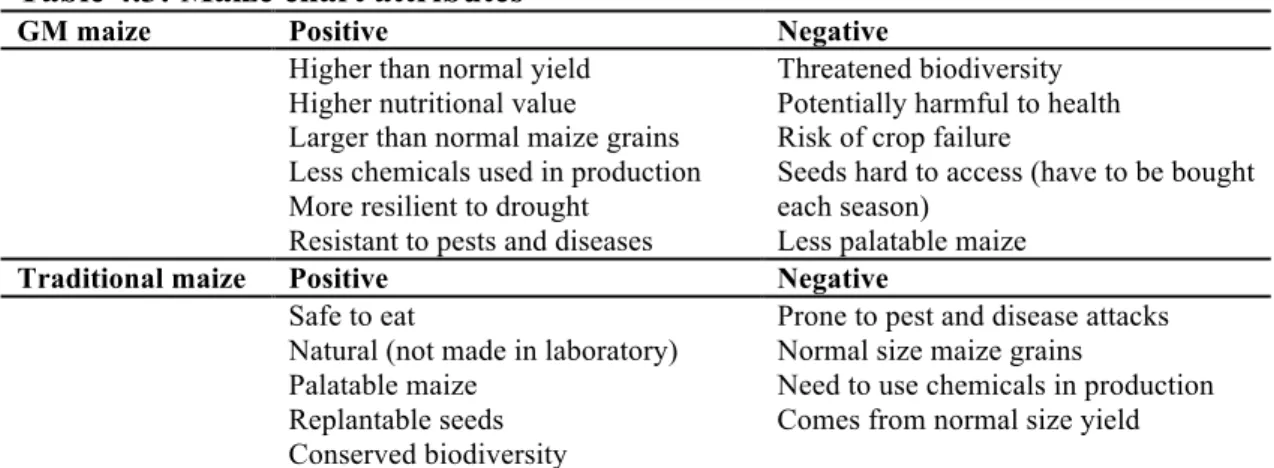
In total, a number of 30 different maize charts containing four randomised varieties of the crop were used for the surveys. Table 3.3 presents a list of the positive and negative traits used to describe GM and traditional maize in the survey. The attributes are based on material from both representatives of agricultural biotechnology and of organic farming, as well as from sources deemed neutral. Thus, the attributes are thought to be a balanced opinion between the environmental movement, the industry and the academic stand. The final list of attributes reflects the most important pros and cons of GM technology, enabling respondents
21 to quantify their preferences for the grouped attributes without requiring prior knowledge on what genetic modification entails. The issue of describing GM crops to respondents unaware of the technology is one that has to be tackled in all developing country consumer acceptance studies. Approaches vary from presenting a detailed lecture on biotechnology, as in Birol et al. (2009) to a shorter written introduction on the subject, tried by Chege Kimenju & De Groote (2008). In this study the presentation is left out altogether, with the intention of not persuading any individual to a certain stand according to descriptions. Simply presenting different traits and asking for quantified opinions about these is an attempt at sidestepping the issue, while enabling an analysis of how different descriptions form individual opinions about GMOs.
The attributes were randomly assigned four-by-four into “varieties” of maize, of which two on each chart represent the traditional technology crops and the other two corresponding to GM crops. For each variety of the crop, two negative and two positive attributes were included, to represent the trade-off between costs and benefits.
Table 4.3: Maize chart attributes
GM maize Positive Negative
Higher than normal yield Higher nutritional value
Larger than normal maize grains Less chemicals used in production More resilient to drought
Resistant to pests and diseases
Threatened biodiversity Potentially harmful to health Risk of crop failure
Seeds hard to access (have to be bought each season)
Less palatable maize
Traditional maize Positive Negative
Safe to eat
Natural (not made in laboratory) Palatable maize
Replantable seeds Conserved biodiversity
Prone to pest and disease attacks Normal size maize grains
Need to use chemicals in production Comes from normal size yield
The first positive aspect of GM maize, higher than normal yield is subject to some debate. On the one hand, the UN-led International Assessment of Agricultural Knowledge, Science and Technology for Development (IAASTD) find unconvincing evidence that the impact of GMOs on yield is positive (PANNA 2010:5). On the other hand, increased yields have been reported internationally from plantation of GM crops, notably in cases where prior underuse of chemicals to counter pests have augmented the benefit of Bt crops (The World Bank 2007:177, Qaim 2009:672). Closely linked to this is the trait of larger than normal maize
22 consumer benefit for the respondent.The two traditional maize attributes comes from normal
size yield and normal size maize grains were chosen in direct opposition to these, since the
“negative” side of traditional maize in these cases are supposed to be evaluated in contrast to GM maize.
The first generation GM crops include improved resistance to pests and diseases, such as Bt cotton and maize. Agricultural biotechnology have the potential to create crops with resistance to specifically African pests, such as Striga weed and weevils (The World Bank 2007:178, Chege Kimenju & De Groote 2007:36, 45), which lead to the choice of including
resistant to pests and diseases as a positive GM attribute. In contrast to this, one downside of
traditional maize can be seen as prone to pests and diseases. On the same topic, the attribute
less chemicals used in production was chosen uninformed of the fact that very few of the
interviewed farmers have the economic means to access any agricultural chemicals at all. In theory, use of GM crops lead to reduced amounts of insecticides and pesticides in production (The World Bank 2007:177), but this trait proved somewhat redundant in the chosen sample. For African subsistence agriculture, the intended benefit is a variety that performs well even without chemical insecticides, such as Bt maize has the potential to do (Qaim 2009:670). Following the same logic, the traditional maize attribute need to use chemicals in production is to be regarded from a modern farming perspective, as necessary in order for modern non-GM varieties to perform well.
Another issue in tropical agriculture, believed to increase in pace with global warming, is that of extreme drought between rainy seasons. With modern biotechnology it would be possible to manually create food crops more resilient to drought that can endure such environmental stress (Chege Kimenju & De Groote 2007:45). However, several reports on GM crops caution that the plants need to be adapted to the environment in which they are to be introduced. Failing to do so, the GMOs are likely to perform worse than conventional types, and certain cases of complete crop failure have been reported (Qaim 2009:673).
The “second generation” GM food crops are largely focused on consumer benefits such as
higher nutritional value, as for example the “Golden Rice” containing high levels of vitamin
A (The World Bank 2007:177). In the developing world, this would help target malnutrition and lead to health benefits among the poor (Qaim 2009:666, 668).
23 Other benefits and risks are more perceived than proven, though still as important. One such perceived consumer cost is that GM maize would somehow be inferior in taste and quality compared to traditional foods: less palatable as opposed to palatable (Greenpeace 2006:2). This is similar to the idea that traditional foods are superior simply because they are natural
(not made in laboratory), expressed by the movement for organic food (Eyhorn et al. 2002:8).
On the topic of human health risks and GM foods, there are many voices raised and very few actual facts. The trait potentially harmful to health was chosen to represent the widespread fear in both Europe and Africa, that GM foods have deleterious effects on consumers. According to certain reports, no evidence has been found of adverse effects on human health (The World Bank 2007:178). On the other hand, a controversial paper by Séralini et al. (2012) caused outraged debate worldwide, after finding that consumption of GM maize caused rats to develop cancer (Séralini et al. 2012). Despite its recent withdrawal by editors of the publishing journals due to questionable methods by the authors, the report has grounded a view of GM crops as something hazardous (Willingham 2012). As a counterweight for traditional maize, the attribute safe to eat was chosen (IAASTD 2009:42).
The attribute seeds hard to access (have to bought each season) represents an issue concerning social equity, as the farmers would not be able to use their traditional method of storing and replanting seeds each season, due to IPRs that prohibit replanting seeds. Hence, farmers would see their costs increase and the ready availability of seeds decline (PANNA 2010:7). These strict patent rights also imply that crops closely related to the GMO cannot be grown in direct contact with it, since the non-GM crop risks contamination from pollen and seeds containing GM traits. Apart from potential economical consequences, critics warm that this contamination of indigenous crops would lead to threatened biodiversity (PANNA 2010:6). Another aspect of biodiversity is that the transition towards modern agriculture generally implies increased monocropping. In contrast, traditional farming methods safeguard
conserved biodiversity by necessity, by providing for the household’s every need and thus
producing replantable seeds for next season (Eyhorn et al. 2002:28).
4.3 Data analysis approach
The first step in analysing the survey is to determine whether the stated willingness to pay for maize among Kenyan small-scale farmers differ between GM and traditional technology. The mean maximum WTP for maize varieties in the sample are calculated separately, resulting in
24 four average WTP figures: two each for GM and traditional varieties. These were then combined into separate averages again, to form one mean WTP for GM maize and one mean WTP for traditional maize. The two separate WTP means were then compared using a paired sample t-test, meaning that the difference between the WTP for GM and traditional maize was compared for each observation in the sample, to see whether they differ significantly. When comparing two means in a t-test, the test variable is defined as the difference between the two separate average means in the sample:
d0 = µtrad - µGM
The null- and alternative hypotheses are therefore: H0: d0 = 0 vs. H1: d0 ≠ 0
Here, µ symbolises the sample mean of GM respectively traditional crops. In theory, if the means differ significantly, then this indicates that the population preferences differentiate between the two technologies. Specifically, a negative difference would confirm the hypothesis of the first research question posed in this paper.
To address research question number two, the attributes used to describe the maize varieties are studied in their effects on WTP. Drawing on Vredin Johansson (1999), a two-step model is used that first analyses the determining factors of the decision whether to buy the maize variety or not, and then examines the determinants of the stated non-zero maximum price. This allows for separating the potentially different decision-making processes of the discrete (yes or no) consumption choice versus the continuous expenditure choice of how much to pay. In the analysis, the explaining factors are the same, namely the eleven attributes for GM maize and the nine attributes for traditional maize. However, these could have different influential power on the two separate decisions, whereby the analysis is separated in two stages. Another reason for this division is the fact that regression analysis on continuous WTP becomes more stable with only non-zero answers included. The two phases of the analysis are both performed using linear regression with OLS estimation. For each of the twenty attributes a dummy variable is created, which is 1 if the attribute shows up on the maize variety in question, and 0 if it does not.
Stage one is an estimation of the influence of each attribute on the decision whether or not to purchase the maize type. For this purpose, two binary variables are created to represent the consumption choice of GM and traditional maize respectively. Each attribute is then run
25 separately on the relevant consumption choice-variable; GM attributes one at a time on the GM consumption choice and vice versa. In this case single regression is deemed more suitable, since the variables are of interest separately, and have no intentional relation among each other. Each attribute has been allocated to a “variety” by randomisation, and if they covariate with any of the other variables, it is not by construction. The model specification for the first set of regressions is therefore the ordinary linear probability model with one binary regressor (Stock & Watson 2012:427, 195):
Yi = β0 + βiDi + ui
With a probability distribution of: Pr (Y=1|Xi) = β0 + β1D1
In the second step, the influences of each attribute on the expenditure choice WTP are estimated, including only non-zero responses. The difference in WTP between traditional and GM maize varieties is the dependent variable. It is created by calculating the difference between the first traditional, respectively GM, crops to appear on one chart pairwise, and then repeating for the two second types of each kind. The sample is treated as panel data since each respondent in fact has two listed differences in WTP (trad1-GM1 and trad2-GM2), thus resulting in two observations per entity. This means that the first OLS assumption of an unbiased error term does not hold, since the standard errors of the observations are automatically pairwise correlated. To correct for this, clustered standard errors were used, treating each respondent’s two observations as one entity (Stock & Watson 2012:166, 406). The model specification is slightly changed from that used in step one, with the differences that the dependent variable is now continuous, and the standard errors clustered.4
5. Results and discussion
5.1 Difference in willingness to pay
In order to address question (1) of this paper, the two separate average WTP sums were calculated and compared. The results are presented in Table 5.1, and show a considerably
26 higher average WTP for traditional than for GM maize: KES 61.1 versus 42.7. The estimated price premium for traditional maize is thus 43 per cent. This indicates a result in conflict with the assumed outcome. Worth noting is that the maximum total WTP for GM maize is 130, meaning that one or more respondents have stated the absolute highest discrete choice for both GM crop one and two. In comparison, the highest WTP for traditional versions is only 117,5. The main result of this analysis however, is that the two average WTP figures are significantly different, as shown by the subsequent hypothesis test. The computed t-score of 6.58 show that the probability of average WTO for GM and traditional crops being the same is zero per cent. With a two-sided test using the student-t distribution t = 6.58 > 2.58, and so the H0 is rejected at the 1 %-level (Stock & Watson 2012:793).
Table 5.1: Results of willingness to pay analysis, step one
Mean Min Max
WTP traditional maize 61.1 (1.94) 0 117.5
WTP GM maize 42.7 (2.10) 0 130
Mean t-score Pr (T < t)
Difference in means 18.37 (2.79) 6.58 1.00
Note: N=210. Numbers within brackets are standard errors. Difference computed using paired sample student t-distribution with 209 degrees of freedom, testing H0: d0=0vs. H1:
d0≠0
The second subject of the study is to discern which attributes hold the most decisive power over an individual’s willingness to pay, which demands further information about the collected data on WTP. Table 5.2 presents the data set divided into separate variables for whether the respondent answered yes or no to the consumption question (Would you buy this
crop?). The discrete-choice consumption question results in two binary variables for GM and
traditional crops, where the mean represents the share of the population that gave a negative answer. The number of observations, 420, is a result of each entity being repeated in the data set, once for crop one and two and then again for number three and four. A large disparity is observed between the share of negative responses, with 18 per cent of the traditional crops being rejected, while the number for GM is as high as 46 per cent. The positive responses are measured on a continuous scale, ranging from the minimum answer of 30 to the maximum of 130. For GM varieties, there are 237 non-zero observations with a mean WTP of 76 KES. Correspondingly for traditional maize, 344 positive answers are registered and the mean WTP is somewhat lower, at 75 KES. Among these, 197 pairs of observations (GM and traditional) are found where both WTP answers are non-zero, and these form the last new variable,
27 considerably lower than the above average difference of 18.37 for all responses. The unequal number of observations for traditional and GM positive WTP would explain the fact that the difference variable is above zero, indicating a higher average figure for traditional crops. Table 5.2: Results of willingness to pay analysis, step two
Variable Description Obs Mean
Would not buy GM crop
Would not buy traditional crop Non-zero WTP GM crop Non-zero WTP traditional crop Difference in positive WTP
1 if respondent would not buy, 0 if respondent would buy 1 if respondent would not buy, 0 if respondent would buy WTP > 0 for GM
WTP > 0 for traditional [Σ(WTP trad. – WTP GM)/n], non-zero answers only
420 420 237 344 197 0.46 (0.5) 0.18 (0.4) 75.68 (31.8) 74.56 (28.4) 1.29 (38.4) Note: Numbers within brackets are standard deviations
5.2 Impact of the survey attributes
The regression analysis assessing each attribute’s influence on the stated WTP is done in two stages, corresponding to the two survey questions. Table 5.3 presents the results of the first-stage regressions, estimating the effect of the attributes on the consumption choice. Since the dependent variable here is dichotomous, the regression coefficients are to be interpreted as probabilities of Y=1, namely the event of would not buy. The attribute variables are also in themselves binary, meaning that each coefficient describes the probability of not buying the maize variety, given that a specific attribute is part of the description, compared to if it is not included. In this context, it is not obvious what the comparison case not included entails for the variety. It is taken to represent the respondent’s neutral perception of maize, likely the kind that he or she normally buys in the local market since that is the situation applied in the question. Thus, the effect of each attribute is understood as the importance that the respondent allocates to the trait, in analysing whether to pay for a crop including it or not. The constants are indicators of the mean share of negative answers to question one, weighted by how often the attribute in question is used to describe a variety and by which other traits have a tendency to appear together with them. This of course poses a methodological problem, since ideally all attributes would occur in the study in equal numbers and the model specification would adjust for covariance in attributes. The results will thus have to be interpreted with certain caution.