Driver acceptance and performance
with LDW and rumble strips assistance
in unintentional lane departures
ViP publication 2013-4
Authors
Lars Eriksson, VTIAnne Bolling, VTI Torbjörn Alm, HiQ Anders Andersson, VTI
Christer Ahlström, VTI Björn Blissing, VTI Göran Nilsson, SVMF
Preface
ViP LDW is a collaborative project within the competence centre Virtual Prototyping and Assessment by Simulation (ViP). The project comprises several partners; Volvo
Cars, the Swedish Transport Administration, SVMF (the Swedish Road Marking Association), HiQ, and VTI (the Swedish National Road and Transport Research Institute).
The project had two main objectives, to:
Study lane departures during driving on a road with rumble strips as compared
with driving a car equipped with an in-car LDW (Lane Departure Warning system).
Develop the simulator abilities and methods in order to increase the battery of
scenarios and applications.
The project started in the end of 2009 and ended late 2011. It was financed by the competence centre Virtual Prototyping and Assessment by Simulation (ViP).
Participants from SVMF were Göran Nilsson (project manager, road functionality) and Lars-Eric Svensson (road functionality).
Participant from Volvo Cars was Jonas Ekmark (LDW system functionality). Participant from the Swedish Transport Administration was Hans Holmén (road functionality).
Participants from HiQ were Torbjörn Alm (ecological secondary task), Johan Sjöstrand (secondary task programming) and Tobias Östlund (secondary task programming). Participants from VTI were Lars Eriksson (project manager at VTI, experimental design, questionnaires, measures, experimental leader, data analysis), Anne Bolling (experimental design, questionnaires, measures, experimental leader), Anders
Andersson (scenario programming, simulator setup, data acquisition), Christer Ahlström (performance data, measures), Björn Blissing (simulator graphics), Mats Lidström (simulator graphics), Laban Källgren (scenario programming), Kristina Kindgren (experimental leader, participants recruitment) and Magnus Hjälmdahl (questionnaires). Report reviews made by Martin Dillman, Scania and Sven-Olof Lundkvist, VTI, have contributed to an improved report.
To all these people as well as the test drivers and others who contributed to the project, such as the ViP Director Lena Nilsson and the ViP Board, a sincere thank you for your efforts and support.
Linköping, November 2011
Quality review
Peer reviews were performed by Sven-Olof Lundkvist, VTI, and Martin Dillman, Scania, in October 2011. Lars Eriksson made the final changes of the report manuscript. The ViP Director Lena Nilsson examined and approved the report for publication on 20 December 2013.
Table of contents
Executive summary ... 9 1 Introduction ... 11 1.1 Project Scope ... 12 1.2 Aims ... 12 2 Methods ... 13 2.1 Participants ... 13 2.2 Apparatus ... 132.3 Overall Simulator Scenario ... 14
2.4 Design and Stimuli ... 15
2.5 Questionnaires ... 23
2.6 Performance Measures ... 24
2.7 Procedure ... 25
3 Analyses and Results ... 27
3.1 Driver Attitudes and Assessments ... 27
3.2 Driver Performance ... 45
3.3 Simulator and Methods Development ... 53
4 Discussion ... 55
4.1 Driver Attitudes, Assessments and Performance ... 55
4.2 Simulator and Methods Development ... 56
4.3 Summary ... 57 4.4 Final Remarks ... 58 References ... 60 Appendix 1 - Background questions Appendix 2
- Questions after driving with LDW
- Questions after driving with rumble strips
Abbreviations
LDW Lane Departure Warning system (in-vehicle)
List of Figures
Figure 1: The VTI driving simulator SIM III with its moving base platform and a Volvo car cabin mounted on it. (Note that in the present study a Saab 9-3 cabin was used.) ... 13 Figure 2: The general design of the experiment, showing the two driving sessions, the administered questionnaires, and the division in order of driving with LDW and rumble strips. ... 15 Figure 3: The colour buffer that shows the road as it would look during daylight
conditions. ... 16 Figure 4: The depth buffer containing information about the distance from each pixel to the viewer. The lower part of the image is white because of near plane clipping. ... 17 Figure 5: The headlight information is a 24-bit numeric value encoded as 8-bit red, 8-bit green and 8-bit blue information. ... 17 Figure 6: The final render that shows the road as it would look during twilight
conditions. ... 18 Figure 7: The simulated rumble strips setup showing the rumble strips at road centre and at both lane edges. ... 19 Figure 8: The road marking closest to the left of the centre line of the vehicle is reported as left road marking, and similar for the right road marking, in the simulated Volvo LDW. ... 20 Figure 9: The radio/CD player application. ... 22 Figure 10: Illustration of the three performance measures Response completion time, Time to back in lane and Lane exceedence area in the rumble strips condition. The red lines represent the warning onset, and the green lines represent the time for completion of the driver’s steering wheel reversal response (upper graph) and the time when the vehicle is back in the lane (lower graph). The shaded area (lower graph) represents the Lane exceedence area, with the horizontal line showing the decision boundaries for when the vehicle is outside the lane. ... 25 Figure 11: Mean values of general attitude towards LDW and rumble strips before and after warning exposures in the driving sessions. Means ±SE. Scale from very negative (1) to very positive (7). ... 28 Figure 12: Mean values of trust in LDW and rumble strips before and after warning exposures in the driving sessions. Means ±SE. Scale from very little trust (1) to very
much trust (7). ... 29
Figure 13: Main effect of warning exposure on trust (means ±SE). Scale from very little trust (1) to very much trust (7)... 30 Figure 14: Main effect of warning type on trust (means ±SE). Scale from very little trust (1) to very much trust (7). ... 30 Figure 15: Mean values of usefulness of LDW and rumble strips before and after warning exposures in the driving sessions. Means ±SE. Scale from very negative (-2) to very positive (+2). ... 31 Figure 16: Mean values of satisfaction of LDW and rumble strips before and after warning exposures in the driving sessions. Means ±SE. Scale from very negative (-2) to very positive (+2). ... 32
Figure 17: Main effect of warning exposure on satisfaction, means ±SE. Scale from very negative (-2) to very positive (+2). ... 33 Figure 18: Main effect of warning type on satisfaction, means ±SE. Scale from very negative (-2) to very positive (+2). ... 33 Figure 19: Mean values of realism of LDW and rumble strips drives. Means ±SE. Scale from not at all realistic (1) to very realistic (7)... 34 Figure 20: Mean values of distraction load for LDW and rumble strips drives for the groups starting with different warning types. Means ±SE. Scale from not at all
burdening (1) to very burdening (7). ... 37 Figure 21: Mean values of warning benefit of LDW and rumble strips for the groups starting with different warning types. Means ±SE. Scale from not at all (1) to very much (7). ... 38 Figure 22: Mean values of warning timing of LDW and rumble strips for the groups starting with different warning types. Means ±SE. Scale from very late (1) to very early (7). ... 39 Figure 23: Response frequencies of which drive the participants considered most risky. (Because one participant did not respond, one response is missing.) ... 40 Figure 24: Response frequencies of whether the participants experienced any difference between the two driving situations, with LDW and rumble strips, respectively. (Because one participant did not respond, one response is missing.) ... 41 Figure 25: Response frequencies of which warning the participants preferred. (Because one participant did not respond, one response is missing.) ... 43 Figure 26: Mean lateral position of the car on the road from the time of warning (at Time =0) and 10 s onwards, for the LDW and rumble strips conditions divided into induced yaw motion to the left and to the right when driving straight ahead, in a curve to the left and in a curve to the right. The bold blue and red lines indicate mean lateral position of the car over time for the LDW and rumble strips conditions, respectively. The light blue and light red lines represent ±SD of the responses to each warning type. The centre line and the edge line of the road are located at lateral positions near 0 m and -3 m, respectively. ... 47 Figure 27: Main effect of group on Response completion time (means ±SE). ... 48 Figure 28: Main effect of warning type on Response completion time (means ±SE).... 49 Figure 29: Mean values of Response completion time with LDW and rumble strips for the groups starting with different warning types (means ±SE). ... 49 Figure 30: Mean values of Time to back in lane with LDW and rumble strips for the groups starting with different warning types (means ±SE). ... 50 Figure 31: Main effect of group on Lane exceedence area (means ±SE). ... 51 Figure 32: Mean values of Lane exceedence area with LDW and rumble strips for the groups starting with different warning types (means ±SE). ... 51 Figure 33: Mean values of SD of lateral lane positions with LDW and rumble strips for the groups starting with different warning types (means ±SE). ... 52
List of Tables
Table 1: Lateral motion with 3 seconds of induced yaw motion at different constant vehicle speeds. ... 21 Table 2: Participant comments on realism of the simulation of the LDW drive. No comments made by the participants are indicated with “-“. ... 35 Table 3: Participant comments on realism of the simulation of the rumble strips drive. No comments made by the participants are indicated with “-“. ... 36 Table 4: Participant comments on the motivation of choice of most risky drive. ... 40 Table 5: Participant comments on what differentiated the drives with the two warning types. ... 42 Table 6: Participant comments on what motivated the chosen preference... 43
Driver Acceptance and Performance with LDW and Rumble Strips
Assistance in Unintentional Lane Departures
by Lars Eriksson1, Anne Bolling1, Torbjörn Alm2, Anders Andersson1, Christer
Ahlström1, Björn Blissing1 and Göran Nilsson3
1 Swedish National Road and Transport Research Institute, VTI
2 HiQ
3 The Swedish Road Marking Association, SVMF
Executive summary
Intervention in car driving for warning of unintentional lane departure may effect significantly safer driving, and rumble strips milled into the road. In-vehicle lane departure warning system (LDW) can deliver such warnings. In the ViP LDW project reported here, the focus of investigation was whether drivers more readily accept either rumble strips or an LDW, from using these types of warning as caused by unintentional lane departures in a driving simulator. The project also investigated whether there are any noticeable differences, in driving performance or driver response, between using rumble strips and using an LDW in unintentional lane departures. Neither long-term effects nor effects of nuisance warnings of primarily intentional lane departures were investigated.
Twenty-four drivers volunteered to participate, of which 11 were women and 13 were men. Each of them drove the VTI driving simulator SIM III in car mode with simulated rumble strips in one drive and with a simulated Volvo LDW in another drive. A forced yaw motion of the vehicle induced unintentional lane departure while the driver shifted visual attention from the road to attend jammed music coming from a simulated
radio/CD-player. Each drive was set up to include 13 events of forced yaw motion coupled with jammed music. Each drive took about 25 minutes to complete.
The contribution to the ViP technical platform/methodology includes; twilight driving conditions developed and tested; radio/CD-player for more ecologically correct distraction functionality developed and tested; simulated Volvo LDW functionality refined and tested; and Lane exceedence area used as measure of lane departure. The results show that while the participating drivers showed more satisfaction from using the LDW, they also showed more trust in the rumble strips. The drivers’
preferences for warning type revealed no clear overall choice in favour of the LDW or the rumble strips, but a clear preference for having a function that warns for
unintentional lane departure. Several participants (i.e. 25%) thought it was good to have both types of warning in parallel. Although Response completion time was shorter with the rumble strips warning there was no difference between the warning types, neither in Time to get car back in lane nor in Lane exceedence area. Thus, there were no major overall differences between the LDW and the rumble strips as measured in the present study.
Our conclusion is that the drivers’ acceptance, as well as performance, was high for both the rumble strips and the LDW. The positive opinion on the need for assistance systems in unintentional lane departure when drivers are directing their visual attention away from the road is thus further strengthened.
1
Introduction
Driving on rumble strips milled into the road at road markings generates vehicle vibration and sound that can warn for lane departure. For highways, it has been estimated that rumble strips at the centre line have reduced accidents by about 15%, while rumble strips on the shoulder have effected an accident reduction of
approximately 40-50% (e.g. Anund et al., 2008; Mahoney et al., 2003; Persaud, Retting, & Lyon, 2004). The reductions in accidents are considered to be caused by a decrease in unintentional lane departures uncorrected for or responded to too late by the driver. However, such estimated accident reductions are challenging. For example, a before-after study at VTI indicates that rumble strips at the centre line have no reduction effect on accidents (Carlsson, 2010).
Still, intervening in car driving by warning for unintentional lane departure may effect significantly safer driving. It seems that an unintentional lane departure caused by a sleepy or distracted driver can be significantly less risky simply by the presentation of a real-time warning of the current lane-departure event. Rumble strips and/or an in-vehicle lane departure warning system (LDW) can deliver such a warning. The in-vehicle can host a system (an LDW) that registers lane departure, by using readings of road marking positions relative to the car, and indicates lane departure by delivering for example a sound in the car cabin.
In Sweden rumble strips in the road are not allowed when housing areas are closer to the road than 150 m. Besides, one can assume that rumble strips are not likely to be used on all allowed road stretches. In addition, the presence of ice and/or packed snow on the rumble strips may significantly degrade their performance in alerting the driver. LDW systems can be used on all road stretches irrespective of the distance to housing areas. Still, somewhat similar to rumble strips LDW systems put requirements on the road environment, i.e. on road features like road marking quality and visibility, in order to function with an acceptable performance (Lundkvist & Fors, 2010; Thorslund, Anund, & Hjälmdahl, 2006). Moreover, an LDW is of course dependent on the proper functioning of car electronics and other included technology.
Another issue concerns whether drivers more readily accept rumble strips or an LDW. For example, a likely LDW advantage for acceptance is that the warning from an LDW can be supressed by activation of the direction indicator prior to exiting the driving lane, whereas rumble strips are effective and warn even in intentional lane departures.
Normally an LDW includes also other criteria for suppression of the warning, examples are speeds lower than a predefined value and high lateral and longitudinal accelerations indicating active driver inputs. A possible rumble strips advantage for acceptance may be that they can be experienced as generating a more aggressive or annoying warning, which can be an advantage in that it may more promptly alert a sleepy or distracted driver in unintentional lane departures.
Connected to this acceptance issue; are there any noticeable differences to be found in driving performance or driver response between using rumble strips and LDW in unintentional lane departures?
1.1
Project Scope
The scope of the project was to study effects of lane departure warnings in a driving simulator. The involved drivers should compare effects of one type of rumble strips with effects of the type of LDW used in Volvo cars.
1.2
Aims
The project aims were to:
1. Conduct research regarding lane departures, during car driving with rumble
strips milled in the road compared to driving an LDW-equipped car.
2. Develop methods and simulator abilities in order to increase the battery of
scenarios and applications.
The primary focus was to bring about lane departures that were unintentional in
character for the drivers, and to extract the drivers’ ratings and assessments pertaining to the two studied ways of delivering lane departure warnings (rumble strips and LDW). An additional focus was to assess the drivers’ performance using some chosen relevant performance measures.
1.2.1 Research
The research intended to include studying:
- Drivers’ general attitudes towards LDW and rumble strips.
- Drivers’ assessments of the LDW and the rumble strips from experiencing
one of these at a time in lane departures.
- Drivers’ performance from experiencing the LDW and the rumble strips,
respectively, in lane departures.
- The driver distraction functionality of an implemented radio/CD-player as
coupled with a preconditioned secondary driver task. 1.2.2 Simulator and methods development
The simulator and methods development intended to include implementing:
- LDW functionality simulating an operational Volvo system.
- Conditions for night-time or twilight driving.
- Radio/CD-player with more ecologically correct driver distraction
2
Methods
2.1
Participants
Twenty-four drivers volunteered to participate in the study (11 women and 13 men). They were paid 400 SEK as compensation for their participation.
The recruitment criteria required the participants to have held their driving licenses for at least 5 years, not be professional drivers, and have a driving mileage of at least 5000 km per year.
The participants had a mean age of 39 years (range 24-62 years), had held a driving license for on average 20 years (range 0.5-48 years) and drove on average (estimated) 14350 km per year (range 1500-22500 km). Two participants did not conform to the recruitment criteria; one because of having held the driving license for about 0.5 years and having an estimated driving mileage of 3000 km per year, and another for having an estimated driving mileage of 1500 km per year.
2.2
Apparatus
The VTI driving simulator SIM III (VTI, 2011) was used in the study, see Figure 1. It has a moving base with a high performance motion-base system. This VTI simulator is used mainly for experiments involving passenger cars and is the first-hand choice when severe handling manoeuvres and cabin motions or realistic road sensations are
prioritised.
The forces generated by the motion-base system involve linear motion, tilt motion and vibration. The linear motion was used for the car’s lateral motion directions, and the tilt motion was used for the roll and pitch directions to simulate sustained accelerations such as driving in a curve or longitudinal acceleration and deceleration. For the linear motion, maximum speed is ±4.0 m/s and maximum acceleration is ±0.8 g. The performance for pitch angle is between -9° and +14° and for roll angle ±24°. The vibration table provides additional capabilities to generate road roughness for higher
Figure 1: The VTI driving simulator SIM III with its moving base platform and a Volvo car cabin mounted on it. (Note that in the present study a Saab 9-3 cabin was used.)
frequencies and its vertical motion, roll angle and pitch angle are ±6.0 cm, ±6° and ±3°, respectively.
A Saab 9-3 car cabin was mounted on the motion platform and used in all driving sessions. The visual system consists of three DLP projectors providing a 120° forward field of view. The projectors have a spatial resolution of 1280 × 1024 pixels with edge blending and geometrical correction provided by a dedicated graphics card. Three LCD displays are used for visual presentations in the rear view mirrors.
The sound system consists of five speakers, of which two are placed in the dashboard close to the windscreen, one in each front door, and one in the rear of the cabin. A separate computer, which can play sound in any of the five speakers, controls the speakers. The control of the sound interacts with the simulated environment through the simulator network. To generate vibrations when driving over the rumble strips a
ButtKicker low frequency transducer, mounted beneath the driver under the car cabin, was used.
A touch screen with a spatial resolution of 800 × 600 pixels was used for simulating a radio/CD-player.
2.3
Overall Simulator Scenario
The overall scenario was a car drive with an LDW-equipped car or with rumble strips at the road’s edge and centre lines. The drive was performed in twilight on a road of varying straight stretches and curves. The simulated road was 8 m wide with 1 m wide shoulders and one 3 m wide lane in each driving direction. The choice of road type aimed at making the participants more comfortable and safe with leaving the lane especially to the right onto the shoulder. The driver tasks were to drive normally at 90 km/h, keep both hands on the steering wheel and stay in the driving lane while listening to music coming from the radio/CD-player in the car. The radio/CD-player started to function incorrectly by the jamming of the played music at several occasions during the drive. At these moments, the driver’s primary concern was to immediately take care of this by pushing the radio/CD-player button for next tune. The intention with this task was to make the driver change point of gaze from the road to the radio/CD-player before s/he pushed the button.
To induce unintentional lane departures in each drive, 13 reorientations of the car’s heading, i.e. yaw motions, were induced from outside the driver-vehicle control loop without the driver’s knowledge. The yaw motion started 0.2 s after the music had started to be jammed and could not be sensed through the steering wheel, only
marginally or not at all through the rest of the vehicle. The intention with having a time discrepancy between onsets of jammed music and induced yaw motion was to make it plausible that the driver would not notice this motion in the visual presentation of the driving environment because s/he would be looking down on the radio/CD-player. If the driver kept point of gaze on the road, naturally quick and short steering movements in the opposite direction could easily null the induced motion (shown in the visual
presentation). The experience of the induced (visual) motion was not explicitly strange but rather like a conceivably natural disturbance occurring, such as a short-lived wind gust.
Each drive was setup to include 19 occasions of jammed music. In twelve of these, induced yaw motions appeared and warnings were given according to the LDW or the
rumble strips. Yaw motion was to the left or right in curves and on straight stretches. The yaw motions appeared at fixed positions along the drives, but it was difficult for the drivers to predict where they would happen because of the variation in left/right yaw motion and because induced yaw motion did not occur together with all the jammed radio/CD-player events.
When lane departure occurred, the driver task was to directly correct for this and then to continue to drive normally at 90 km/h, keep both hands on the steering wheel and stay in the proper driving lane.
Each drive also included six events of overtaking a car, parked to the right and slightly off the driving lane, at unevenly distributed positions along the road. To overtake the car the driver intentionally departed from the driving lane to the left and was instructed to use the direction indicator before leaving the lane. No other vehicles or road users were included in the scenario.
2.4
Design and Stimuli
2.4.1 Experimental design
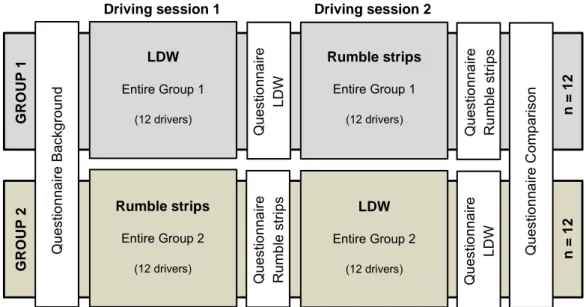
The experiment had a repeated measures design with two treatment levels, which were driving with the simulated rumble strips and the simulated LDW system, respectively. Half of the participants started driving with the LDW and the other half with the rumble strips. Figure 2 shows the general design of the experiment. Division of the participants into two groups, ‘Group 1’ and ‘Group 2’, indicates the balancing of presentation order of the two warning systems over the two groups of participants. Types of questionnaire administered before, in between and after driving sessions are also indicated Figure 2.
G RO UP 1 n = 12 G RO UP 2 n = 12 Q ue sti onn ai re B ac kgroun d Q ue sti onn ai re LDW Q ue sti onn ai re Rumb le s tri ps Q ue sti onn ai re Rumb le s tri ps Q ue sti onn ai re LD W Q ue sti onn ai re C om paris on LDW Entire Group 1 (12 drivers) LDW Entire Group 2 (12 drivers) Rumble strips Entire Group 1 (12 drivers) Rumble strips Entire Group 2 (12 drivers)
Driving session 1 Driving session 2
Figure 2: The general design of the experiment, showing the two driving sessions, the administered questionnaires, and the division in order of driving with LDW and rumble strips.
Note that the repeated measures design with the two treatment levels was analysed as a mixed design in some of the statistical analyses because one group started with the LDW and the other group started with the rumble strips. That is, a mixed design in some of the analyses was used to test for any possible order (or group) effects. Thus, in the mixed design analyses the grouping factor was which warning system, or type of warning, the participants started with. (See sections 3.1.1 and 3.2.1 for the analyses.) 2.4.2 Twilight driving
Since the project needed simulating twilight conditions the graphics software in the simulator had to be extended with night driving functionality. It was decided to realise a simplified night driving mode in which only the own car’s headlights would be
simulated. The method used to achieve the wanted effect was to:
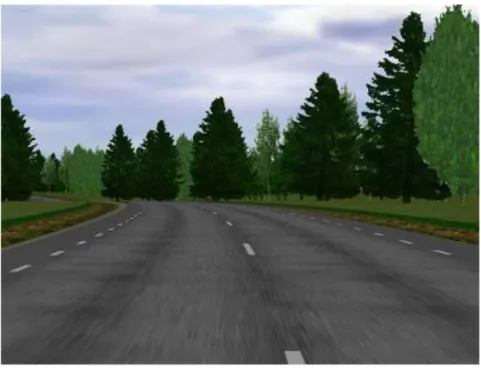
1. Render the normal image, as it would look during daylight conditions. Figure 3
shows this image, called the colour buffer.
2. Save the depth buffer information, i.e. the information about the distance from
each pixel to the viewer, see Figure 4.
3. Render the headlights, by positioning luminance information captured from real
headlights as textures in front of the virtual car, as illustrated in Figure 5.
4. Blend in the headlight rendering with the depth information. This will give the
perceived effect of less light reaching objects far away.
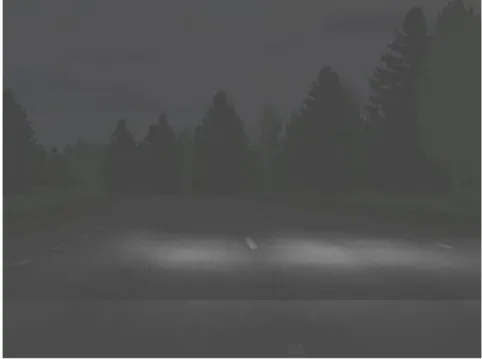
5. Blend in the light information with the colour buffer, resulting in how the image
would look during twilight conditions, see Figure 6.
Figure 3: The colour buffer that shows the road as it would look during daylight conditions.
Figure 4: The depth buffer containing information about the distance from each pixel to the viewer. The lower part of the image is white because of near plane clipping.
Figure 5: The headlight information is a 24-bit numeric value encoded as bit red, 8-bit green and 8-8-bit blue information.
Figure 6: The final render that shows the road as it would look during twilight conditions.
2.4.3 Rumble strips
To simulate rumble strips a sound was played when the wheel edge came into contact with a rumble strip. The sound played was recorded when driving a car over the “Målilla” rumble strip with 90 km/h on a real road (for further specification of the Målilla rumble strips see Anund et al., 2008). The sound level from the rumble strips, measured at the driver’s position, was approximately 77 dB(A). The sound was played for each different wheel, i.e. when the driver passed the centre line the rumble strips sounded first for the left front and rear wheels, and later for the right wheels. The
rumble strips sound signal was also sent to a ButtKicker, i.e. a low frequency transducer generating vibrations, mounted beneath the driver on the outside of the cabin.
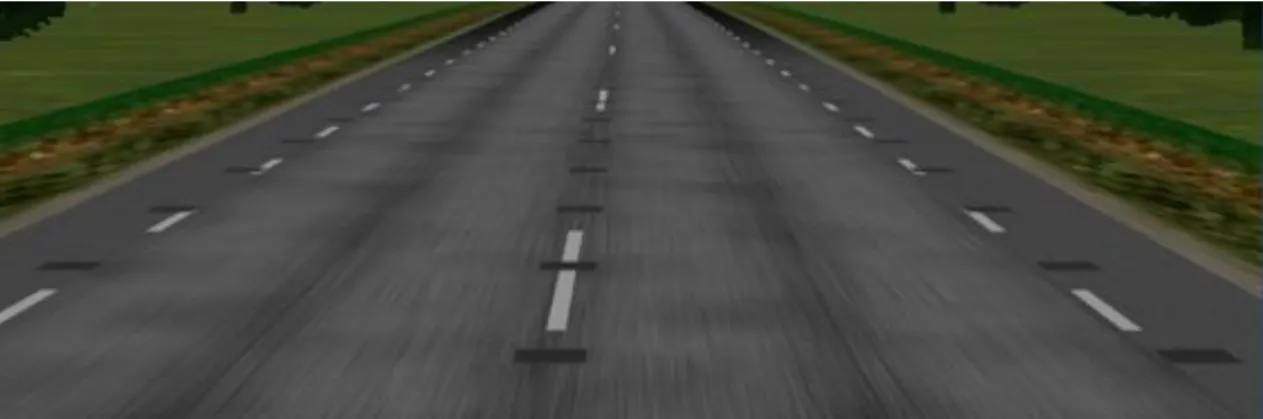
The rumble strips in the middle of the road were centred at the centre line and the right rumble strips were placed at a distance of 2.95 m from the road centre. Thus, if the driver wanted to stay in the driving lane without touching the rumble strips he/she would need to keep the wheel edges not closer than 0.175 m to the centre of the road and not further away than 2.95 m to the right of the centre line. The placement of the rumble strips was symmetric. Thus, there were rumble strips at the left lane edge as well. Each rumble strip on the simulated road was 0.35 m wide. See Figure 7 for the rumble strips setup.
Figure 7: The simulated rumble strips setup showing the rumble strips at road centre and at both lane edges.
2.4.4 LDW
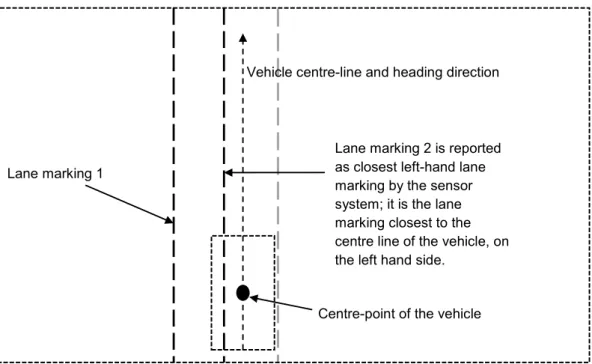
An LDW algorithm developed at VTI simulated the LDW functionality of the operational Volvo system. The LDW algorithm is implemented in an object-oriented design and requires input from an external sensor reading the position of the road markings. In accordance with that:
- The sensor reports the distance to one left and one right lane marker. If no
road marking exists, the quality of the corresponding road marking should be set to zero.
- The road marking closest to the left of the centre line of the vehicle is
reported as the left road marking and similar for the right road marking, see Figure 8.
- The distance is measured perpendicular to the heading direction of the road
between the centre point of the vehicle and the road marking (Figure 8). The LDW algorithm should trigger an alarm if the risk for an unintended lane departure is high. The algorithm outputs three separate alarm signals for each side, which are visual alarm, auditory alarm, and haptic alarm. Only the auditory alarm was used in the present study.
Figure 8: The road marking closest to the left of the centre line of the vehicle is
reported as left road marking, and similar for the right road marking, in the simulated Volvo LDW.
The alarms are activated if the system is in the active state and one or both of the following criteria fulfilled:
- Criterion 1: The distance between the side of the vehicle and the road
marking is smaller than a tuneable threshold value (which can be negative as when the vehicle has entered the adjacent lane).
- Criterion 2: The time-to-line crossing (TTL) is smaller than a tuneable
threshold value.
The LDW is disabled when one of the following conditions is met:
- LDW is turned off by an external source.
- Direction indicator light is switched on.
- The pedal brake force is larger than a predefined value.
- The steering wheel angle is larger than a predefined value.
- The throttle position is larger than a predefined value.
- The vehicle speed is below a predefined threshold.
After an alarm, the system will enter a post-alarm state and remain there for a predefined time. In this state, no further alarms can be issued. After this post-alarm state, the system will move to a reactivation state.
If the road marking quality is low or if there is a sharp turn ahead (speed dependant) alarms on the corresponding side are suppressed. That is, the system allows the driver to cut the centre line in a sharp left curve or the edge line in a sharp right curve.
Vehicle centre-line and heading direction
Lane marking 2 is reported as closest left-hand lane marking by the sensor system; it is the lane marking closest to the centre line of the vehicle, on the left hand side.
Lane marking 1
The simulated LDW functionality was tuned and tested so that it showed an estimated high correspondence with the operational Volvo LDW (see further specification of the Volvo LDW in Lundkvist & Fors, 2010). During testing and tuning, a representative of the Volvo research and development team tested the LDW and gave some feedback. In all, the implemented functionality was considered a good simulation of the Volvo LDW. The sound level of the LDW warning was 74 dB(A).
2.4.5 Unintentional lane departure
Combined with the radio jamming at certain road positions in each drive a forced yaw motion was induced 0.2 s after onset of the jamming on the radio/CD-player. The induced yaw motion aimed at making it possible that the driver unintentionally would leave the driving lane and receive an LDW or a rumble strips warning. The yaw was added according to the function:
where Ψ(t) is the yaw added at time t
Ψcrit is the final angle
Tdistract is the time it takes for the induced yaw to finish
The motion was a yaw added to the vehicle. This extra motion could not be noted in the steering wheel, but since the motion system is connected to the driver’s position on the road it would be noted in the motion system if the lateral acceleration motion becomes
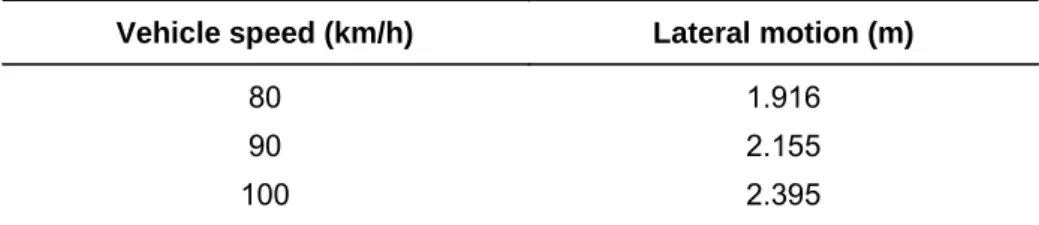
too large. The parameter settings were Ψcrit = 3.3° and Tdistract = 3.0 s in order to induce a
large enough yaw motion without it being too noticeable. Table 1 shows the induced lateral motion at constant speed during the yaw motion. Note that the lane is 3 m wide; thus if the driver does not take corrective action, the induced yaw motion will push him/her beyond the edges of the lane by quite a margin.
Table 1: Lateral motion with 3 seconds of induced yaw motion at different constant vehicle speeds.
In each drive of the experiment, 13 forced yaw motions were induced of which one was coupled with no warning from the LDW and the rumble strips, respectively. The
missing warning in each LDW drive intended to reflect that the LDW is not available all the time because of the system’s inability to read road markings 100% of the time (e.g. Lundkvist & Fors, 2010). In the rumble strips condition, the intention with the missing warning was to reflect that rumble strips are not allowed when housing areas are closer than 150 m from the road. For both warning types, this suppression of warning in relation to an induced yaw motion (i.e. intended unintentional lane departure) appeared
Vehicle speed (km/h) Lateral motion (m)
80 1.916
90 2.155
at a straight road segment where a house was presented closer than 150 m from the road. The induced yaw motion was always to the left for the missing warning. The 12 induced yaw motions coupled with warnings in each drive were equally distributed between the three road section types comprising straight road, curve to the left, and curve to the right. Thus, four induced yaw motions occurred for each type of road section. For each type of curve (i.e. curve to the left and curve to the right) two yaw motions were to the left and two to the right. For the straight road, three yaw motions were to the left and one to the right.
The road driven in each drive consisted of two identical road distances seamlessly put together. The yaw motions induced in the different road sections (i.e. straight road, curve to the left, curve to the right) occurred at the same positions along the two identical road distances. There were two induced yaw motions in each curve section in each of the two identical road distances (two left and two right yaw motions were distributed across the entire drive). For the yaw motions induced in straight road sections three yaw motions to the left and one to the right were distributed across the entire drive.
2.4.6 Radio/CD-player
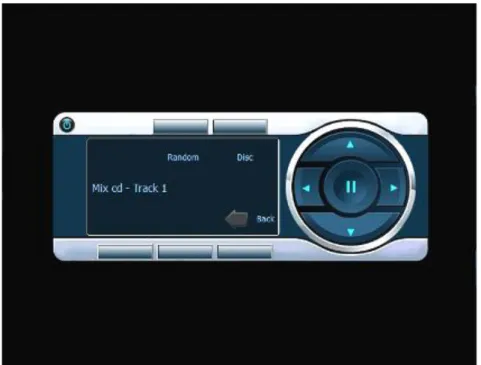
The radio/CD-player was a program running on a small computer in the cabin of the simulator. The small computer had a 7’’ touch screen showing a radio/CD-player where the user could navigate between different CDs and change tracks. The sound was played in the touch screen speakers. Figure 9 shows an image of the radio/CD-player.
Figure 9: The radio/CD player application.
The radio/CD-player was placed at a low position to the right of the driver, i.e. to the right of the middle console, and approximately 10 cm above the seat edge. The position was chosen with the ambition that the driver would need to take his/her eyes far off the road to manage the radio disturbance.
The program (radio) waits for a signal from the User Datagram Protocol to start a disturbance (jamming). When the disturbance starts, the user needs to press the button for next tune in order for the disturbance to quit. There were three types of disturbances used (see descriptions below). By using several disturbances, the ambition was to give the driver a feeling of the disturbances being rather random in nature and to create some difficulties with turning the disturbance off.
The Loose button disturbance waits for the user to press the button for next tune on the touch screen. However, when the user presses the button it will not work 100%, but succeed to stop the disturbance by a probability of 60%. The Delayed response
disturbance means that there is a time interval when the driver cannot make any input to
get rid of the disturbance. The delay used was 0.2 s from when the disturbance started. The Repeated disturbance was combined with an input delay, i.e. the disturbance was repeated once 0.01 s after the disturbance was fixed.
In total, 19 events of jammed radio/CD-player appeared in each drive. Thirteen of these events happened in connection with an induced yaw motion, where the onset of the induced yaw motion was 0.2 s after the onset of the jamming. Thus, there were six jammed radio/CD-player events without the car’s lane positioning being perturbed from outside the driver-vehicle control loop.
2.4.7 Summary of scenario events
Each drive in the experiment included vital events of scenario and experimental conditions and was set up to include:
- 19 events of jammed music, of which 6 were without induced yaw motion.
- 13 events of induced yaw motion coupled with jammed music events.
- 12 of the 13 events of induced yaw motion coupled with lane departure
warnings.
4 on straight road: 3 left and 1 right yaw motions.
4 in curve to the left: 2 left and 2 right yaw motions.
4 in curve to the right: 2 left and 2 right yaw motions.
- 6 events of overtaking of parked car.
2.5
Questionnaires
As indicated in Figure 2, questionnaires were administered before and after the driving sessions.
Before the first driving session a questionnaire was introduced that concerned
background information about year of birth, year of acquiring driving license, driving mileage per year, what type of driver the participant considered him or herself to conform to, and general attitudes towards rumble strips and LDWs (see Appendix 1). After each of the driving sessions, a questionnaire about the just used warning system was administered. If using the rumble strips in the immediate preceding driving session the questionnaire was about this system. If using the LDW in the immediate preceding driving session the questionnaire was about this system (see Appendix 2 for the specific LDW and rumble strips questionnaires).
After the participants had completed the questionnaire about the warning system used in the second (and last) driving session, another questionnaire was administered about comparisons of the rumble strips and the LDW (see Appendix 2).
2.6
Performance Measures
The data used for analyses were restricted to four types of performance measures. Primarily these measures concerned the participants’ performance in the unintentional lane departures, and were:
- Response completion time; time from warning to completion of response.
- Time to back in lane; time from warning to having all wheels back in lane.
- Lane exceedence area; amount of road surface exceeded from driving lane.
One measure indicated the driving performance between the unintentional lane departures as quantified by:
- Standard deviation of lateral lane position; variation or sway in lateral lane
positioning.
Response completion time: measured as the time from warning to the completion of
response, with response defined as a steering wheel reversal with a local maxima or minima in the steering wheel angle signal larger than an absolute value of 6°. A fifth order Butterworth filter with a cut-off frequency of 0.75 Hz was applied to remove small corrective steering wheel manoeuvres. The reason for selecting Response completion time instead of the initiation of the response was that the initiation point is usually very vague. For example, if the driver is pushed to the left in a right hand curve the correct response is to continue turning to the right. In such cases, it is very difficult to find the onset of the response.
Time to back in lane: measured from the time of onset of lane departure warning to the
moment when all four wheels of the vehicle are back within the driving lane.
Lane exceedence area: determined as the integral over the lateral position when the
vehicle was outside the lane during a specified time interval. The chosen interval was from the time when the vehicle left the lane and 10 s onwards. Note that (i) when the vehicle was inside the lane the contribution to the area was zero, (ii) it is possible for the vehicle to leave the lane several times within the 10 s interval, and that (iii) ‘outside the lane’ means any part of the vehicle being outside the lane.
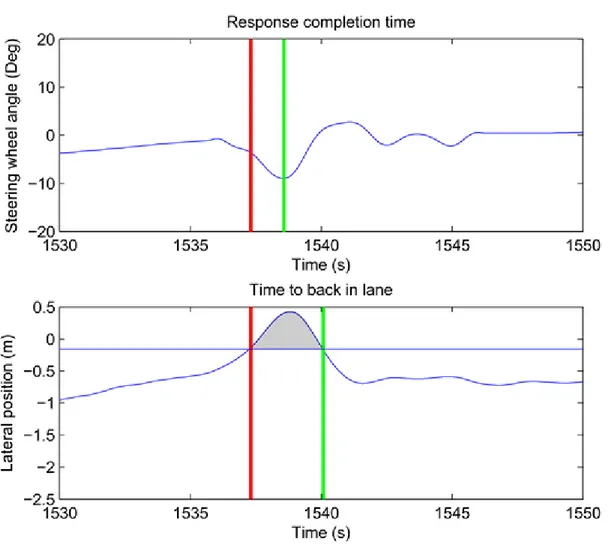
Figure 10 illustrates the measures reflecting the participants’ performance in the
unintentional lane departures, for the rumble strips condition. The Response completion time and the Time to back in lane is the time from the red line to the green line in the upper and lower graphs, respectively. The Lane exceedence area is the shaded area between the red and green vertical lines in the lower graph.
Figure 10: Illustration of the three performance measures Response completion time, Time to back in lane and Lane exceedence area in the rumble strips condition. The red lines represent the warning onset, and the green lines represent the time for completion of the driver’s steering wheel reversal response (upper graph) and the time when the vehicle is back in the lane (lower graph). The shaded area (lower graph) represents the Lane exceedence area, with the horizontal line showing the decision boundaries for when the vehicle is outside the lane.
Standard deviation of lateral lane position: calculated for 10 s intervals defined from
just before the next event and the ten preceding seconds.
2.7
Procedure
The participant first read a written description of the driving scenario and the tasks he or she should perform. Then s/he signed the informed consent form, and completed the questionnaire about background information with questions about estimated driving mileage and driver type, general opinions about LDW and rumble strips, etc.
After that the participant entered the driving simulator and seated in the simulator car cabin were verbally instructed about the driving simulator, overall scenario conditions
and the driver tasks. The participant undertook a short driving session with the purpose of making him/her accustomed to the driving simulator and familiarised with the driving and the radio/CD-player handling tasks.
Then the experiment started and the participant performed the two driving sessions, one with the rumble strips and the other with the LDW. At the very beginning of each drive the participant made several tests of the lane departure warning system in use by exceeding the driving lane both to the left across centre line and to the right across shoulder road marking.
If a participant on two consecutive occasions did not redirect his or her visual attention by shifting point of gaze to the radio/CD-player when the music was jammed the experimental leader intervened the driving by commenting on this. That is, if
disregarding the task to take care of the dysfunctional radio/CD-player immediately on two occasions in a row, which in effect made it easy to null the induced yaw motion of the vehicle, the instruction for the radio/CD-player handling task was repeated and emphasized by the experiment leader. The participant got this information through the cabin speakers while driving.
Each driving session took about 25 minutes to complete. After the first session the simulator was stopped and parked, and the participant was accompanied out of the driving simulator for a pause outside and for answering the questionnaire about the drive and the type of lane departure warning just used. After the second driving session, and having completed the questionnaire about that drive and the just used warning type, the participant answered the questionnaire about comparisons of LDW and rumble strips.
3
Analyses and Results
3.1
Driver Attitudes and Assessments
3.1.1 Questionnaire data analyses
In summary the subjective attitudes and assessments reported in the questionnaires concerned:
- Drivers’ general opinions of LDW and rumble strips.
- Drivers’ assessments of the LDW and the rumble strips from using one of
these at a time in lane departures.
- The driver distraction functionality of the radio/CD-player.
Most of the questionnaire data were analysed with analyses of variance (ANOVAs) for repeated measures. All statistical analyses were performed with a significance level of α = .05 (p< .05).
The ANOVAs of ratings of general attitude, trust, and system acceptance were conducted using a 2 (warning exposure) × 2 (warning type) design. The conditions of the warning exposure variable consisted of the point in time before and after driving sessions, and the warning type variable comprised the two driving conditions of driving with LDW and rumble strips as warning types.
The ANOVA of ratings of realism of the simulation was conducted using a one-way repeated measures design with two levels comprising the two types of warning, LDW and rumble strips.
The ANOVAs of ratings of distraction load, warning benefit, and warning timing were conducted using a 2 (group) × 2 (warning type) design. The group variable divided the participants into two groups depending on which type of warning they used in the first drive (LDW or rumble strips), and the warning type variable consisted of the two conditions of driving with LDW and rumble strips.
In addition, response frequencies and further comments made by participants about motivations for their responses were used for analysis of preference of warning type. 3.1.2 Results of questionnaire data analyses
General attitude
General attitude towards rumble strips and LDW, respectively, was measured before driving with any warning system and after driving with the respective warning type. Concerning rumble strips the question “What is your general attitude towards rumble
strips at the road’s edge and/or centre that warn for lane departure at edge and/or centre?” was asked before (question 5 in Appendix 1 questionnaire) and after (question
36 in Appendix 2 questionnaire). Concerning LDW the question “What is your general
attitude towards in-vehicle systems that warn for lane departure at the road’s edge and/or centre?” was asked before (question 9 in Appendix 1 questionnaire) and after
(question 14 in Appendix 2 questionnaire).
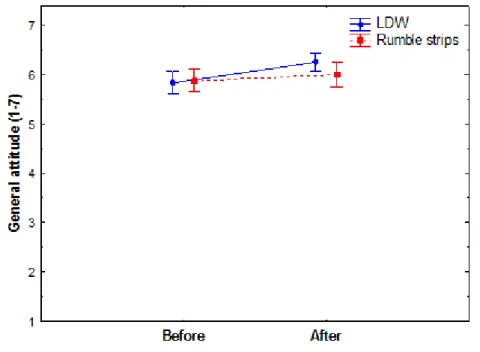
Means of the responses given by each participant before the first driving session and after driving with each warning system are shown in Figure 11. The responses were
made on a 7-point scale of general attitude ranging from 1 = very negative to 7 = very positive. The mean ratings of LDW before and after driving sessions were 5.83 (SE=0.23) and 6.25 (SE=0.19), respectively. The mean ratings of rumble strips before and after driving sessions were 5.88 (SE=0.23) and 6.00 (SE=0.26), respectively. There were no significant effects on general attitude towards LDW and rumble strips in the responses made before and after driving with each warning type.
Figure 11: Mean values of general attitude towards LDW and rumble strips before and after warning exposures in the driving sessions. Means ±SE. Scale from very negative (1) to very positive (7).
Trust
Trust in the functioning of rumble strips and LDW, respectively, was measured before driving with any warning system and after driving with the respective warning type. Concerning rumble strips the question “How much trust do you have in the functioning
of such rumble strips?” was asked before (question 6 in Appendix 1 questionnaire) and
after (question 37 in Appendix 2 questionnaire). Concerning LDW the question “How
much trust do you have in the functioning of such warning system?” was asked before
(question 10 in Appendix 1 questionnaire) and after (question 15 in Appendix 2 questionnaire).
Means of the responses given by each participant before the first driving session and after driving with each warning system are shown in Figure 12. The responses were made on a 7-point scale of trust ranging from 1 = very little trust to 7 = very much trust. The mean ratings of LDW before and after driving sessions were 4.88 (SE=0.21) and 5.54 (SE=0.20), respectively. The mean ratings of rumble strips before and after driving sessions were 5.46 (SE=0.20) and 6.08 (SE=0.18), respectively.
Figure 12: Mean values of trust in LDW and rumble strips before and after warning exposures in the driving sessions. Means ±SE. Scale from very little trust (1) to very much trust (7).
The ANOVA showed significant main effects of warning exposure (F(1, 23) = 12.98,
p< .01) and warning type (F(1, 23) = 19.08, p< .001) on trust ratings, with no significant
interaction effect. Overall the participants expressed more trust in warning functioning after being exposed to warning events in the driving sessions (mean=5.81, SE=0.24), than before (mean=5.17, SE=0.26), as illustrated in Figure 13. Figure 14 shows that they considered the functioning of the rumble strips overall more trustworthy (mean=5.77, SE=0.25) than the LDW (mean=5.21, SE=0.22).
Figure 13: Main effect of warning exposure on trust (means ±SE). Scale from very little trust (1) to very much trust (7).
Figure 14: Main effect of warning type on trust (means ±SE). Scale from very little trust (1) to very much trust (7).
System acceptance
The participants’ acceptance of LDW and rumble strips was measured using the van der Laan acceptance scale for assessing the acceptance of technology (van der Laan, Heino, & de Waard, 1997). The scale contains 9 items, which are rated on a 5-point rating-scale
(questions 7 and 11 in Appendix 1 questionnaire; questions 16 and 38 in Appendix 2 questionnaire). The items load on two dimensions (or scales); one dimension indicates the usefulness of the technology and the other indicates the satisfaction rendered by the used technology. From the ratings of the items on the 5-point rating scale usefulness and satisfaction scores, respectively, were computed ranging from -2 = very negative to +2 = very positive.
Figure 15 shows the mean usefulness scores for LDW and rumble strips before the first driving session and after driving with each warning system. The mean ratings of LDW before and after the driving session were 1.23 (SE=0.13) and 1.44 (SE=0.09),
respectively. The mean ratings of rumble strips before and after the driving session were 1.30 (SE=0.13) and 1.53 (SE=0.10), respectively.
The usefulness scores did not reveal any significant effects, only a tendency of an effect of warning exposure on usefulness, F(1, 23) = 3.93, p= .06. The participants tended to consider the usefulness of lane departure warning overall greater after exposure to warning events in the driving sessions.
Figure 15: Mean values of usefulness of LDW and rumble strips before and after warning exposures in the driving sessions. Means ±SE. Scale from very negative (-2) to very positive (+2).
Figure 16 shows the mean satisfaction scores for LDW and rumble strips before the first driving session and after driving with each warning system. The mean ratings of LDW before and after the driving session were 0.83 (SE=0.13) and 1.28 (SE=0.10),
respectively. The mean ratings of rumble strips before and after the driving session were 0.30 (SE=0.14) and 0.36 (SE=0.19), respectively.
Figure 16: Mean values of satisfaction of LDW and rumble strips before and after warning exposures in the driving sessions. Means ±SE. Scale from very negative (-2) to very positive (+2).
The ANOVA showed significant main effects of warning exposure (F(1, 23) = 7.54,
p< .025) and warning type (F(1, 23) = 63.42, p< .0001) on satisfaction. There was no
significant interaction effect. The main effect of warning exposure (Figure 17) shows that the participants were overall more satisfied with lane departure warning after having been exposed to the warning events in the driving sessions (mean=0.82,
SE=0.19) than before (mean=0.57, SE=0.16). The main effect of warning type (Figure 18) shows that the participants were overall more satisfied with the use of LDW (mean=1.06, SE=0.16) than the use of rumble strips (mean=0.33, SE=0.19).
Figure 17: Main effect of warning exposure on satisfaction, means ±SE. Scale from very negative (-2) to very positive (+2).
Figure 18: Main effect of warning type on satisfaction, means ±SE. Scale from very negative (-2) to very positive (+2).
Realism of simulation
The participants were inquired about the realism of the drives with LDW and rumble strips, respectively, by use of the question “How realistic was the overall situation as
Responses were made on a 7-point rating-scale ranging from 1 = not at all realistic to 7= very realistic.
The ANOVA showed no significant effect of warning type on rated realism (Figure 19). Thus, the mean ratings of realism were about equal for the drives with LDW
(mean=5.42, SE=0.23) and rumble strips (mean=5.50, SE=0.16).
Figure 19: Mean values of realism of LDW and rumble strips drives. Means ±SE. Scale from not at all realistic (1) to very realistic (7).
The participants were also inquired about what they considered realistic and not realistic, respectively, in the overall simulated situation. Their comments on this are given in Table 2 for the LDW drive and in Table 3 for the rumble strips drive.
Table 2: Participant comments on realism of the simulation of the LDW drive. No comments made by the participants are indicated with “-“.
LDW Drive
Participant Realistic Not realistic
1 - -
2 The environment. -
3 That one actually cannot do several things while driving. One loses focus on direction and speed.
The car felt rocky and unstable.
4 The environment to drive in. The car’s properties; sensitivity, throttle, steering.
5 - -
6 The feeling. The environment along the road in the visual presentation (somewhat).
7 Most of it. Nothing but trees; no houses and no oncoming road-users.
8 Sounds, visual impression. - 9 To keep the speed, remaining in driving
lane when one fixes the radio. -
10 - -
11 The graphics. Differences in levels cannot be felt. 12 The distraction parts. No other traffic.
13 The car’s performance overall. Steering response. 14 To drive on stretches where there were not
many speed changes, the feeling. The repeated traffic and certain changes in pace. 15 The extent to which it felt real. Like unreal, that it does not feel like reality. 16 The road, steering wheel, roadability, nice
road. Difficult with the speed control, no traffic.
17 Everything. -
18 It felt really real. I do not have anything that did not feel realistic after the second drive.
19 That I even in real traffic position myself towards the centre especially when I do something with the radio.
That one do not have any oncoming traffic, that is that there is no problem with keeping to the centre
20 The environment along the road. No oncoming traffic, the radio. 21 The haze, the car that was parked without
warning triangle and no lights. No oncoming traffic.
22 See the assessment for rumble strips. See the assessment for the rumble strips. 23 My reaction to do something. That is, to
take care of the radio. The rocking feeling (like floating forward). The car’s rocky response to steering wheel input. Speed perception, especially acceleration. The sensitivity of steering wheel and throttle.
24 Same as with the rumble strips. Gear change; one occasion of “gravitation error” (also with the rumble strips).
Table 3: Participant comments on realism of the simulation of the rumble strips drive. No comments made by the participants are indicated with “-“.
Rumble Strips Drive
Participant Realistic Not realistic
1 - -
2 Sound and the feeling when passing the lane marking (“the line”). - 3 The feeling of where the car was on the
road because the rumble strips were felt in the steering wheel.
Same as before; rocky and too easily affected car.
4 Environment and road feels realistic. The car, for example steering wheel sensitivity and throttle sensitivity (not unrealistic but less realistic).
5 - -
6 The feeling. Little, the visual presentation (not photo realism)?
7 - No other traffic on the road.
8 Sounds and vibrations in the car. Gliding feeling on the road. 9 To keep the speed in the right lane at
distraction. No other traffic on the road.
10 - One meets nobody.
11 The graphics. Differences in levels cannot be felt. 12 The distraction part. No other traffic.
13 Vibrations when driving on the rumble
strips. Steering response somewhat unrealistic.
14 The feeling and overall impression, the motions corresponded well and it felt like I drove a real car.
The speed increase felt sometimes like it was somewhat lagging, that the scenario did not have not much varied traffic contributed to that it felt fictitious.
15 The reality of the drive. Unreal. 16 The steering wheel motions, nice
environment, good road. Bad roadability, floating, rocky, no traffic, difficult to keep the speed. 17 Realistic problem topic. -
18 Everything from the car’s properties to the
graphics; it felt like being in a real car. Somewhat rocky but otherwise entirely OK. 19 The road’s appearance and feeling, the
rumble strips. Had been more attending to the road in reality and ignored the radio at oncoming traffic etc.
20 Road environment was realistic. Single road-user, the radio, dead spot.
21 The haze. No other traffic on the road.
22 The visibility condition was realistic compared with the corresponding in reality, the rumble strips effect on the vehicle.
Could have been better traffic.
23 The rumble strips sound. The other as
before (with the LDW). Like before (with the LDW). 24 Field of view, mirrors, vibrations when
driving across rumble strips, the haze looked real.
The relation between throttle and speed (difficult to grasp, no motor sound at throttle increase).
Distraction load
Questions 21 and 43 (Appendix 2 questionnaire) inquired: “How burdening for the
driving task was it to take care of the jammed radio/CD-player?” The responses were
given on a 7-point rating-scale ranging from 1 = not at all burdening to 7 = very burdening.
The ANOVA of the ratings of how burdening it was to take care of the jammed radio/CD-player when driving with LDW and rumble strips, respectively, showed no significant effects. There was only a tendency of an effect of warning type (F(1, 23) = 4.10, p= .055). The participants tended to consider the load somewhat greater when driving with the rumble strips as compared to driving with the LDW.
Figure 20 shows the mean ratings of the ‘distraction load’, i.e. how burdening it was for each condition. For the group starting with the LDW drive the mean ratings related to the LDW and rumble strips were 5.42 (SE=0.37) and 5.58 (SE=0.35), respectively. For the group starting with the rumble strips drive the mean ratings of LDW and rumble strips were 5.00 (SE=0.37) and 5.67 (SE=0.35), respectively.
Figure 20: Mean values of distraction load for LDW and rumble strips drives for the groups starting with different warning types. Means ±SE. Scale from not at all burdening (1) to very burdening (7).
Warning benefit
Questions 22 and 44 (Appendix 2 questionnaire) inquired: “Did you benefit from the
warning?” The responses were given on a 7-point rating-scale ranging from 1 = not at
all to 7 = very much.
The ANOVA of the benefit ratings showed no significant effects. The participants considered that they benefitted much and about the same from both types of warning. Figure 21 shows the mean ratings of warning benefit for each condition. For the group starting with the LDW drive the mean ratings of LDW and rumble strips were 6.25 (SE=0.29) and 6.33 (SE=0.26), respectively. For the group starting with the rumble
strips drive the mean ratings of LDW and rumble strips were 6.00 (SE=0.29) and 6.17 (SE=0.26), respectively.
Figure 21: Mean values of warning benefit of LDW and rumble strips for the groups starting with different warning types. Means ±SE. Scale from not at all (1) to very much (7).
Warning timing
Questions 23 and 45 (Appendix 2 questionnaire) inquired: “Did you consider the
warning came early, late or neither?” The responses were given on a 7-point rating
scale ranging from 1 = very late to 7 = very early.
The ANOVA showed no significant effects on warning timing, only a tendency of an effect of warning type (F(1, 22) = 3.97, p= .059). The participants tended to consider the rumble strips warning as coming somewhat earlier than the LDW warning, which was considered to come neither early nor late. Figure 22 shows the mean ratings of warning timing for each condition. For the group starting with the LDW drive the mean ratings of LDW and rumble strips were 4.08 (SE=0.24) and 4.25 (SE=0.33),
respectively. For the group starting with the rumble strips drive the mean ratings of LDW and rumble strips were 4.25 (SE=0.24) and 5.00 (SE=0.33), respectively.
Figure 22: Mean values of warning timing of LDW and rumble strips for the groups starting with different warning types. Means ±SE. Scale from very late (1) to very early (7).
Preference of warning
The question “Which drive did you experience most risky?” was asked after completion of both drives (question 58 in Appendix 2 questionnaire). Figure 23 indicates the
responses to the question and Table 4 indicates the participants’ comments on motivation for choosing which drive was most risky.
Figure 23: Response frequencies of which drive the participants considered most risky. (Because one participant did not respond, one response is missing.)
Table 4: Participant comments on the motivation of choice of most risky drive.
Motivation of choice of most risky drive
LDW Rumble strips No difference
With the rumble strips you get help with knowing where the wheels are on the road, but with the LDW you only know that you are positioned wrong.
You became more afraid out of this warning and made a quicker correction manoeuvre.
I experienced no major difference, but believe that the rumble strips can make you jerk the steering wheel because you react on the sound and as such constitute a traffic danger.
I did not react as much (as with the
rumble strips). Too fast with the steering wheel movement. Mostly a matter of habit, but can be an advantage that all perceives the rumble strips.
The rumble strips warned in a stronger way, which I experienced such as I became more attentive.
The rumble strips felt more
stressing. I experience that the warnings give me the information I need, and if there is a difference I believe it can be much dependent on circumstances.
You got the warning somewhat later with the warnings system (LDW) than with the rumble strips.
Partly because I drove with the rumble strips the first drive, and partly because they stressed me more.
I was in fact warned both of the times (both drives).
A more vibrating sound; vibrations. Warning or warning. It became worse when I passed the
stationary car since I wanted to avoid the passing of the centre line with both pair of wheels because of the ‘noise’.
The question “Did you experience any difference between the two different situations
with rumble strips and warning system (LDW)?” was asked after completion of both
drives (question 59 in Appendix 2 questionnaire). Figure 24 shows the responses to the question and Table 5 shows what the participants considered differentiated the LDW and rumble strips situations.
Figure 24: Response frequencies of whether the participants experienced any difference between the two driving situations, with LDW and rumble strips, respectively. (Because one participant did not respond, one response is missing.)
Table 5: Participant comments on what differentiated the drives with the two warning types.
Driving situation with LDW vs. rumble strips
If any difference, what differentiated the drives?
More pleasant drive with the warning system (LDW). Felt safer to have rumble strips in the road.
The warning system (LDW) had a more pleasant sound; you get a calmer reaction; I think the reason for that one loses focus should be weighed in, and during tiredness the rumble strips are better; warning system when not
focused with the vision. React more to rumble strips.
The warning system (LDW) can oneself control by the direction indicator. More pleasant with the signal (LDW).
The warning system (LDW) more pleasant.
With the rumble strips you feel it in the steering wheel and sound is generated. With the rumble strips it felt more serious.
The car’s warning system is considerably more pleasant.
The rumble strips warned in a stronger way, which I experienced such as I got more attentive. The second drive with the warning system felt like a more harmonious situation.
Vibrations and noise.
The vibrations; may however not influence me in my acting. The rumble strips sound is recognizable and the other system worked also.
Much more pleasant with the warning system especially at road centre. More tiresome to have to drive over rumble strips at road centre to drive by the stationary car.
The warning system (LDW) did not warn at intentional lane departure, which was positive, and I also perceived it as the warning came later, which was positive, and also sometimes did not appear.
The rumble strips warn even if you use the direction indicator.
Partly that when you were on the rumble strips and hopped you speeded up the correction for going back to your driving lane.
The rumble strips sound more annoying.
No warning when crossing the centre line if direction indicator used, and you avoided the vibrations from the rumble strips with the warning system (LDW).
The question “What do you prefer?” was asked after completion of both drives (question 60 in Appendix 2 questionnaire). Figure 25 shows the responses to the question and Table 6 shows the participants’ motivation of preference.
Figure 25: Response frequencies of which warning the participants preferred. (Because one participant did not respond, one response is missing.)
Table 6: Participant comments on what motivated the chosen preference.
Motivation for preference
LDW Rumble strips LDW and rumble strips
It felt nicer, more relaxed to drive. Safer. It is a matter of habit.
More attentive. Felt safer with the rumble strips. Both have pros and cons; rumble strips scare more and is therefore effective, but they also are more unpleasant than the warning system (LDW).
More pleasant. You awaken, get a faster reaction. My view is that both fulfil the informative function (warning), but not at the same time.
Can be some collision if you drive a car equipped with the system and drive on rumble strips. The system in the car is possible to develop with assistance systems, which is an advantage.
The warning system is somehow a bit annoying. If it was possible to turn off like a parking warning a lot of people would probably turn it off.
Rumble strips at the road edge and LDW at the road centre.
It did not warn unnecessarily and the sound was not annoying in contrast to that with the rumble strips.
I think one warning system is enough so that you get used to it; in addition, it always works, and the warning system (LDW) can in fact fail.
No warning when crossing the centre line if direction indicator is used; you avoided the vibrations from the rumble strips with the warning system.
It makes me attentive to the situation faster, both auditory and physical.
Hard to teach an old dog new tricks.
Effective, that is how I experienced it actually.