0
WORKING PAPER
03/2017
Costs of traffic accidents with ungulates in Sweden
Ing-Marie Gren1, Annika Jägerbrand2
ECONOMICS
1Department of Economics, Swedish University of Agricultural Sciences, Box 7013, 750 07, Uppsala, Sweden 2 Calluna, Hästholmsvägen 28, 131 30 Nacka, Sweden
Sveriges lantbruksuniversitet, Institutionen för ekonomi Working Paper Series 2017:03 Swedish University of Agricultural Sciences,
Department of Economics, Uppsala
ISSN 1401-4068 Corresponding author: ISRN SLU-EKON-WPS-1305-SE Ing-Marie.Gren@slu.se
1
Costs of traffic accidents with ungulates in Sweden
Abstract Traffic accidents with ungulates pose a serious problem in many countries, and there is a need for predicting accidents and costs at a large scale for an efficient management of the accidents. Based on the assumption that traffic accidents are determined by traffic volume and ungulate population sizes, this study provides a relatively simple method for calculating and predicting costs of current and future traffic accidents with roe deer, wild boar, and moose in Sweden. A logistic population model is assumed for all ungulates, and econometric methods are used for predicting vehicle accidents with panel data on traffic accidents, traffic load, bags, hunting licenses, and landscape characteristics for each county and year during 2003-2015. The calculated total discounted cost of traffic accidents over a period of 15 years is relatively stable around 1300 million SEK per year in present value (which corresponds to 0.03% of gross domestic product in 2015), but the allocation of costs among ungulates differs. Costs of vehicle accidents with moose account for the largest share of the cost (44%), but accidents with wild boar show the most rapid increase over a 15 year period because of the estimated relatively high intrinsic growth rate and the recent establishment of this animal in several counties. The predicted costs are, however, sensitive to the assumption of future hunting pressure and traffic volume.
.
Key words: costs, traffic accidents, ungulates, econometrics, Sweden JEL codes; Q29, Q57
2
1. Introduction
Wildlife vehicle collisions cause serious animal and human injuries and property damage throughout the world which increase with traffic and transport volume. In Sweden, the number of reported vehicle accidents with roe deer, wild boar, and moose has increased with 36% from approximately 33000 in 2003 to 45000 in 2015 (NVR 2017). This is in contrast with the development of all traffic accidents with some personal injury which have decreased from 18365 in 2003 to 14672 in 2015 (Trafikanalys 2017). Similar to other traffic accidents, vehicle accidents with wildlife give rise to costs in terms of human injuries and fatalities, property damage, towing, accident attendance and investigation. Specific for accidents with wildlife are the cost of hunters’ search for killed animal, lost animal (which can be threatened species), and disposal of animal carcass. A relatively early study showed that the property damage costs of deer vehicle collisions in USA can amount to approximately 16,000 million SEK/year (Conover et al. 1995). A more recent study indicated that cost of traffic accidents with deer, elk and moose in USA, which includes property damage, personal injury, and lost animal, can amount to approximately 75,500 million SEK/year (Huijser et al. 2008). For Sweden, property damage costs of traffic accidents with wild boar have been estimated which amounted to 10 million SEK/year (Häggström-Svensson 2014).
Despite the national and international concern for wild life traffic accidents, and the scientific community’s long term experience from ecological modelling of impacts of wild life on traffic accidents (see Gunson et al. 2011 for a review), there is, to the best of our knowledge, no study estimating and predicting costs of traffic accidents with wild boar, roe deer and moose in Sweden. In principle, it would be straightforward to calculate such costs by simply multiplying the number of traffic accidents with the ungulates with the cost per accident. However, this would not allow us to predict future cost from, e.g. expected increases in the size of any of the ungulate population or in traffic load. Furthermore, such predictions require knowledge about the interdependency between population development and pressures on population such as traffic load and hunting. An increase in any of these pressures will reduce future population and hence traffic accidents when they depend on the size of the wild life populations. The dynamics of these populations are, in turn, determined by, not only pressures, but also landscape characteristics. The purpose of this
3 study is to calculate and predict dynamic and spatial allocation of costs from traffic accidents by estimating population of each of the three ungulates, roe deer, moose, and wild boar. To this end we develop and estimate econometric regression models that account for hunting pressure and differences in land-scape characteristics among regions with panel data on different counties and years between 2003-2015.
Vehicle accidents constitute a part of the external costs of traffic, the literature of which is large with a relatively long tradition (e.g. Jansson 1994), which rests on the literature on the valuation of life and injuries (e.g. Mishan 1971). There are only a few studies on the estimation of costs of wildlife vehicle accidents (Witmer and DeCalesta 1991; Conover et al. 1995; Bisonette et al. 2008; Huijser et al. 2008; Häggmark-Svensson 2014). All studies calculate costs in terms of repair costs, and all but Häggmark-Svensson are applied to vehicle accidents with deer in USA. Bisonette et al. (2008) and Huijser et al. (2008) also include cost of human injuries and fatalities, and Huijser et al. (2008) calculate costs for deer, elk and moose. Except for Häggmark-Svensson et al. (2014), who calculate costs of accidents with wild boar in Sweden, none of the studies predict costs of traffic accidents. This would require models of the determination of accidents. Such models are used and developed by a related literature on costs and benefits of measures curbing traffic accidents with wildlife, such as fences, road tunnels, and warning signs (e.g. Schwabe et al. 2002; Seiler 2004; Glista et al. 2009; Hussain et al. 2007; Huijser et al. 2009; Found and Boyce 2011; Gagnon et al. 2015; Rytwinski et al. 2016). A common approach has been to derive the impact of mitigation measures on accidents by statistical analysis with accidents as the response variable and traffic load and landscape characteristics as explanatory variables.
However, most of these cost and benefit calculations of mitigation measures do not include wildlife population dynamics, which is necessary when aiming to predict future costs of traffic accidents. To the best of our knowledge, there are only two studies predicting vehicle accidents with wildlife which account for the linkages between current and future accidents and other pressures such as hunting (Schwabe et al. 2002; Gren et al. 2016). Schwabe et al. (2002) do this in a two-step approach where the first step is to estimate the explanatory power of different variables affecting traffic accidents (traffic and population density, mitigation strategies, and local landscape conditions). The next step is to use these results for parameterizing a function of the population
4 dynamics, which is assumed to be logistic. In an application to deer accidents in Ohio, USA, they showed that benefits from accident mitigation measures, such as fencing of roads, occur by decreases in traffic accidents and increases in deer bags. Gren et al. (2016) used a slightly different approach when calculating and predicting costs of accidents with wild boar in Sweden. Similar to Schwabe et al. (2002) they assumed a logistic population growth function which accounts for the pressure from both traffic volume and hunting and landscape characteristics. Using econometric tools, they estimated a value of the traffic pressure coefficient, i.e. the impact on population growth from a unit increase in the traffic volume. Equipped with this numerical population growth function for wild boar in Sweden, they simulated effects of changes in traffic volume on future accidents when accounting for different hunting pressures.
We will use the same approach for predicting traffic accidents for the three ungulates as Gren et al. (2016). Since population sizes are not known, we use changes in catch per unit effort as a proxy for changes in population sizes. This is a commonly applied method in bioeconomic modelling, in particular for estimating fish population (e.g. Schaefer, 1954; Clark 1990). In our study, there are two effort variables, traffic volume and hunting, and any of these can be used as a proxy for the latent population variable. A problem in our case with using hunting statistics is the lack of appropriate effort variable, such as number of hunters and time spent on hunting. Instead, data on number of issued hunting licenses are available, but such a variable gives no information on actual hunting activity. An advantage with traffic volume as an effort variable is that it reflects actual driving activity. We will use both these approaches in this study, and account for eventual impacts of landscape characteristics on growth of ungulate populations.
In our view, the main contribution of this study is the calculation and prediction of costs of traffic accidents in Sweden when accounting for the dynamic interdependency in traffic accidents and bags. This has been made for wild boar (Häggmark-Svensson, 2014), but not for deer and moose. The paper is organized as follows. We start with a preliminary analysis of cost of accidents with moose, deer, and wild boar in Sweden. Next, we present the theoretical framework for estimating ungulate populations based on traffic and hunting data. Section 4 presents data retrieval and results from the statistical analyses. Calculated and predicted costs of traffic accidents from the ungulates are presented in Section 5. The paper ends with a summary and conclusions.
5
2. Preliminary analysis
The total number of accidents with moose, roe deer, and wild boar in Sweden has increased from approximately 33 000 to 46 000 during the period 2003 to 2015 (NVR 2017). These three ungulates account for 97% of the total number of vehicle accidents with wild life. Red deer, fallow deer, and carnivores account for the remaining 3%. Both the total number of accidents with the three ungulates and the increase over time differs among the species (Figure 1).
Figure 1: Number of vehicle accidents with moose, roe deer and wild boar in Sweden during the period 2003-2015 (NVR 2017).
The share of accidents with roe deer, which amounts to approximately 0.8, has been relatively stable over the period, while that of wild boar has increased from 0.02 to 0.09. One reason for the increase in total number of accidents can be increase in traffic volume, which increased from approximately 53 000 106 km (driven km) to 57000 106 km during the same period (RUS 2016). Accidents in relation to traffic volume has thus increased from 0.61/106 km to 0.80/106 km indicating the contribution of other factors affecting the number of accidents (Table A1).
0 5 000 10 000 15 000 20 000 25 000 30 000 35 000 40 000 45 000 50 000 2003 2004 2005 2006 2007 2008 2009 2010 2011 2012 2013 2014 2015 Num be r o f a cc ide nt s Year
6 The main costs of an accident with any ungulate are associated with personal injuries and/or property damage. In addition, there are costs associated with carcass removal, search for wounded or killed animal, and the value of lost animal. Unlike human injuries and property damages, there are no standardized values on these additional costs in Sweden (Bångman 2016), and they are therefore excluded. Huijser et al. (2009) have shown that these cost account for a relatively small part of the total cost, less than 5%, for deer and moose in USA. If the relative shares are similar for Sweden our exclusion of these costs should thus not result in a significant underestimation of the costs
The personal injuries are divided into three categories; fatality, severe and mild injury (Bångman 2016). As mentioned in the introduction, the assessment of these costs in monetary terms implies the valuation of a statistical life, health and wellbeing, on which there is a large body of literature with a long tradition in economics (see e.g. Miller 2000 for a meta-analysis). In this study, we use the costs recommended by the Swedish Transport Administration, according to which the calculated cost of fatality is 25400 thousand SEK, serious injury 4700 thousand SEK, mild injury 230 thousand SEK, and property damage 15 thousand SEK (Bångman, 2016). Property damage is regarded to be larger for wild boar because of their compactness and heaviness and the average payment by insurance companies amounts to 23 thousand SEK (Gren et al. 2016). These costs assigned to different types of accidents are in the same order of magnitude as the estimates used by e.g. Huijser et al. (2008) for calculating cost of ungulate vehicle accidents in USA,
Expected cost for each ungulate depends on the probabilities of type of accidents. The probability of type of accident in Sweden is evaluated at different speed limits (Johansson 2016), where a high speed implies larger probability for fatality and severe injury. In this study, we choose the estimates made for the speed of 90 km/h, since this is the average base speed limits on major roads in Sweden (Trafiksäkerhet 2017). The calculated expected cost per ungulate is then calculated as the probability of each type of accident times the damage cost (Table 1).
7 Table 1: Allocation of different types of damages from 100 traffic accidents with moose, deer or wild boar in Sweden at an average speed of 90 km/hour, cost/accident and calculated expected cost/accident
Personal injury % of total accidentsa;
Fatality Serious Mild
Property damage % of totala Estimated expected cost/accident, thousand SEK Moose 0.14 0.77 10.11 89 108 Deer 0.001 0.03 0.96 99 19 Wild boar 100 23 Cost/accident, thousand SEKb 25400 4700 230 23 aJohansson (2016); bBångman 2016
Given the expected costs presented in Table 1, the total calculated costs of traffic accidents with the three ungulate species amount to 1372 million SEK in 2015, which corresponds to 0.03% of total GDP in the same year. Traffic accidents with deer accounts for the major part of the cost, see Figure 2.
Figure 2: Allocation of calculated total cost of traffic accidents between ungulates and type of accidents in Sweden in 2015. 0 100 200 300 400 500 600 700 800 900
Deer Wildboar Moose
M
ill
io
n SE
K
8 Vehicle accidents with deer and wild boar give rise to mainly costs of property damages, while cost of accidents with moose are more equally divided between the type of accidents. Because of the size of accidents with deer, costs of property damages accounts for 60% of total costs. This share of property damage is relatively high compared with results of cost estimates for USA, where the property damage accounts for 40% of the average collision cost with deer, elk and moose when including human injury and property damage cost (Huijser et al. 2008). The main reason for this difference is the higher probabilities of human injuries and fatalities in Huijser et al. (2008) compared with our study.
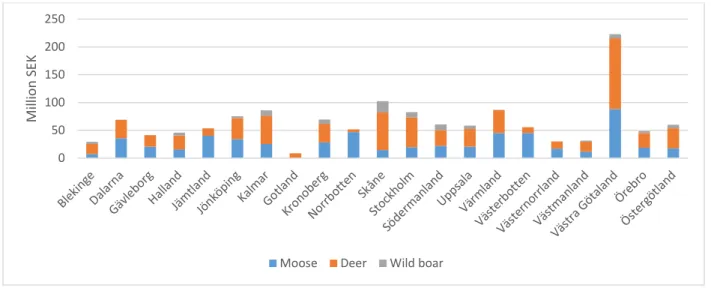
Sweden is an elongated country with different sizes of the 21 counties (Figure A1). Moose and deer are found in all counties but wild boar is not established in the most northern counties because of the cold climate, which the yearlings cannot survive (Gren et al. 2016). Given the same expected cost per accidents for the different ungulates, costs of traffic accidents depend only on the number of accidents with different ungulates (Figure A2). The calculated allocation of total costs of traffic accidents with the ungulates is unevenly distributed among counties (Figure 3),
Figure 3: Allocation of costs of traffic accidents with ungulates among counties and species in 2015. 0 50 100 150 200 250 M ill io n SE K
9 The calculated cost in Västra Götaland accounts for 16% of total costs, which is more than twice as large as for the county with the second highest cost (Skåne). The expected costs of both deer and moose are highest in this county because of the relatively large amount of accidents (Figure A2)
3. Derivation of econometric model for estimating traffic accidents with
ungulates
As shown in the preceding section, the expected cost of traffic accidents depends on the type and probability of accidents, which differ between ungulates. In this study we make a simplification by not considering type of accidents, but instead only total number of accidents. We account for differences in traffic accidents among the included ungulates. A crucial assumption is that, for each ungulate, U where U= M,D,P (M=moose, D=roe deer, P=wild boar), the number of accidents at a specific point in time, AtU, depends on traffic effort e.g. traffic load, EtA, and ungulate population, XtU. However, for given levels of EtA and XtU the number of accidents are reduced if there are mitigation measures, Mt, along the roads such as fences. We model the effect of mitigation measures as a linear decrease in the level of effort, θUMt, where θUshows the marginal counteraction of F on t EtA. The relation between is according to:
U t t U A t U U t E F X A =β ( −θ ) (1)
where βU is the ‘catchability’ coefficient which measures the change in traffic accidents from a marginal increase in either EtA or
U t
X , which is assumed to be constant over time. For a given U
β traffic accidents can increase even if EtA decreases if there is a sufficiently large increase in XtU.
10 It is assumed that population growth is independent among the ungulates and depend on landscape characteristics, Mtj where j=1,..,n characteristics, which provide suitable habitats for the ungulates. Wild boar is omnivore and there is no competition of food with the other ungulates. Moose and deer feed on the same trees such as birch, pine and aspen, but usually at different tree heights since moose is much larger than deer. The population of an ungulate in any period t+1 is then assumed to depend on population in prior period, growth during the period, and pressures in terms of accidents AUt and animals killed by hunting, BtU which is written as:
U t U t n t t U t U U t U t X G X M M A B X +1= + ( , 1,.., )− − (2) U U X X0 =
where GU(XtU,Mt1,..,Mtn) is the growth function of the species.
Another simplification is made by assuming that there is no within period interdependency between At,Uand Bt,U. For example, there might be dynamic dependency when hunting takes place first in a period which reduces the population and thereby traffic accidents later in the same period, or vice versa. Such interdependency can be valid when there is a specific hunting season and traffic accidents are reduced after the hunting season, or when traffic accidents prior to the hunting season reduce the population available for hunting. In Sweden, the hunting of moose is regulated and allowed in autumn, but the season regulation for deer varies in different parts of Sweden. With respect to wild boar, they are allowed to be killed by hunting any time during the year. Our assumption could then be invalid for moose. However, traffic accidents in general increase in mating and hunting seasons, but also during dusk and dawn during a day, because of the animals’ movements in these periods which make them more prone to traffic accidents (Thurfjell et al. 2015; NVR 2017). Although At,Uand Bt,Uare assumed to be independent within the same period, equation (2) shows that there is a dependency among periods where higher hunting pressure in one period reduces future population and thereby accidents as shown in eq. (2).
We follow a large part of the literature in bioeconomics by assuming a logistic growth function (e.g. Schaefer 1954; Schwabe et al. 2002; Kataria 2007; Gren et al. 2016), which gives
11 − = U tUU t U t n t t U t U K X X r M M X G ( , 1,.., ) 1 (3) where ( t1,.., tn) U U t r M M
r = is the intrinsic growth rate and KU is the maximum size of the population under conditions of no pressure. Following Gren et al. (2016) it is assumed that the landscape characteristics enter the intrinsic growth rate so that j
t U j n j U U t b d M r = +
∑
=1 , . Given these assumptions and equations (1)-(2), the rate of change in the population during time can be written as U t U t t U A t U U U t j t U j n j U U t U t U t X B F E K X M d b X X X − − − − + = −∑
= + ) ( 1 ) ( , 1 1 β θ (2’) U U X X0 =However, (2’) can not be subject to any regression analysis since time series population data are not available, which is a well-known problem in wildlife management. A common approach for estimating the latent population variable is to use catch per unit effort (CPUE) as a proxy for relative population abundance, and to assume that the growth rate in CPUE reflects the growth rate in the underlying population (e.g., Arreguín-Sánches, 1996). In our study, the corresponding abundance constructs based on traffic accidents is obtained from (1) and is defined as
) ( , t U A t U t U t U A U t F E A X x θ β − =
≡ , which shows the number of traffic accidents per net traffic effort
(TAPUE).
We can choose the rate of change over time in either xUt ,A or similar concept for hunting bags per effort (BAPUE defined as B
t U t U t U B U t E B X
x , ≡α = ) as an approximation of the rate of change in the population as defined in equation (2’). Irrespective of choice, we can obtain estimates of the intrinsic growth rate, carrying capacity, and catchability coefficients needed for estimating the
12 population function. The steps for obtaining this result is shown for xUt ,A . By replacing X with tU
U A U t x β ,
(from the definition of xUt A
, ) in equation (2’) we obtain: j t U j n j A U t U t t U A t U A U t U U U t U A U t A U t M d x B F E x K r b x dt dx , 1 , , , ,
∑
= + + − − − = β θ β (4)From (4) we can derive a regression equation which can be estimated as:
U t j t j U n j A U t U t U t U A t U A U t U U U t L x B F E x Y =γ ,1+γ ,2 , +γ ,3 +γ ,4 +γ ,5 , , +
∑
=1 ν , +ε (5) where , , ,1 , ,2 , ,3 , , U U U U U t U U U A U t A U t U t K r b x dt dx Y γ β β γ γ = = = = A t U U U E / 4 , β θ γ = , j U j U U t U t U U d B A , , 5 , , = =β ν γ , j t j U n j U U t M r , 1 1 ν γ +∑
== , and the carrying capacity is calculated
as ,2 ,3 , 1 1 , U U j t j U n j U U t M K γ γ ν γ +
∑
== . The expression for U
t U t U U B A β γ ,5 = is obtained by recognizing that t U A t U t A U t F E A x θ − = ,
in the fifth term at the right hand side of (5) and that the impact of UA t U t x B ,
in the parenthesis in eq. (4) is proportional to that of t A t F
E − .
However, if rate of changes in xtU,A show worse statistical performance than xUt ,B, which is the case for one of the ungulates in our regression analyses presented in Section 4, we can still obtain a measure of the traffic catchability coefficient and predict accidents. Equation (4) is then changed to: j t U j n j B U t U t B t U A U t U U U t U B U t B U t M d x A E x K r b x dt dx , 1 , , , ,
∑
= + + − − = α β (4’)13 U t j t j U n j B t U B U t U t U A U t U U U t E M x A x Y =γ +γ +γ +γ +
∑
= ν , +ε 1 4 , , , 3 , , 2 , 1 , (5’)where γ,U,4 =αU and we can obtain an expression for βU in equation (5’) from the third term at the right hand side where U
A t U B U t U t E x A α β = , from which U B t A U t U U t x x , , α β = .
4. Description of data and econometric results
As shown in Section 3 we can estimate a population function for an ungulate which is subject to pressure from traffic and hunting with data on traffic accidents and volume, hunting bags and efforts, and landscape characteristics. In this study, we have access to panel data set with these variables for each county in Sweden for the years 2003-2015. Estimation of a panel requires appropriate methods. Both data retrieval and estimations are described in this section.
4.1 Data retrieval
Data on ungulate bags and traffic accidents in the 21 different Swedish counties are available from 2003 until 2015 (NVR 2017). When growth rate in BAPUE (hunting bags per unit effort) is used as dependent variable, an ideal effort variable would be number of hunters and their activities allocated on hunting the different ungulates. Unfortunately, such an effort variable is not available, but only number of issued hunting licenses in each county (Bladh, 2016). This variable might not fully describe the effort variables since some owners of the licenses do not hunt, and some others travel between counties in order to hunt. In this respect, traffic load as an effort variable and the use of growth rate in TAPUE as a proxy for changes in the population is more accurate since it shows the number of km by cars in each county (RUS, 2016). Data on traffic accidents with ungulates are obtained from NVR (2017), which is considered as relatively accurate. Since 1987
14 drivers are obliged by §40 Jaktförordningen to report wildlife accidents and injured animals to the authorities. Traffic load is measured in millions of kilometers driven in each county (RUS 2016).
Following the literature, we include data on landscape characteristics which are; areas of forest, agricultural and pasture land for each county (Swedish Statistics 2016). Forest may provide some difficulties for drivers to detect movements of ungulates in the landscape and thereby, ceteris paribus, increasing the probability of an accident. On the contrary, arable and pasture land with a more open type of landscape tend to improve visibility thereby reducing the risk of an accident. However, a more open type of landscape would be less attractive to the ungulates that often tend to congregate in the intermittent area of forest and open landscape elements.
In addition to landscape characteristics, the presence of wildlife fences along certain roads can mitigate accidents and affect growth of ungulate populations. The roads as such can affect population, not only through accidents, but also as barriers for ecological corridors and pathways for the animals. In this study we therefore include the length of fences and roads as explanatory variables (Bylund, 2017). In addition, the size of the county are included as a control variable.
Given all assumption, the descriptive statistics for the dependent and independent variables used in the regressions are as shown in Table 2
15 Table 2: Descriptive statistics, where U= M, D, P i.e. moose (M), deer (D), and pigs (P), and N=252 for moose and deer, and N=160 for pigs
Variable Mean Standard
deviation Min Max BAPUE (Bags per hunting license), xU,B SM,H 0.31 SD,H 0.48 SP,H 0.36 SM,H 0.25 SD,H 0.40 SP,H 0.35 SM,H 0 SD,H 0.01 SP,H 0 SM,H 1.28 SD,H 2.41 SP,H 1.59 TAPUE (Accidents per traffic load), xU,A
SM,A 0.14 SD,A 0.68 SP,A 0.08 SM,A 0.13 SD,A 0.36 SP,A 0.09 SM,A 0 SD,A 0 SP,A 0 SM,A 1.22; SD,A 1.79 SP,A 0.50 Growth rate in BAPUE, YU,B YM,H 0.017 YD,H 0.028 YP,H 0.429 YM,H 0.20 YD,H 0.33 YP,H 1.16 YMH -0.99 YD,H -0.77 YP,H -0.90 YM,H 0.846 YD,H 1.67 YP,H 7.65 Growth rate in TAPUE, YU,A YM,A 0.035 YD,A 0.058 YP,A 0.256 YM,A 0.22 YD,A 0.23 YP,A 0.47 YM,A -0.87 YD,A -0.94 YP,A -0.79 Y,M,A 0.72 YD,A 1.25 YP,A 1.88 Number of bags, BU HM 4280 HD 5604 HP 3742 HM 3973 HD 5226 HP 3771 HM 0 HD 237 HP 0 HM 15943 HD 33598 HP 19201 Number of accidents, AU AM 253 AD 1501 AP 172 AM 167 AD 1180 AP 175 AM 0 AD 0 AP 0 AM 1025 AD 6696 AP 899 Number of licenses 12959 7219 1690 37401 Traffic load, million km 2631 2721 341 11380 Forest, 1000 km2 1389 1505 147 6435 Agriculture land, 1000 km2 127 117 31 488 Pasture land, 1000 km2 23 21 2 78 Area, 1000 km2 1539 1475 225 6476 Fences, km 228 195 0 1013 Roads, 10 km 4389 2594 592 12658
The average growth rate measured as BAPUE and TAPUE are relatively similar for the ungulates, but they differ among the ungulates considerably higher for wild boar than for the other included ungulates. The pressure on the populations from hunting is considerably higher than that from
16 traffic accidents. The number of bags are at least 3.5 times larger than number of accidents. For wild boar, this difference is even higher and amounts to approximately 22 times the number of accidents.
4.2 Econometric results
Since the data set is a panel with observations for 21 counties over the period 2003-2015 we test for fixed or random effect model by a Hausmann test, and if a random effect model is statistically better than an ordinary least square estimate. The observed p-value of the Breusch-Pagan tests indicated that the null-hypothesis of no variances across the counties cannot be rejected, favoring a random effects model (Table A2). However, tests revealed the existence of contemporaneous correlation among counties (Table A2). Cross-sectional dependence is likely to occur in a relatively small country as Sweden where our units of analysis, counties, are subjected to the same type of national regulations and neighboring counties face similar weather conditions. If our independent variables do not reflect these cross-sectional dependencies the estimated standard errors will be affected. We therefore estimated our models with Driscoll and Kraay (1998) standard errors which are heteroscedasticity consistent and account for cross-sectional and temporal correlations. We also tested for the existence of multicollinearity and the VIF showed an acceptable value for all regressions (<2.63 in average).
Recall from the theoretical Section 3 that we can use either growth rate in BAPUE or TAPUE as dependent variable with associated explanatory variables. It turned out the TAPUE gave the best statistical fit for deer and wild boar, and BAPUE for moose. We also made regressions with different constructs of road, total length and in relation to the area of the county, but the inclusion of these constructs reduced the statistical performance of the regressions. On the other hand, fences as share of road length, and the landscape constructs turned out to be significant for some models (Table 3).
17 Table 3: Regression results from pooled OLS and Driscoll and Kray standard errors (p-values in parentheses).
Moose (Growth rate in BAPUE)
Deer (Growth rate in TAPUE)
Pig (Growth rate in TAPUE) Constant 0.064* (0.078) 0.346*** (0.001) 0.461** (0.013) Licens -0.0128-3*** (0.000) Traffic load -0.033-3*** (0.001) -0.004-3** (0.021) Bags/hunting licenses, xU,B -0.140** (0.013) Accidents/traffic load, xU,A -0.282*** (0.000) -1.635 *** (0.001) Accidents divided by xU,B , AU/xU,B 0.066-3*** (0.003)
Bags divided by xU,B,
BU/xU,A
0.005-3*** (0.001) 0.001-3 (0.287)
Forest 0.056-3*** (0.000) -0.021-3 (0.368) 0.262-3* (0.071)
Agricultural land -0.164-3 (0.162) -0.220-3 (0.277) 0.312-3 (0.225)
Pasture land 0.836-3 (0.274 1.128-3 (0.401) -3.604-3* (0.082)
Fence/ road length -0.459* (0.082) -1.311** (0.021)
R2 0.15 0.17 0.13
Prob>F 0.000 0.000 0.000
All constants, which are used to calculate the intrinsic growth rates as shown in eq. (2’), are significant and positive. We also obtain significant and expected signs of the effort variables Licens for moose and Traffic load for deer and pig. Similarly, the estimated coefficients of xU,B and xU,A are negative as expected, and significant. The estimated positive signs of the impact of the effort variable not included in the dependent variable, AU/xU,B for moose and BU/xU,A for moose and deer, may seem counterintuitive. However, as shown in Section 3 equation (5), these coefficients should be multiplied with the coefficient estimates of xU,B for moose and with xU,A for deer and pigs in order to obtain an expression for the effect of the second pressure. These coefficients are negative, and hence the pressure of traffic load on moose and hunting licenses on roe deer and pigs are negative as expected. Similarly, the negative coefficient of fence/road length are expected since, from Section 3, the counteracting impact of mitigation measures are calculated as U
U U
β γ θ = ,4 .
18 With respect to landscape characteristics, forests contribute positively and significantly to the growth rate of moose and pigs, and grassland has a significant and negative effect on the growth rate of wild boar. We calculate the intrinsic growth rate for the ungulates at the mean values of the coefficient of these landscape variables, which gives 0.15, 0.34 and 0.47 for moose, deer and wild boar respectively. The intrinsic growth rate for wild boar is close to that obtained by Gren et al. (2016) and Jansson et al (2012). Gren et al. (2016) used the same method and data for calculating wild boar population dynamics as in current study but with data for a shorter time period. Their result showed an intrinsic growth rate of 0.48, which is the same as that obtained from age-structured models of a single local population by Lemel and Truvé (2008) and Jansson et al. (2012).
5. Predictions of costs of traffic accidents
We test the estimated regression functions by comparing the predicted and actual traffic accidents for the year 2015. The calculated population of deer, wild boar and moose amount to, in average per county, 22381, 18301, and 20801 respectively. The associated total populations for Sweden then amounts to 470001, 238177, and 416020. Except for wild boar it is difficult to compare these estimates with results from other studies since similar calculations have not been carried out. Using the same approach as in this study, Gren et al. (2015) estimated a total wild boar population of approximately 127000 in 2011 and Jansson et al. (2012) reports a population level of 150000 for the same year. The number of accidents with wild boar increased by 91% from 2011 to 2015 (Table A1), and the traffic volume by 3% (RUS 2016). Our estimate of a population level of 238177 in 2015 thus seems reasonable. With respect to roe deer, Svenska Jägarförbundet (2017a) reports a population density, roe deer/1000 ha productive forest land, ranging between 20 and 60 animals. Our estimate shows an average of 44 animals/1000 ha, which is thus within the reported range. The population of moose is estimated to vary between 300000 and 400000 animals (Svenska Jägareförbundet 2017b), and our estimate of 416020 is then slightly higher than the upper range.
When predicting the traffic accidents with deer and wild boar we use the estimated with accidents divided by traffic volume, xUt ,A, in Table 3. Since the regression results for moose with rates of
19 changes in xtU,A as dependent variable were poor relative to the estimates with bag per hunting license, xUt ,B, we can not use the coefficients directly but derive the traffic accident catchability coefficient as shown in eq. (4) in Section 3. Except for two counties, the deviations from the actual number of accidents do not deviate by more than 1% from the actual number for any county and ungulate (Tables A3-A5).
We calculate costs of traffic accidents over a period of 15 years, which is the planning period used by the Traffic Transportation Board (Trafikverket, 2014). As shown in Section 3, the population and thereby traffic accidents depend on the forecasted traffic volume and hunting efforts. Trafikverket has (2014) predicted an average annual increase in traffic volume by 1%. In the base scenario we therefore assume this increase in the traffic volume, and an unchanged level of hunting pressure, which currently amounts to approximately 20% of the calculated population in 2015. In this scenario, the predicted accidents for the three ungulates are as displayed in Figure 5.
Figure 5: Predicted vehicle accidents with different ungulates with unchanged hunting pressure and an average increase in traffic volume by 1% per year
0 5000 10000 15000 20000 25000 30000 35000 40000 0 2 4 6 8 10 12 14 Ve hi cl e a cci de nt s
20 The relatively small increase for deer is explained by the relatively large number of traffic accidents which reduces growth in the population, which, in turn, decreases future accidents. This is, in turn, explained by the share of traffic accidents with deer in relation to the calculated population level (Table A1), and the associated estimated traffic volume coefficient. On the other hand, accidents with wild boar are predicted to increase with approximately 136%, which is due to the estimated high intrinsic growth rate. Accidents with moose show a slight increase by approximately 23% from 2015 level.
The expected costs per accident and ungulate are assumed to be constant during the period and correspond to the costs presented in Table 1 in Section 2, and assign a social discount rate of 1.5%, which is the level recommended in cost-benefit analysis (Boardman et al. 2012). The calculated total discounted cost in the base scenario then amounts to 22344 million SEK in the base scenario. Despite the increase in traffic accidents with moose and wild boar shown in Figure 5, the annual cost of traffic accidents in present value remains relatively unchanged over time (Figure 6).
Figure 6: Development of discounted total costs of traffic accidents with ungulates in Sweden with unchanged hunting effort and increased traffic volume with 1% per year.
0 200 400 600 800 1000 1200 1400 1600 1 2 3 4 5 6 7 8 9 10 11 12 13 14 15 M ill io n SE K Year
21 The monotonic decrease in costs of traffic accidents is due to the discount rate since the number of accidents is relatively stable over time. The discount rate also explains the lower increase in costs for wild boar and moose than corresponding increases in accidents.
However, the development of cost of traffic accident for a county can deviate considerable from the total development. For example, in Va Götaland the county with the largest number of traffic accidents with ungulates, the expected total discounted cost of accidents increases by 15%. (Figure 7).
Figure 7: Development of discounted costs of traffic accidents in Va Götaland county with unchanged hunting effort and increase in traffic volume by 1.2% per year.
The increase in costs is due to the increase in traffic volume, which is expected to raise by 1.2% per year, and the increases in the populations of wild boar and moose. As shown in Figure 7, the cost of accidents with wild boar shows a tenfold increase. This is explained by the recent establishment and associated low population of the animal in Va Götaland, and the high calculated intrinsic growth rate for the animal in this county (Table A5).
This pattern of increasing costs of traffic accidents with wild boar is applicable to all counties where the animal is established. The relative increase is smaller for counties where wild boar has resided for several decades, such as in Skåne (Figure A4). The traffic volume increases by 1.3%
0 50 100 150 200 250 0 1 2 3 4 5 6 7 8 9 10 11 12 13 14 15 M ill io n SE K Years
22 in this county but the calculated total cost of accidents decreases by 24% because of the decrease in accidents with deer and moose. On the other hand, calculated costs of traffic accidents with deer or moose increase in the northern counties, such as Jämtland, where the calculated intrinsic growth rate of the animals is high.
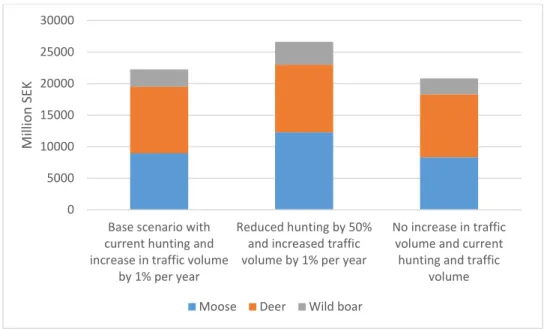
However, the estimated total costs are affected by the assumptions of increases in traffic volume and hunting pressure. Without any increase in the traffic volume, total cost decrease to approximately 21 000 million SEK. On the other hand, if hunting pressure is reduced by 50%, the predicted total costs increase to approximately 28000 million SEK (Figure 8).
Figure 8: Calculated discounted total costs of traffic accidents with ungulates in Sweden during 15 years under different combinations of future hunting effort and traffic volume.
Total costs increase by approximately 25% from the base scenario when hunting efforts are reduced, which is mainly due to the increase in traffic accidents from moose and wild boar. The effect of an avoided increase in traffic volume is a decline in total costs by approximately 7%, which is of the same order of magnitude for all ungulates.
0 5000 10000 15000 20000 25000 30000
Base scenario with current hunting and increase in traffic volume
by 1% per year
Reduced hunting by 50% and increased traffic volume by 1% per year
No increase in traffic volume and current
hunting and traffic volume M ill io n SE K
23 6.
Discussion and conclusion
The main purpose of this study has been to calculate and predict costs of traffic accidents with ungulates, moose, roe deer and wild boar, in Sweden. The tool rests on the assumption that traffic accidents is determined by traffic volume and wild life populations, and populations, in turn, are determined by pressure from traffic volume and hunting and from landscape characteristics including composition of land use and fences along major roads. A specific challenge is to estimate the population sizes, on which there is no data. This study used a method proposed by Gren et al. (2016) which was developed by with respect to the consideration of two types of pressures. The method has been much used in fishery economics where the latent population variable is derived from changes in the growth rate of catch per unit effort. Two effort variables, or pressures on ungulates, were identified; traffic load and hunting. Both these variables were used for estimating population functions for moose, deer, and wild boar with panel data for counties in Sweden for the years 2003-2015.
The regression results showed intrinsic growth rate of 0.14, 0.33, and 0.47 for moose, deer and wild boar respectively when evaluated at the mean values of the explanatory variables. Differences in these growth rates explain to a large extent the predicted costs of traffic accidents over a period of 15 year, which decline for moose and deer but increase for wild boar. However, the total discounted cost ranges between 21 000 and 28 000 million SEK, or 1400 million SEK and 1870 million SEK annually, depending on assumptions of future hunting pressure and changes in traffic volume. Vehicle accidents with roe dear and moose account for approximately 45% each, but wild boar shows the most rapid increase in costs because of its high intrinsic growth rate and recent establishment in several counties. A decrease of hunting bags from about 20% of the calculated population sizes to 10% increased the total cost of accidents by approximately 25%. This result support the suggestion by other studies to consider hunting as a measure for combating traffic accidents (e.g. Schwabe et al. 2002).
However, we have not accounted for underreporting of traffic accidents, which can be severe where actual accidents can be more than twice as high as the reported number (e.g. Helldin 2013). This will undoubtedly affect the level of accidents and thereby the calculated costs. It is not clear
24 whether it will affect our predictions of costs. Snow et al (2015) analyse the effect of this factor for large ungulates in US but find that the predictive power of the models of accidents are not significantly affected. One reason can be the randomness in underreporting, i.e. it is not biased towards specific spatial or dynamic patterns.
Another simplification has been the neglect of eventual behavioral adaption of the animals to pressure, including hunting and traffic. The animals may learn the spatial allocation of risks of being killed and avoid these areas. This has been shown for elk in where the risks of accidents (Cuite et al 2012), and for wild boar in Sweden (Thurfjell et al. 2015). Thurfjell et al. (2015) point out the role of animal behavior and show that wild boar in Sweden learn to avoid crossing roads with heavy traffic, resulting in higher accidents at roads with intermediate traffic. If so, the relation between population size, traffic volume and accidents is more complex and time dependent than in our model where it is assumed to be constant.
The choice of a logistic growth function has been criticized because of the neglect of composition of population cohorts, and disregard of stochastic shocks to the population (e.g. Clark, 1990). Other functions, such as age or stage structure models, might give other predictions of population developments. On the other hand, such models are quite data demanding with respect to biological parameters such as reproduction and survival strategies for different cohort. Such data are most often non-existent at the large scale level. Nevertheless, our estimates of populations of moose, deer and wild boar come relatively close to the few known estimates of these ungulates, and the associated predicted accidents are within a small range from actual number of accidents for all included ungulates.
25
Appendix: Tables A1-A5, Figures A1-A4
Table A1: Accidents with ungulates and traffic volume in Sweden during 2003-2015.
Year Accidents;
Moose Deer Wild boar Total
Traffic volume, mill km Accidents/mill km 2003 4 204 27720 755 32 679 53062 0.617 2004 4 641 28430 670 33 741 53557 0.630 2005 4092 27761 987 32 840 53915 0.609 2006 4957 27706 1020 33 683 54548 0.617 2007 4635 28243 1583 34 461 53886 0.639 2008 5118 30982 2464 38 564 56314 0.684 2009 5761 33798 3085 42 644 55832 0.763 2010 7227 36107 2445 45 779 55100 0.830 2011 5994 30654 2647 39 295 55456 0.708 2012 5963 34866 4198 45 027 54922 0.819 2013 5771 35552 3551 44 874 54978 0.816 2014 5141 35914 3783 44 838 55996 0.801 2015 4914 36513 4229 45 656 57013 0.801
26 Table A2: Regression results with random effect model with robust standard errors (p-values in parentheses).
Moose (Growth rate in BAPUE)
Deer (Growth rate in TAPUE)
Pig (Growth rate in TAPUE) Constant 0.064* (0.078) 0.335*** (0.037) 0.462*** (0.000) Licens -0.0128-3*** (0.000) Traffic load -0.031-3*** (0.004) -0.044-3*** (0.000) XB -0.140** (0.013) xA -0.296*** (0.000) -1.635 *** (0.000) A/xB 0.066-3*** (0.003) B/xA 0.005-3** (0.046) 0.001-3** (0.032) Forest 0.056-3*** (0.000) -0.019-3 (0.201) 0.262-3*** (0.001) Agricultural land -0.164-3 (0.162) -0.310-3 (0.204) 0.312-3 (0.252) Pasture land 0.836-3 (0.274 1.445-3 (0.351) -3.604-3** (0.024) Fence/road area -0.175(0.592) -1.311** (0.010) Breusch-Pragan test of random effects p=1.00 p=0.127 p=1.000 Pesarana test of cross sectional dependence p=0.000 p=0.000 p=0.000 Wald test 272.01 68.71 197.26 Prob>F 0.000 0.000 0.000 a Pesaran (2004)
27 Table A3: Calculated intrinsic growth rate, population, accidents, maximum population size, and deviation in calculated accidents from actual accidents with moose, all numbers are evaluated at the mean values over the years for each county
Intrinsic growth rate
Population Accidents Maximum population Deviation in pred. accidentsa Blekinge 0.06 5567 76 33334 -0.04 Dalarna 0.17 32324 306 97240 -0.01 Gävleborg 0.14 33011 174 78965 -0.01 Halland 0.05 8931 167 28277 -0.02 Jämland 0.24 81028 389 136327 -0.01 Jönköping 0.06 17083 406 32109 -0.01 Kalmar 0.03 29503 277 15228 0.02 Gotland Kronoberg 0.08 22719 312 42722 -0.01 Norrbotten 0.40 39104 396 223484 0.01 Skåne 0.04 1783 157 19938 -0.04 Stockholm 0.06 4399 205 32871 -0.03 Södermanland 0.05 15083 201 27343 -0.04 Uppsala 0.05 15324 146 26979 0.01 Värmland 0.12 35399 474 69330 -0.02 Västerbotten 0.28 50092 377 158359 -0.01 Västernorrland 0.16 45274 223 89751 -0.03 Västmanland 0.06 18298 104 33314 -0.01 Va Götaland 0.02 13570 698 83205 -0.01 Örebro 0.07 25820 200 41306 -0.01 Östergötland 0.03 19224 151 17957 0.00 Total average 0.11 20801 272 60711 -0.01
28 Table A4: Calculated intrinsic growth rate, population, accidents, maximum population size, and deviation in calculated accidents from actual accidents with deer, all numbers are evaluated at the mean values over the years for each county
Growth rate
Population Accidents Maximum population Deviation in pred. accidentsa Blekinge 0.31 29354 867 35195 0.01 Dalarna 0.28 27687 1562 31633 0.00 Gävleborg 0.25 16286 870 28894 0.01 Halland 0.28 17589 1064 31931 -0.01 Jämland 0.28 22475 600 31591 0.00 Jönköping 0.32 29315 1956 36413 0.00 Kalmar 0.38 33973 2050 43823 -0.01 Gotland 0.33 12377 135 37624 0.02 Kronoberg 0.31 32019 1550 35748 0.00 Norrbotten 0.21 3908 199 23881 0.05 Skåne 0.27 14983 3321 30623 -0.01 Stockholm 0.31 7491 2511 34893 -0.01 Södermanland 0.28 27687 1381 32122 -0.01 Uppsala 0.27 26710 1545 31118 0.00 Värmland 0.26 34527 1943 30408 0.01 Västerbotten 0.22 6840 321 25594 0.02 Västernorrland 0.27 12052 576 31071 0.00 Västmanland 0.27 19869 935 30818 0.00 Va Götaland 0.20 22149 6696 23312 -0.07 Örebro 0.27 26058 1330 31288 0.00 Östergötland 0.31 22475 1695 34389 0.00 Average in total 0.30 22182 1543 33912 -0.01
29 Table A5: Calculated growth rate, population, accidents, maximum population size, and
deviation in calculated accidents from actual accidents with wild boar, all numbers are evaluated at the mean values over the years for each county
Growth rate
Population Accidents Maximum population Deviation in pred. accidentsa Blekinge 0.43 23863 100 58994 0.01 Halland 0.37 13181 113 51953 -0.01 Jönköping 0.44 9091 86 61503 -0.01 Kalmar 0.43 37951 251 59329 0.00 Kronoberg 0.51 54771 287 71342 0.00 Skåne 0.46 17500 551 63829 0.00 Stockholm 0.52 4091 195 72422 0.01 Södermanland 0.39 36591 259 53809 0.00 Uppsala 0.46 11818 97 64106 -0.03 Västmanland 0.36 4773 32 49443 0.00 Va Götaland 0.67 2500 101 92227 -0.03 Örebro 0.52 8409 61 72634 -0.02 Östergötland 0.48 13409 144 66695 0.00 total 0.46 18304 175 64484 -0.01
30 Figure A1: Counties in Sweden
31 Figure A2: Allocation of traffic accidents with ungulates among counties and ungulates in 2015
Figure A3: Expected costs of traffic accidents with ungulates among counties and ungulates in 2015, SEK/km traffic volume
0 1000 2000 3000 4000 5000 6000 7000 8000 Num be r o f a cc ide nt s
Deer Wildboar Moose
0 10 20 30 40 50 60 SE K
32 Figure A4: Development of discounted costs of traffic accidents in Skåne county with unchanged hunting effort and increase in traffic volume by 1.3% per year.
References
Arreguín-Sánches, F. 1996. Catchability: a key parameter for fish stock assessment. Reviews in Fish Biology and Fisheries 6. 221-242.
Bissonette J, Kassar CA, Cook LJ. 2008. Assessment of costs associated with deer–vehicle collisions: human death and injury, vehicle damage, and deer loss. Human-Wildlife Conflicts 2, 17-27.
Bladh, D. 2016 Statistik på jaktkort. Swedish Environmental Protection Agency.
Boardman A., Greenberg D., Vining A., Weimer D. 2012. Cost benefit-analysis. Concepts and practice. Fourth edition. Pearson International Edition.
Bylund, T. 2017. Data on fences and road length in different counties 2003 to 2015. Trafik Analys, Stockholm, Sweden.
Bångman, G. 2016. Analysmetod och samhällsekonomiska kalkylvärden för transportsektorn: ASEK 6.0. Kapitel 20 English summary of ASEK recommendations. T. S. T. Administration. Trafikverket.
Clark C.W. 1990. Mathematical bioeconomics: the optimal management of renewable resources. 2nd edition. John Wiley and Sons, Inc., New York.
0 10 20 30 40 50 60 70 80 90 100 0 1 2 3 4 5 6 7 8 9 10 11 12 13 14 15 M ilj on er SE K Years
33 Conover, M.R., Pitt, W.C., Kessler, K.K., DuBow, T.J., Sanborn, W.A. 1995. Review of Human
Injuries, Illnesses, and Economic Losses Caused by Wildlife in the United States. Wildlife Society Bulletin 23, 407–414.
Driscoll, J., Kraay, A. 1998. Consistent covariance matrix estimation with spatially dependent panel data. Review of Economics and Statistics, 80, 549-560.
Found, R., Boyce, M. 2011. Predicting deer-vehcile colliions in an urban area. Journal of Environmental Management 92, 2486-2493.
Gagnon, J., Loberger, C., Sprague, S., Ogren, K., Boe., S., Schweinsburg, R. 2015.
Cost-effective approach to reducing vehicle collisions with elk by fencing between existing highway structures. Human-Wildlife Interactions 9, 248-264.
Glista, D., DeVault, T., DeWoody, A. 2009 A review of mitigation measure for reducing wildlife mortaliy on roadways. Landscape and urban planning 91, 1-7.
Gren, I-M., Häggmark.Svensson, T., Andersson, H., Jansson, G., Jägerbrand, A. 2016. Using traffic data to calculate wild life populations. Journal of Bioeconomics, 18, 17-31.
Gunson, K., Mountrakis, G., Quackenbush, L. 2011. Spatial wild-life vehicle collision models: A review of current work and its application to transporte mitigation projects. Journal of
Environmental Management 92. 1074-1082.
Helldin, J-O. 2013. Påkörda djur – trafikdödlighet ett växande naturvårdsproblem. Rapport, Centrum för Biologisk Mångfald, Sveriges Lantbruksuniversitet, available at
http://media.triekol.se/2013/10/Triekol-CBM-skrift-77-lowres.pdf.
Huijser, MP., McGowen, P., Fuller, J., Hardy, A., Kociolek, A., Clevenger, A.P., Smith, D., Ament, R. 2008. Wildlife-Vehicle Collision Reduction Study: Report to Congress. Western Transportation Institute, Montana State University. Available at
https://www.fhwa.dot.gov/publications/research/safety/08034/08034.pdf (access date July 27,
2017) .
Huijser, MP., Duffield, J., Clevenger, A., Ament, R., McGowen P. 2009. Cost benefits analyses of mitigation measures aimed at reducing collisions with large ungulates in the Unistead States and Canada: a decision support tool. Ecology and Society 14, 15.
Hussain, A., Armstrong, J., Brown, D., Hogland, J. 2007. Land-use pattern, urbanization, and deer-vehicle collisions in Alabama. Human-Wildlife Conflicts 1, 89-96.
Häggström-Svensson T., Gren I-M., Ankdersson H., Jansson G., & Jägerbrand A. 2014. Costs of traffic accidents with wild boar in Sweden. Working Paper 2014:05. Department of Economics, Swedish University of Agricultural Sciences, Uppsala, Sweden. At
34 Jansson, J. O. 1994. Accident externality charges". Journal of Transport Economics and Policy 28, 31-43.
Jansson G., Månsson J., Nordström J. 2012. GPS-märkta vildsvin hjälper oss att förstå deras beteende. Svensk Jakt, 9, 96-98.
Johansson, Ö. 2016. Sannolikheter för trafikolyckor med klövdjur i Sverige. Väg och Transport institutet, Borlänge, Sweden.
Lemel J., Truve J. 2008. Vildsvin, jakt och förvaltning – Kunskapssammanställningför LRF. Svensk Naturförvaltning AB, Rapport 04.
Miller, T. 2000. Variations between countries in values of statistical live. Journal of Transport Economics and Policy 34, 169-188.
Mishan, E.J. 1971. Evaluation of life and limb: a theoretical approach. Journal of Political Economy 79, 687-705.
NVR (Nationella Viltolycksrådet) 2017. Viltolyckor under de senaste 5 åren. Available at
http://www.viltolycka.se/statistik/viltolyckor-de-senaste-5-aren/ (access date March 21, 2017).
Pesaran, M.H. 2004. General diagnostic tests for cross section dependence in panels. Cambridge Working Paper in Economics, 0435, University of Cambridge.
RUS (Regional Utveckling och Samverkan) 2016 Körsträckedata. Available at
http://extra.lansstyrelsen.se/rus/Sv/statistik-och-data/korstrackor-och-bransleforbrukning/Pages/default.aspx (access date August 21, 2016).
Rytwinksi, T., Soanes, K., Jaeger, J., Fahrig, L., Findlay, S., Houtalan, J., van der Ree R., vad der Griff E. 2016. How effective is road itigation at reducin roak-kill? A metal-analysis. PLOS ONE 21, 1-25.
Seiler, A. 2004. Trends and spatial patterns in ungulate-vehicle collisions in Sweden. Wildlife Biology 10, 301-310.
Schaefer M. 1954. Some aspects of the dynamics of populations important to the management of the commercial marine fisheries. Bulletin of the Inter-America Tropical Tuna Commission, 1, 25-56.
Schwabe, K.A., Schuhmann, P.W., Tonnnkovich, M. 2002. A dynamic exercise in reducing deer-vehicle collisions: Management through vehicle mitigation techniques and hunting. Journal of Agricultural and Resource Economics 27: 261-280.
Snow N., Porter, W., Williams, D. 2015. Underreporting of wildlife-vehicle colliions does not hinder predictive models for large ungulates. Biological Conservation 181, 44-53.
35 Swedish Statistics 2016. Land use in Sweden. Available at
http://www.statistikdatabasen.scb.se/pxweb/sv/ssd/START__MI__MI0803__MI0803A/Markanv
Lan/?rxid=f45f90b6-7345-4877-ba25-9b43e6c6e299 (access date November 18, 2016).
Svenska Jägareförbundet 2017a. Rådjur, population. Available at
https://jagareforbundet.se/vilt/vilt-vetande/artpresentation/daggdjur/radjur/radjur-population/
(access date May 21 2017).
Svenska Jägareförbundet 2017b. Älgar, population. Available at
https://jagareforbundet.se/vilt/vilt-vetande/artpresentation/daggdjur/alg/alg-population/
(access date May 22 2017).
Thurfjell, H., Spong, G., Olsson, M., Ericsson, G. 2015. Avoidance of high traffic levels reults in lower risk of wild boar-vehicle accidents. Landscape and Urban Planning 133, 98-104.
Trafikanalys 2017 .Road traffic injuries 2015, Table 6.1 pp . Available at
http://www.trafa.se/globalassets/statistik/vagtrafik/vagtrafikskador/vaegtrafikskador_2015.pdf
(access date March 23 2017).
Trafikverket 2014. Prognos för personresor 2030. Report no 2014:071, Borlänge, Sweden. Trafiksäkerhet 2017. Hastighetens betydelse for trafiksäkerheten. Available at
http://www.trafiksakerhet.se/hastighet.htm (date of access July 25, 2017).
Witmer G.W., DeCalesta D.S. 1991. The need and difficulty of bringing the Pennsylvanian deer herd under control. Fifth Eastern Wildlife Damage Control Conference (1991), paper 45, at
http://digitalcommons.unl.edu/cgi/viewcontent.cgi?article=1044&context=ewdcc5 (access date
July 13, 2017).
View publication stats View publication stats