How does noise annoyance relate to traffic
intensity?
T. Jerson1, M. Ögren2, E. Öhrström3, A. Gidlöf Gunnarsson3
1 WSP Acoustics Rullagerg. 6, SE415 26 Gothenburg, Sweden Tel: +46 31 7272 647, Email: tomas.jerson@wspgroup 2 VTI the Swedish National Road and Transport Research Institute, Box 8077, SE402 78 Gothenburg, Sweden Tel: +46 31 750 26 04, Email: mikael.ogren@vti.se 3 Sahlgrenska Academy at the University of Gothenburg Box 414, SE405 30 Gothenburg, Sweden
Tel: +46 31 786 36 10, Email: evy.ohrstrom@amm.gu.se, anita.gidlof@amm.gu.se
Summary
This study is part of the Swedish research program TVANE, where a number of questionnaire surveys has been performed. A comparison between three areas demonstrate that the reported annoyance is higher where the traffic intensity is higher even if the equivalent noise level is the same. The traffic intensity varies with a factor of 7 between the areas, and the reported annoyance is increased 1.3 – 2.5 times.
1 Introduction
In an international context Sweden has relatively moderate railway traffic intensity, even if you consider the main railway lines between the three largest cities (Stockholm, Göteborg och Malmö). However, traffic flows are increasing, and can be expected to increase even more rapidly in the future due to environmental concerns and pressure to reduce CO2 emissions.
Noise from train, road and air traffic causes annoyance and reactions of different kinds (Öhrström 2004). Among the most common health effects are speech disturbance, sleep disturbance and effects on rest and relaxation. Traffic
noise can also cause psychological and physiological stress related symptom and for that reason affects the overall wellbeing.
The parliament of Sweden have in the infrastructure proposal (1996/97:53, TU7) established guidelines for traffic noise. The equivalent noise level indoors for a 24 hour period shall not exceed LAeq, 24h 30 dB and the maximum noise level
shall not exceed LAFmax, 2206 h 45 dB. The equivalent noise level outdoors shall not
exceed LAeq, 24h 55 dB (free field) and the maximum noise level in the outdoor
environment close to the residence shall not exceed LAFmax 70 dB (free field).
Noise from railway traffic has a “bonus” of 5 dB in the outdoor environment close to the residence. The equivalent noise level is then allowed to reach
LAeq,24h 60 dB. There is approximately a half million people exposed to noise levels from railway traffic that exceed the long term goal of the infrastructure proposal, LAeq, 24 h 55 dB. This paper describes the connection between train traffic intensity, noise levels and annoyance determined in questionnaire surveys.
2 Difference in traffic intensity
Within the research program TVANE (Train Vibration and Noise Exposure) [1, 2] part of the focus has been on residents close to railway lines that are affected by the increased traffic volumes. In the municipality Sollentuna outside Stockholm the current traffic is close to 500 train passages per day, which is the most intense railway traffic in Sweden. In Fig. 1 the current train traffic is shown as the number of train passages per hour in a histogram. The four tracks in Sollentuna have different kinds of passenger traffic. There are commuter trains (see Fig. 2), inter city trains and high speed trains traveling on domestic lines at shorter or longer distances up to approximately 1000 kilometres. Speeds vary from 200 km/h for the high speed trains and down to 160 km/h, but commuter traffic that stop in the area decelerate and accelerate so speeds can be lower. Freight traffic moves at approximately 90 km/h.The traffic situation in Töreboda and Falköping is similar regarding train speeds but the overall traffic is a lot lower, se Fig. 1. The total traffic during the day and the evening (0622) is approximately a factor 7 lower than the traffic in Sollentuna, but with a larger proportion of freight traffic at night time. In both areas there are two parallel tracks, not four as in Sollentuna.
0 2 4 6 8 10 12 14 16 18 20 22 24 26 28 30 32 34 36 38 6-7 7-8 8-9 9-10 10-11 11-12 12-13 13-14 14-15 15-16 16-17 17-18 18-19 19-20 20-21 21-22 Interval (hour) T ra in ( n u m b e r)
Sollentuna total number of train/hour Falköping total number of train/hour Törboda total number of train/hour
Fig. 2. A modern commuter train X60 is departing from a station in Sollentuna.
3 Calculated railway noise exposure
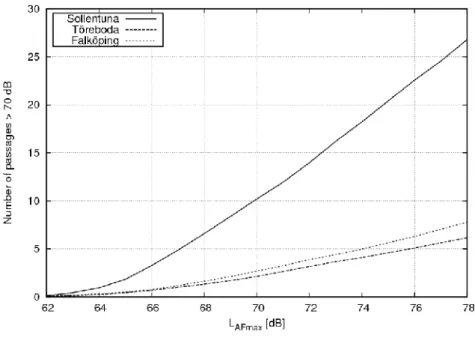
Theoretical calculations using the Nordic prediction method for railway noise [3] and measurements of noise exposure have been used to estimate the effect on how many times per hour different noise events occur. The diagram in Fig. 3 shows the predicted number of trains that exceed 70 dB maximum level for the different areas. This partly explains the different annoyance response with the same maximum level but different traffic intensities, since more noisy events can be expected per hour where the traffic is high (Sollentuna).Fig. 3. Predicted number of train passages exceeding 70 dB maximum level during the peak hour as a function of the calculated maximum level LAFmax.
4 Results from questionnaires
A questionnaire was sent to inhabitants in Sollentuna, Töreboda and Falköping, and about half of the subjects answered the questionnaire. The age of the participants ranged from 18 – 75 years. There were 50 main questions in five parts. The different parts in the questionnaire considered living environment, disturbance from different kinds of traffic, common questions and also possibility to write comments.
Data from the questionnaires and noise calculations from Sollentuna is compared to data from two other areas, Töreboda, Falköping in Fig. 4. In these areas the traffic intensity is around 125 passages per day, and they are all located along a major railway line. The annoyance is higher in the high traffic area Sollentuna as compared to Falköping and Töreboda at the same equivalent level, see Fig. 4.
The results from the questionnaires show that 13 % of the inhabitants in Sollentuna are annoyed of railway traffic with an outdoor noise level of LAeq, 24h 46
50 dB. This is 5 % more annoyed inhabitants compared to the answers from Töreboda and Falköping. In areas with an outdoor noise level of LAeq, 24h 5660 dB
from railway traffic there are up to 49 % annoyed in Sollentuna. This is 31 % more annoyed inhabitants compared to the answers from Töreboda and Falköping.
In areas with higher outdoor noise levels from train traffic, LAeq, 24h 6165 dB the difference between annoyed in Sollentuna and Törboda, Falköping decrease with 16 %. This probably depends on that the noise levels from the railway traffic are so high that a more intensive traffic no longer increases the annoyance. 0 10 20 30 40 50 60 70 45-50 50-55 55-60 60-65 LAEq,24h [dB] P er ce n ta g e an n o ye d Töreboda, Falköping Sollentuna Fig. 4. Percentage of annoyed respondents in 5 dB intervals of the equivalent noise level.
Speech disturbance and annoyance of radio and television program are extensive when the noise levels are over LAeq, 24h 55 dB. More annoyance occur in
Sollentuna at rest, relaxation and sleep compared to Töreboda and Falköping. Inhabitants in Sollentuna with outdoor noise levels Lnight 5559 dB reported
sleep disturbance. At corresponding levels in Törboda and Falköping 12 % of the inhabitants reported sleep disturbance.
The place were the balcony / patio is situated have large importance when it comes to the disturbance. Type of building or windows and when the building was constructed does not show any significant difference.
The answers in the questionnaire from Sollentuna and Töreboda, Falköping show that is not only the equivalent noise level which affects the number of disturbed. It is also the number of trains / 24 hours which have large influence on the disturbance. At day time 0622 an average of 27 trains / hour pass by in Sollentuna. That corresponds to 7 times more railway traffic than in Töreboda and Falköping. One way of summarizing the results is to conclude that intense railway traffic behaves more like road traffic, which gives higher annoyance than “ordinary” railway traffic, but this is overly simplified. Many other factors such as sleep disturbance, speech interference and so on should be included if such a conclusion should me made in future research.

![Fig. 2. A modern commuter train X60 is departing from a station in Sollentuna. 3 Calculated railway noise exposure Theoretical calculations using the Nordic prediction method for railway noise [3] and measurements of noise exposure have been used to estim](https://thumb-eu.123doks.com/thumbv2/5dokorg/4829303.130275/4.892.200.712.227.576/commuter-departing-sollentuna-calculated-theoretical-calculations-prediction-measurements.webp)