JIBS Disser
tation Series No
. 024
OLOF EJERMO
Perspectives on Regional
and Industrial Dynamics
of Innovation
Perspectiv
es on Regional and Industrial Dynamics of Inno
vation
ISSN 1403-0470 ISBN 91-89164-53-9
OLOF EJERMO
Perspectives on Regional and
Industrial Dynamics of Innovation
JIBS Dissertation Series
No. 024
OLOF EJERMO
This thesis consists of fi ve essays in the fi eld of innovation economics, with an introductory chapter. The focus is mainly empirical with four of the fi ve chapters consisting of studies of aspects of Swedish innovation activity. These empirical chapters are an endeavor to quantify aspects of the effects of the public-good property of knowledge. To this effect, innovation indicators were collected regar-ding industrial and fi rm research and development (R&D); regional indicators were collected using business and university R&D and records of patent app-lications and granted patents assigned to Swedish regions using the residential location of inventors.
The fi rst essay studies the productive effect (total factor productivity) of R&D on Swedish fi rms and the effect that R&D can be expected to have on other fi rms. The second essay analyzes, with corporate groups as the unit of obser-vation, the effect of accessibility to R&D in universities, and in other groups’ R&D on the innovative capability of the individual group. The third essay tries to characterize the extent to which Swedish regions are specialized or diverse. This is summarized in a single variable which is used to test the effect on inno-vative activity as measured by the number of patent applications. The fourth essay, the theoretical study of the thesis, constructs a two-region model with two fi rms residing in each. The incentives for doing process R&D are worked out by agglomerating consumers in one of the regions, and by changing interregional accessibility. The fi fth essay studies Swedish inventor networks and regional af-fi nity based on networks.
JIBS Disser
tation Series No
. 024
OLOF EJERMO
Perspectives on Regional
and Industrial Dynamics
of Innovation
Perspectiv
es on Regional and Industrial Dynamics of Inno
vation
ISSN 1403-0470 ISBN 91-89164-53-9
OLOF EJERMO
Perspectives on Regional and
Industrial Dynamics of Innovation
JIBS Dissertation Series
No. 024
This thesis consists of fi ve essays in the fi eld of innovation economics, with an introductory chapter. The focus is mainly empirical with four of the fi ve chapters consisting of studies of aspects of Swedish innovation activity. These empirical chapters are an endeavor to quantify aspects of the effects of the public-good property of knowledge. To this effect, innovation indicators were collected regar-ding industrial and fi rm research and development (R&D); regional indicators were collected using business and university R&D and records of patent app-lications and granted patents assigned to Swedish regions using the residential location of inventors.
The fi rst essay studies the productive effect (total factor productivity) of R&D on Swedish fi rms and the effect that R&D can be expected to have on other fi rms. The second essay analyzes, with corporate groups as the unit of obser-vation, the effect of accessibility to R&D in universities, and in other groups’ R&D on the innovative capability of the individual group. The third essay tries to characterize the extent to which Swedish regions are specialized or diverse. This is summarized in a single variable which is used to test the effect on inno-vative activity as measured by the number of patent applications. The fourth essay, the theoretical study of the thesis, constructs a two-region model with two fi rms residing in each. The incentives for doing process R&D are worked out by agglomerating consumers in one of the regions, and by changing interregional accessibility. The fi fth essay studies Swedish inventor networks and regional af-fi nity based on networks.
OLOF EJERMO
Perspectives on Regional
and Industrial Dynamics
Jönköping International Business School P.O. Box 1026 SE-551 11 Jönköping Tel.: +46 36 15 77 00 E-mail: info@jibs.hj.se www.jibs.se
Perspectives on Regional and Industrial Dynamics of Innovation
JIBS Dissertation Series No. 024
© 2004 Olof Ejermo and Jönköping International Business School Ltd.
ISSN 1403-0470 ISBN 91-89164-53-9
Typeset by Olof Ejermo in Berling using Scientific Workplace Printed by ARKTryckaren AB, 2004
Acknowledgements
During the time of writing this thesis I have had the benefit of studying economics at more than one place. I started out at Lund University’s eco-nomics department where I did most of my Ph. D. course work. Anders Danielson supervised my Master’s Thesis and encouraged my continuing to the Ph.D. level. Andreas Bergh, Richard Bomboma, Mårten Bjellerup and Mirjam Hasth were doctoral students I enjoyed studying together with in this period. My comrades at Blekingska nationen in Lund, Björn John-son, Martin Stankovski, and all others, made the burden of hard studies less painful.
My thesis writing took off at Jönköping International Business School, a completely different place from Lund University. JIBS started only in 1994, Lund University in 1666. The environment at JIBS is one in which many of the staff feel they are genuine entrepreneurs. This is fostered by the sense that ‘anything is possible’ and that decisions are taken to a lesser degree by institutionally set rules than perhaps in Lund. Another differ-ence concerns the different emphasis on research, compared with what I had been used to. Economics in Jönköping, and in particular the head of Department Professor Börje Johansson and Professor Charlie Karlsson, has strong roots in regional economics, a field I had only vague ideas about before coming here. This cultural shock left important marks in my thesis. When I came to Jönköping I was convinced that I would write a thesis in the fashionable field of growth economics, a more aggregate way of think-ing about economic development than what has now manifested itself in this thesis. The growth aspect is nonetheless closely related to the term innovation, but the thesis covers aspects of regional economics as well that can only be explained by the local "milieu" in Jönköping.
A further impetus in the direction of Innovation Economics can be as-cribed my visit at the Centre for Research on Innovation and Internation-alization (CESPRI) at Bocconi University in Milan. The staff at the center was very encouraging and supportive. I especially thank the Director of the Centre and Professor Franco Malerba, Stefano Breschi, Francesco Lissoni, Fabio Montobbio, and Lorenzo Cassi. Financial support from the Swedish Foundation for International Cooperation Research and Higher Education (STINT) that made this visit possible is gratefully acknowledged as well. Most of the work on the thesis has been done in Jönköping, however. The internal seminar series was most often chaired by Professor Bo Södersten.
I thank Professor Södersten for his ability to point out where arguments were not clearly spelled out and in need of clarification. I am highly in-debted to all my colleagues at the Economics Department in Jönköping, who at different stages have contributed to the thesis. Professor Börje Jo-hansson (coauthor of Chapter 5 of the thesis), and my main supervisor Professor Charlie Karlsson (coauthor of Chapter 6) have given invaluable help in this process. Associate Professor Roger Svensson at the Research Institute of Industrial Economics in Stockholm gave detailed advice and helped to improve the quality of the thesis on points. Professor Åke E. Andersson also read an earlier draft of the whole thesis and gave valu-able comments. My co-supervisor, Professor Ghazi Shukur, was helpful in giving statistical assistance. At the later stages I also benefited from the statistical expertise of Thomas Holgersson. I am grateful for the inspiring teamwork I had with Martin Andersson, coauthor of the 3rd Chapter of the thesis. Towards the end Lars-Olof Nilsson provided careful proofread-ing of my written English.
I thank my family for their support. My mother deserves thanks for teaching me at a young age that nothing is gained without hard work. Börje Johansson calls this property of mine stubborness, or with his inimitable West Swedish accent: ‘envetenhet’. Nonetheless, I think persistence is a necessary characteristic for finishing a thesis. Månsson, our cat, deserves gratitude for his persistence in trying to contribute to the thesis: "zzzzzzzz xxcbnnnnnnnnnn „,...". But above all, I thank my beloved Susanna for her unconditional support and understanding of the irregular working hours required.
Jönköping, November 2, 2004
Contents
Chapter 1. Introduction and Summary of the Thesis 1
1. Introduction 1
2. Spatial product life cycles and specialization/diversity 9
3. The measurement of innovation 11
4. Outline of the studies and main results 12
Chapter 2. Productivity Spillovers of R&D in Sweden 17
1. Introduction 17
2. The model 22
3. Indirect R&D and weighing matrices 24
4. Data material 26
5. Estimations 29
6. Conclusions 39
Chapter 3. How Does Accessibility to Knowledge Sources Affect the Innovativeness of Corporations? - Evidence from
Sweden 41
1. Introduction 41
2. Space in knowledge flow models 45
3. Data description and computation of variables 50
4. Empirical analysis 54
5. Conclusions 59
Appendix A. Details on the construction of accessibility variables 61 Appendix B. Results of the Negative Binomial and the
Zero-Inflated Negative Binomial models 64
Appendix C. Prediction graphs of the presented models 65 Chapter 4. Technological Diversity and Jacobs’s Externality
Hypothesis Revisited 67
1. Introduction 67
2. Theories about agglomeration 68
3. Empirical evidence 71
4. The use of patents for measuring diversity 76
5. Diversity in Swedish regions 82
6. Conclusions and extensions 90
Appendix A. Similarity of technological fields 92
Appendix C. Regions ranked by population and patents per capita 96 Chapter 5. Process Innovations in a Duopoly with Two Regions 97
1. Introduction 97
2. The baseline model 99
3. Process innovations and interregional accessibility 104
4. Process innovations and population agglomeration 110
5. Discussion 114
Appendix A. Process R&D: permissible values in ( ; kH)-space 116
Chapter 6. Spatial Inventor Networks as Studied by Patent
Coinventorship 121
1. Introduction 121
2. Network Theory 124
3. Previous findings 131
4. Characterization of the Swedish coinventorship structure 132
5. Model outline 139
6. Summary and conclusions 152
Appendix A. Estimation results by technology, without
population 154
Appendix B. Estimation results by technology, without population
and without headquarters 160
CHAPTER 1
Introduction and Summary of the Thesis
1. Introduction
This thesis consists of four empirical studies and one theoretical investiga-tion in the field of innovainvestiga-tion economics.
It is generally acknowledged among economists that the "growth mir-acle" of modern economies would not have been possible without higher productivity of the classical production factors labor and capital. Such improvements, it is further recognized, occur mainly through increased knowledge and/or better technology and are the main foundations for the "new" endogenous growth theory. Innovation economics is mainly con-cerned with the technology side of the growth process and more often than not tries to address its research questions through microeconomically founded investigations. Innovation economics studies may therefore iden-tify mechanisms and yield insights into factors that are ultimately believed to influence economic growth. Such identification is important, since if the "production function" of nations is subject to nation-specific techno-logical constraints, their output per capita will differ due to technotechno-logical differences. Moreover, their growth rates will reflect each country’s tech-nological development.
Following Schumpeter (1950), an innovation is often defined as the commercial application of an invention. An alternative view takes the stance that an innovation should make use of new knowledge (e.g. Au-dretsch et al. 2002).1 This may, in addition to new products, encompass the application of new processes or organizational modes (Schumpeter, 1934), also referred to as new and innovative changes of a firm’s routines (Nelson and Winter, 1982).
The fundamental asset that innovation builds upon is new knowledge, or new combinations of knowledge. Therefore it should be useful to dwell for a moment on the special importance of knowledge in economic think-ing. In Geroski’s (1995, p. 76) words "Knowledge is probably the clas-sic example of a public good" and it seems clear that this must at least partially be true. A public good is characterized by rivalry and non-excludability. It is non-rival if it can be used by many actors. Knowledge
1This shows that the distinction made above between knowledge and technology is
does not get depleted after it has been "used" and can in this sense be re-used by new actors; hence it is inexhaustible. It exhibits non-excludability if it is not possible to exclude others from using it. In principle, any piece of knowledge may be acquired by anybody else. However, active protec-tion and instituprotec-tional arrangements can exclude others from both acquiring and using specific knowledge items. What gives knowledge additional im-portance is that in practice it is not always public. There are limits to what and how much knowledge an individual can acquire, even though skills to do so may be enhanced and improved.
In practice there are two sides to the coin of diffusion of new knowl-edge which may be called the appropriability dimension (cf. Arrow, 1962b) and the spillover dimension, respectively. In modern society, firms and other economic agents go to great lengths to obtain knowledge from others and make efforts to protect their own knowledge of strategic importance. This is stressed by Cohen and Levinthal (1989, 1990) and confirmed in their empirical studies. In their discussion R&D takes on the dual role of developer of new knowledge as well as enhancer of absorptive
capac-ity. For instance, there is ample proof that firms try to obtain knowledge
from others through e.g. reverse engineering, but the capacity to do this is facilitated by R&D investments. On the other hand firms may protect knowledge by having staff members sign confidentiality agreements to pre-vent them from disclosing the knowledge that they have obtained should they leave their workplace. It may be argued that in the development of institutions regulating knowledge in modern society there is an om-nipresent tension between the demand for "free information" at low cost from the general public and the necessity to reward originators of creative ideas. Ideas, which may eventually find their way to inventions, artwork or otherwise, need to be protected to reward the originators with at least some of the fruits of their efforts, and to maintain incentives for contin-uous efforts to produce new knowledge. This tension can be seen most clearly in the patent instrument. A patent gives the assignee a monopoly on a specified unique piece of technical knowledge, which is limited to a specified time period and geographical area. At the same time, patent doc-umentation contributes to the public diffusion of the technical knowledge embedded in it (Stephan, 1996). There are costs and benefits associated with patenting, of course. Apart from pecuniary issues, the aspiring paten-tee must consider the publicness – secrecy dimension in this decision. An important institutional development seems to be that over time knowl-edge production has increasingly become regulated and found its ways to markets, such as markets for education, intellectual property rights, etc.
When does in fact knowledge diffuse in ways that are not necessarily built into markets? A useful distinction can be made between knowledge and information. When knowledge becomes codified it obtains properties of information that may be largely distant invariant (e.g. as in e-mails).
Chapter 1. Introduction and Summary of the Thesis
Knowledge that is codified becomes more public, because it can more eas-ily diffuse. Despite this, there is no guarantee that the receiver of the information can decode it and understand it. Decoding requires that the decoder has a set of capabilities that are based on earlier obtained knowl-edge and/or technical equipment. For knowlknowl-edge that is mainly embedded in people the obstacle to diffusion becomes even greater. If such knowl-edge can only with difficulty be transformed into information, it may be considered tacit knowledge (Polanyi, 1966; Dosi, 1988). It is frequently assumed that knowledge of this kind requires face-to-face interaction in or-der to be transferred to other persons. Thus, this type of communication is more distance sensitive than standardized information. It can certainly not be considered as public. Obviously, its transmission can be controlled by the sender and the sender can observe the absorption skills (background knowledge) of the receiver. More specifically, communication becomes effective between people with a common set of previous knowledge.
According to the above discussion, knowledge cannot diffuse without friction, quite contrary to the first assumption that it is public. We may then ask: what are the mechanisms for knowledge diffusion? New tech-nologies generate side effects that change market conditions. Such effects are usually referred to as technological externalities or more commonly spillovers. In the spillover literature the focus is on the possible spread of information about innovations; producers can take advantage of inven-tions made by other producers without paying the full price of developing them. This increases the social benefits of inventions, but as observed by Arrow (1962b) reduces the incentive to innovate.
Spillovers take many forms. One form was called pecuniary external-ities by Scitovsky (1954). Prices tend to be lower due to the embedded values of innovations. The fact that the value of an innovation is often perceived higher by users than the actual market price, contribute to rapid spread. Griliches (1992) used his own research (Griliches, 1957, 1958) about adoption of hybrid corn to exemplify this pricing mechanism. In Griliches’s (1992) terminology, one can divide externality effects into rent
spillovers, identical to pecuniary externalities, and idea spillovers, or knowl-edge spillovers. The idea behind knowlknowl-edge spillovers is that this is
some-thing we get more or less for free. Examples include taking part in fairs, reading magazines, overhearing valuable information at informal occasions, such as in pubs etc.
Turning back to the discussion about innovations, how do they arise? A linear approach to innovation would for example stress the following se-quence: research ! development ! production ! marketing (Kline and Rosenberg, 1986, pp. 285-286). Such a simplistic version of the process has of course not been left unchallenged. In Kline’s (1985) and Kline and Rosenberg’s (1986) chain-linked model, there are feedback mecha-nisms from the distribution and market process to detailed design and
testing and to invention and/or production of an analytical design. Dis-tribution and marketing also has important effects on the potential market size. Typically, the development of a product is done in an interplay be-tween customer and supplier and with close monitoring of its reception on the market. Science can be viewed as the backbone of modern prod-uct development. Kline and Rosenberg (1986) stress that research is only called upon when technical know-how has been exhausted.2 Although such discussions reveal a picture which comes closer to reality, they do not change the fundamental importance of technological change. Economic development in general, and economic growth in particular, has for a long time been thought to be decisively influenced by technological change.
In this respect, Sweden has a long and proud invention tradition. A number of Swedish companies based on engineering ingenuity were founded in the late 19th and early 20th century. One of the great organizational discoveries of the 19th century was the "invention of the method of inven-tion" (Whitehead, 1926), i.e. institutionalized R&D conducted in special departments of corporations. This, originally German, discovery (Mow-ery and Rosenberg, 1998) was also implemented in these new Swedish companies. In many cases, their origin can be traced back to a single in-vention. These companies include AGA, Alfa Laval, Asea (now ABB), Atlas Copco, Electrolux, Ericsson, Nitroglycerin Compagniet (now Dy-namo Nobel), Sandvik, SKF, and Tetra Pak.3 They are listed in Table 1 together with the founding year, the main invention year and employment figures. They are all referred to as multinationals with a substantial part of their employees abroad. Only one of these companies was created after the Second World War, namely Tetra Pak. Thanks to continuous innova-tion in them, many of them exist and prosper to this day, and many of them maintain leading positions in their respective areas. Hence, a large portion of Swedish company R&D is still today done by a few multina-tional companies (Fors, 1994). The combination of a high concentration of economic activity in multinationals and a concentration of R&D to them implies a fairly unique industry structure compared with most other coun-tries. This case shows two important things: 1. the Swedish innovation
system has deep historical roots, and 2. industrial innovation is strongly
oriented towards large companies.
2Similarly, Stephan (1996) reports that development of new technology has had
im-portant feedback mechanisms on the direction of science.
3AstraZeneca (the Swedish part formerly known as Astra, founded in 1913) was
ex-cluded from this list, because its heritage cannot be traced to one invention (its R&D centre started in 1931). However the company has 58,700 employees worldwide (2002) and hosts several of Sweden’s most important R&D facilities. For similar reasons Saab, Scania, and Volvo, among others, were excluded from this list.
Chapter 1. Introduction and Summary of the Thesis T able 1: Swedish multinational comp anies built on a major invention. 4 Company (founding year) Invention (year) No . of employees globally 5 A GA (1909) Aga, a gas stor age system (1906) 9,821 Alfa La val (1883) 6 The continuous (cream) separ ator (1878) 9,125 Asea (1883, 1890) The three-phase electrical system (1879) 139,051 Atlas Copco (1873) Pneumatic hammers (1901) 25,787 Electrolux (1901) V accuum cleaner (1915) 81,971 Ericsson (1876, 1918) A utomatic telephone switchboard (1886) 73,420 Nitroglycerin Compagniet (1865) 7 Dynamite (1867) 4,300 Sandvik (1862) Ingot steel production (1862) 37,388 SKF (1907) The self-aligning ball bearing (1907) 39,739 T etr a P ak (1951) P ackage system for liquid food products (1945) 20,900 4 Sources: F ou nding year from Affärsdata or company webpages . Employee data are from Annual reports . Data on invent ions from webpages and Sedig (2002). 5 All employment data are from 2002 except for A GA, which merged with the Li nde grou p in 1999. Their employment data are from before the merger . 6 Alfa La val is part of the T etr a P ak group since 1991. 7 Nitroglycerin Compagniet tod ay oper ates under the name Dyno Nobel with its headquar ters in Norw ay . 5
The inventor tradition extends well into the present. Sweden has for a long time been ranked as one of the most research-intensive countries in the world, measured by formal indicators such as R&D, patents and scientific publications per capita (OECD, 2003; Rosenberg and Hagén, 2003).
From the policy-maker’s point of view these are desirable character-istics. Therefore it may seem somewhat puzzling that they have not re-sulted in higher aggregate economic growth in Sweden in the past decades. It could be conjectured that the reasons should be sought in the indus-try structure: Although the large concentration of R&D in multinationals brings ’new technology to the world’, the small size of the Swedish econ-omy gives little scope for diffusion of new knowledge domestically. This thesis therefore offers some new Perspectives on Regional and Industrial
Dy-namics of Innovation with the ambition to further illuminate and clarify
aspects of knowledge production, knowledge flows, and the process of in-novation.
Returning to the question about the importance of technology (or more broadly, knowledge) in a country’s production function, differing technology/knowledge stocks of countries are highly influential on their economic growth performance. The diffusion of knowledge about prod-ucts, production methods, and organizational routines, is therefore a cen-tral aspect of this process. As was discussed above, knowledge has public good properties. Four of the five investigations carried out in this thesis ask: how, and along what channels, does new knowledge diffuse? These empirical chapters (2, 3, 4 and 6) try to estimate the magnitude and im-portance of various sources of new knowledge. In the economics literature, there are several partially overlapping types of models that try to explain such processes.8Four such perspectives are the study of 1. diffusion,
adop-tion and imitaadop-tion of innovaadop-tions, 2. spillovers (or externalities) of
innova-tions, 3. product life cycles, and 4. innovation networks. Only the first type of analysis is not explicitly used in the thesis. Also, the fifth chapter of the thesis cannot easily be characterized along these lines. It studies the incentive mechanism for process R&D in a theoretical model, in which in-novation occurs through internal R&D in two firms residing in two regions, competing for customers in both regions.
We now briefly discuss the above-mentioned four types of research traditions. Then we discuss the indicators used for inventions and innova-tions in this thesis along with their alternatives. A short description of the geographic landscape of Swedish patenting follows and this introductory chapter concludes with a brief summary of the chapters to come.
8A well-written discussion, showing the interrelations between the traditions of
Chapter 1. Introduction and Summary of the Thesis
1.1. Diffusion and adoption
The first attempts to examine how innovations diffuse can be found in studies of the use of new products, i.e. their adoption processes. In this tradition, the focus is on the end users, be they consumers or producers. Hägerstrand’s (1953) seminal Ph.D. thesis is a highly influential study in this vein. He studied how different innovations were adopted in a small rural area in Sweden from 1908 to 48. These were a set of agricultural technology indicators9and a set of general indicators: the postal giro, auto-mobiles and telephones. Hägerstrand’s main contribution was the recogni-tion that transmission of knowledge about new technologies was facilitated by word-of-mouth processes, that is, neighbor contacts were instrumental in this process, and geographical distance provided an obstacle for diffu-sion.10 Such "infectious" process types are called epidemic models (Geroski, 2000). A stylized property of adoption processes is that they tend to fol-low an S-shaped curve. There tends to be an initial resistance to adoption, followed by a rapid increase in its pace, before a state of satiation finally sets in. In this connection, we should mention Griliches’s (1957) study on the adoption of hybrid corn in American states, where he recognizes that diffusion can be characterized by a logistic curve. He finds that tech-nology diffusion is non-random but occurs where market potential seems important by suppliers.
However, simple epidemic models are deterministic and ’mechanistic’ in the sense that the main obstacle to adoption is a lack of information. Thus, because most humans interact, information will eventually spread. The parameter that these models are gauged against concern the potential number of users. The models lead to the conclusion that the S-shaped curve is symmetric. As reported by Geroski (2000), this occurs largely because these models treat agents (mainly firms or individuals) as identical. Instead, in probit models (Farell, 1954; Tobin, 1955) agents are viewed as heterogeneous. As a new technology diffuses, its usefulness becomes more widely known and the potential number of users increase. Thus, users have different capabilities to assess information, and they also differ to the extent that they find a new technology useful. Therefore these models are able to better replicate the stylized property of the S-shaped curves being asymmetric, because diffusion among the last group of adopters is typically slow.
9a) the cultivated pasture meadows supported by government subsidies, b) the control
of cattle tuberculosis, and c) land mapping.
10Later studies on Swedish adoption processes include Nabseth (1973) on 10 industrial
processes, and Karlsson (1988) on the adoption of information technology. Karlsson also provides an account of diffusion processes and knowledge sources.
For network technologies, information cascades play a fundamental role. A new technology may have competing alternatives, and therefore the indi-vidual may wait until some credible predecessor has adopted it. Informa-tion that the new technology is superior speeds up the adopInforma-tion rate and the number of adopters increases rapidly (the so-called bandwagon effect). This allows suppliers to exploit increasing returns to scale in production.11 However, a new and possibly inferior technology gaining an initial lead in the number of adopters, may dominate the market, simply because the alternative is less well-known.12
Clearly the diffusion process of new products must to some extent occur in an interplay between buyers and suppliers. That is, product de-velopment is simultaneous with diffusion. Imitaton sidesteps the inter-play dimension, and studies of the issue concentrate on diffusion processes among producers. Nonetheless, imitation requires adaption and refine-ment to bring value added to the market. Edwin Mansfield has made pi-oneering contributions in the area of imitation studies. One of his studies includes quantitative estimates of the imitation lag of process and product innovation in 100 American firms (Mansfield, 1985). It was found that "in-formation concerning development decisions is generally in the hands of rivals within about 12 to 18 months...". Another paper (Mansfield, 1988) is an examination into the cost advantages of external relative to internal technology for Japanese firms as compared to American firms. Japanese firms seemed to have a cost advantage in adapting external technologies relative to internal technology development compared with their Ameri-can counterparts. It is possible that this may explain Japan’s inability to take over the role of economic leadership in the early 90s.
1.2. Spillovers of new knowledge
Spillovers have been empirically examined mainly from three perspectives. First, they have been studied as industry spillovers. These studies empha-size that R&D spillovers travel across industries mainly through supplier– customer linkages (rent spillovers), and that these are more likely when there is technological similarity between the industries (cf. Jaffe 1986). The second type studies the localization of knowledge spillovers (LKS). This line of thought is based on the idea that a geographic component can be attached to knowledge spillovers and that geographical proximity matters, i.e. we mainly visit local pubs, fairs etc. In this vein, a num-ber of econometric studies have investigated the localization of knowledge spillovers (LKS), most them finding evidence of such spillovers.
11See Choi (1997) for an appealing formalization of this process.
12This is what Arthur (1989) calls a lock-in effect. For especially pervasive technologies,
whose benefits are adopted for use in other sectors, the term general purpose technologies has been coined (cf. Bresnahan and Trajtenberg, 1995).
Chapter 1. Introduction and Summary of the Thesis
Recently, these conclusions have been challenged by Breschi and Lissoni (2001a,b) who argue that it is wrong to infer LKS simply because of signif-icant econometric results. In particular, signifsignif-icant empirical estimates can be the result of other co-localized factors. Marshall (1920) wrote about
three agglomeration factors affecting the localization of industrial
activi-ties: 1. specialized labor markets, 2. specialized intermediate suppliers, and 3. localized concentration of ideas, usually interpreted as knowledge spillovers. Recent empirical results have especially recognized the role of labor mobility for transferring knowledge (Zucker, Darby and Armstrong, 1998; Zucker, Darby and Brewer, 1998; Almeida and Kogut, 1999; Møen, 2000; Agrawal et al. 2003; Breschi and Lissoni, 2003). These findings un-derline that knowledge spillovers are often facilitated through labor mo-bility. That is, knowledge flows are internalized via the labor market and hence mediated through market mechanisms. Is there then a role left for the idea of knowledge spillovers? If the idea is that knowledge is obtained as "manna from heaven", Geroski (1995) argues that this is fundamen-tally flawed. He maintains that there are several reasons to believe that spillovers do not seriously undermine the incentive to innovate: 1. it is unclear how large spillovers really are, 2. information transmission is not costless, 3. there are rich information flows between producers and users through e.g. formalized collaboration, and 4. some technologies are char-acterized by strong technological opportunities that increase the benefits and success rate of R&D investments. The third type of spillover studies concentrates on the international dimension of spillovers, an area which is not studied in this thesis.
2. Spatial product life cycles and specialization/diversity
Product life cycle theory starts with the observation that most goods go through different phases in the development of their product and produc-tion characteristics.13 There are many variants of how this process is char-acterized in the literature. A stylized version could be as follows. First, there is an initial phase when the product is introduced to the market. This period is usually characterized by high costs of production14, uncer-tainty about the future development of the product, several variants of the product and substantial investment in product R&D. There are usu-ally many producers, trying to realize the new technological opportunities.
13There are also related variants based on notions of industry life cycles.
14Prices may be substantially higher than costs if the producer has a monopoly position.
Note however the important exception concerning introduction of network technologies. Here competitors may make initial losses to attain large market shares. The reason for this is that the utility of the individual user rises if there are other users of the same technology (cf. telephones). Thus, the producer with the largest installed customer base will eventually get a monopoly position.
After some time one or a few variants, often either attain some domi-nating characteristic and/or significant economies of scale in production. Either way, production rises rapidly and the product reaches new markets. This phase is often characterized by a significant shakeout of producers. Economies of scale and marketing efforts become more pronounced and process R&D becomes increasingly important before a stage of maturity is reached. In the final stage, the product is gradually phased out. Important contributions to product life cycle theory include Hirsch (1965, 1967), Vernon (1966), Utterback and Abernathy (1975), Abernathy and Utter-back (1978), Segerstrom et al. (1990), Aghion and Howitt (1992, 1998), Jovanovic and MacDonald (1994), and Klepper (1996).
In spatial versions of the product life cycle model, the importance of market size is stressed. The argument is similar to those above, with em-phasis put also on spatial characteristics. The entry phase usually occurs in regions where the market is dense. Andersson and Johansson (1984a, b) emphasize that consumers in these regions are more alert and responsive to new products. There are also more and better educated workers who are needed to develop the products. In the model by Duranton and Puga (2001) urban regions act as testing grounds for new products. As the prod-uct matures and the prodprod-uction process becomes standardized, prodprod-uction is moved to less central regions, where production costs are low compared with costs in dense regions.
For empirical investigations of spatial product life cycle theory, the reader may consult Norton (1986), Audretsch and Feldman (1996b), and Klepper and Simons (2000). Karlsson (1988), Forslund-Johansson (1997), and Karlsson (1999) are applications to Sweden.
A related body of literature discusses the merits of specialization vs. diversity. These theories try to explain whether regions specializing in cer-tain industries (cf. Marshall, 1920; Arrow, 1962a; Romer, 1986) are bet-ter apt at explaining industrial development, or whether diversity (Jacobs, 1969) is more conducive. Most empirical studies conclude that diversity is favorable. The relation to spatial product life cycle theory becomes ob-vious. If new products mainly emerge in economically dense regions, the two processes can most likely not be separated.
From a network perspective, geographical proximity to critical resources is not a necessary precondition for innovation. If competences can be brought into the organization from geographical distance, it is possible that they are of higher value, and therefore more enduring. Companies with "nodes" at strategic locations are better equipped to find these compe-tences. Innovation networks include suppliers and customers, universities and firms, firm to firm relationships etc.
Chapter 1. Introduction and Summary of the Thesis
3. The measurement of innovation
According to arguments put forward earlier in this introduction, innova-tion processes cannot properly be described as linear. In this context we may observe the uncertainty involved in the process of new knowledge creation. There are many ways for knowledge to be created, and turned into innovations. Hence, any innovation indicator and innovation activ-ity variable is likely to be biased. Kleinknecht et al. (2002) provide an overview of the pros and cons of different innovation indicators. This sec-tion mainly summarizes their discussion. The indicators discussed are: 1. research and development (R&D), 2. patent applications and granted patents, 3. innovation expenditures, 4. sales of innovative products and associated imitations and 5. new product announcements. The first two of these are ’traditional’ indicators, in the sense that they have been used by economists as innovation indicators for the longest time.
R&D data has have been collected since the 1950s. Data are harmo-nized throughout the OECD countries. Data measure inputs to the inno-vation process. However, other inputs are not included, such as learning investments in the firm (e.g. on-the-job training or upgrading of skills). As such, the indicator tends to be biased towards showing larger firms to be more innovative. R&D is in large corporations often placed in special departments, which makes it easier for those companies to provide rea-sonably accurate information to the statistical offices. Smaller firms tend to underreport R&D for this lack of precise definition in their own orga-nization. OECD standardization efforts have provided detailed definitions of R&D, making it difficult for firms to quickly understand what informa-tion the statistical agencies require, which leads to addiinforma-tional bias in favour of large firms. Also, service sectors tend to be underrepresented because service development is harder to classify as R&D.
Patent records exist from the 18th century. Thus, there are long time series available. Data are very rich on information such as assignee (usually company) and inventor(s) names and their addresses and the technology area of the patent. On the other hand, patenting only occurs where this is seen as profitable, which implies that many inventions are not patented. Furthermore, patents are not always viewed as effective, in comparison with knowledge protection and secrecy, as well as strategies to remain ahead of competitors by moving faster along the learning curve (Arun-del, 2001). In addition, there are differences between industries in the propensity to patent (Scherer, 1983), depending on the relative cost of im-itating to that of innovating, technological opportunity, etc. Again there is a bias of patenting towards larger firms, mainly due to high threshold costs. There is no guarantee that patenting actually leads to innovation despite its investment costs. Firms sometimes do strategic patenting to prevent others from entering the market, and therefore there is "noise" in the actual data.
More recent collection efforts of innovation data are made through the Community Innovation Surveys (CIS) of the European Union. These provide data about innovation expenditures, and reflect a broader set of characteristics than R&D. However, the downside to this flexibility is the difficulty for respondents to answer what innovation expenditures exactly constitute.
Another set of data from CIS concerns sales of imitative and innova-tive products. The answers reflect whether the product portfolio of the responding firms has remained essentially unchanged, or whether there has been incremental change or radical change in the product range. The firms also respond to questions about whether products are new to the firm or new to the market. Subsequently they estimate the relative share of these categories in their total sales. However, firms sometimes have to make rough estimations, the average life of products varies, and it is unclear what firms perceive as the relevant ’market’.
New product announcements can be found in trade journals. This dicator has the advantage of not limiting the sample to manufacturing in-dustries, and of also covering small firms. Inventing companies’ addresses may be obtained with high precision. Also this indicator has its disadvan-tages. It is dependent on the selected journals and their numbers; samples are not selected on the basis of statistical criteria, and process innovations are not likely to be covered. It is not clear what defines a product with this method and what the required minimum value of a product must be.
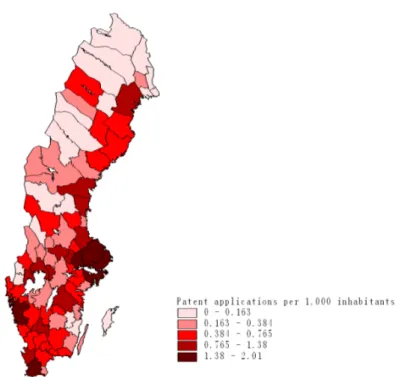
Which of the indicators listed above were chosen and what were the criteria used in this thesis? Primarily, the availability of data limited the menu of choices. R&D data was available biennially for the 1990s (1991, 1993, 1995, 1997 and 1999) for industries and 81 functional regions.15 Patent data were obtained from the European Patent Office (EPO). A ma-jor effort was made to allocate the patent data to the 81 functional regions, using the address field of inventors in the database. Figure 1 shows the ge-ographical distribution of Swedish patenting to the EPO for the period 1993-1999.
4. Outline of the studies and main results
The second chapter of the thesis, Productivity Spillovers of R&D in Swedish
Industries and Firms, analyzes if spillovers of R&D across industries can be
verified. The chapter uses input–output matrices, as well as technological similarity indices to weigh the relative importance of different potential contributors. R&D affects the (own) Total Factor Productivitiy of a firm. The effects are of a similar size to those reported earlier in the literature.
15Regional classification of Swedish R&D was introduced in 1995, using the county
level. A great deal of manual work was needed to allocate data to functional regions (local labor market regions).
Chapter 1. Introduction and Summary of the Thesis
Figure 1: The geographic distribution of patent applications per 1 000 inhabitants to the EPO for Swedish regions 1993-1999. Source: Andersson and Ejermo (2004b).
With regard to spillovers to other industries, a division is made between effects on R&D performers and non-R&D performers. Only modest in-terindustry spillovers could be found using the input–output measures, and no spillovers across industries were found using the technological similar-ity weighing matrix on R&D performing firms. For non-R&D performers, a consistently and statistically significant spillover effect was found, but smaller in size. It is hypothesized that the lack of spillovers between the R&D performers has to do with the high concentration of R&D among a few innovators engaged in multinational activities. It may be the case that their sources of information are mainly international, rather than domes-tic, since they engage mainly in non-overlapping branch-specific activities. Among non-R&D performers the reason for the small estimated size of spillovers could be that there is a lack of absorptive capacity and/or that the spillovers that can actually be obtained are of less relevance for their activities where the domestic market plays a more prominent role.
In Chapter 3, How does Accessibility to Knowledge Handlers Affect the
In-novativeness of Corporations? - Evidence from Sweden (coauthor Martin
An-dersson), we examine the effects of localized knowledge flows (whether
spillovers or planned knowledge transfers) on patenting in Swedish cor-porate groups. Groups are companies tied together by parent-subsidiary affiliations. In this way we are able to assess the relative contributions to groups, as measured by patenting, of accessibility to own group R&D, other group R&D, and university research. These factors are decomposed into intraregional and interregional subgroups. Accessibility denotes that sources are time–distance weighted. We find that accessibility to intra-group R&D is not significant. We interpret this in the way that knowledge flows relatively freely within the corporation and is not hindered in any significant manner by lack of accessibility. We find that it is beneficial for corporations to locate in the same region as university R&D, suggesting that some transfer mechanism of new knowledge from university research exists, but that university effects are spatially bounded. However, there were no significant effects found from locating in the same region as other groups’ R&D, roughly consistent with the results of Chapter 2.
The fourth chapter, Technological Diversity and Jacobs’s Externality
Hy-pothesis Revisited, tests a version of Jacobs’s hyHy-pothesis that regional
diver-sity is most beneficial for regional development. This is contrasted by ar-guments based on Marshallian externalities suggesting that specialization is what matters. The chapter criticizes many elements of the literature, including the appropriate variable against which to gauge the diversity hy-pothesis. It is argued that an innovation indicator is a better way to ex-amine Jacobs’s hypothesis than industrial composition. In particular, the conventional ways to measure diversity are criticized. The paper argues that when measuring diversity the degree of relatedness of regional activ-ities should be taken into account. Such a measure is devised based on previous contributors and adapted for regional use. The measure is cal-culated for Swedish regions and the effects of diversity are tested on new innovations, as indicated by patent applications. Contrary to much of the empirical literature, the paper finds evidence against Jacobs’s hypothesis, and the result therefore favors Marshallian arguments. The chapter raises questions about the appropriate size of regions and the potential need for taking into consideration the diversity range of individual firms.
Chapter 5, Process Innovations in a Duopoly with Two Regions (coauthor Börje Johansson) is the only purely theoretical contribution of the thesis. We model two firms, where one supplies a low-quality and the other a high-quality variant of a good. They reside in separate regions and try to break into each other’s market through cost advantages obtained by process innovations. The change of the incentive to conduct process R&D is examined by changing two parameters: 1. the regions come closer to each other in the sense that transportation costs are reduced, and 2. there is movement of people from the region producing the low-quality version to the region producing the high-quality version of the good. We find in the first case that a reduction of transportation costs raises the incentive to
Chapter 1. Introduction and Summary of the Thesis
conduct process R&D for the low-quality good relative to that of the high-quality good. In the second case, movement of people to the high-high-quality region lowers the incentive for process R&D in the low-quality region, while it is augmented in the high-quality region.
In the sixth chapter of the thesis, Spatial Inventor Networks as
Stud-ied by Patent Coinventorship (coauthor Charlie Karlsson), we focus on the
geographical distribution of inventors working together on patents. The idea is that knowledge transfers occur mainly through established channels, networks, and the geographical distribution of inventors working together on patents provides a possibility to study how regions are interconnected in inventor networks. The idea is exemplified by a study of Swedish func-tional regions. Innovativeness in smaller regions is to a high degree de-pendent on their connections with larger ones. Although inventors of a patent in general tend to live in the vicinity of each other, larger regions have more geographically distant connections, so that the cooperation is less distance sensitive, and larger regions generally tend to have more in-ventors per patent. We also conduct the analysis on 30 different patent technologies and find that information technology displays the least sen-sitivity to distance, consistent with predictions of the "death of distance". Certain technologies respond positively to the location of university re-search, while others do not. If knowledge transfer is more important than knowledge spillovers in "the knowledge economy" as we believe, policy measures should therefore take into consideration the geographical extent of established networks to assess their effects.
What general conclusions can be extracted from these results? With regard to the "spillover" dimension, the results in Chapters 2 and 3 find only modest size estimates, if at all present in the data. Given the meth-ods used here, it seems as if domestic spillovers are small. A possibil-ity is therefore that mechanisms to diffuse knowledge from corporations, without undermining their competitive strength and possibly having ap-plications elsewhere may improve domestic spillovers and hence economic growth. With regard to specialization/diversity, it is a noticeable finding that specialization seems more important, at least for Swedish regions, when we take into account the degree of relatedness of technologies in re-gions. Chapter 4 also uses a new methodology to establish this point. The fifth chapter brings the insight that innovation may be related to market size and distance to other markets, i.e. accessibility to customers matters. Chapter 6 reveals that invention networks may consist of nodes, which may by themselves be sensitive to distance, but that economic conditions in Swedish regions seem to be more important for these nodes than dis-tance itself. This example also shows that networks are real phenomena that may be empirically studied in economic settings.
CHAPTER 2
Productivity Spillovers of R&D in Sweden
1Olof Ejermo
ABSTRACT. Although Sweden is one of the most R&D-intensive OECD countries, the importance of R&D spillovers in the country has not been systematically analyzed. This paper employs a cross-sectional dataset of 264 R&D-performing Swedish firms in 1996-97. With this set, knowl-edge production functions are estimated, in which industry groups are treated as subsamples. In addition, 160,614 non-R&D performing firms are used to examine the effects of R&D spillovers also among non-R&D performers.
The estimations use three different weight methods for R&D that spills over from other industries: two input—output measures and a technology flow matrix in the spirit of Jaffe (1986). The results indi-cate that R&D performing firms gain in Total Factor Productivity from their own R&D. In two of the three weighing matrices spillovers from R&D result in higher Total Factor Productivity among R&D performers. Among non-R&D performers, the Total Factor Productivity effect of R&D spillovers is robustly positive and significant across specifications. Examination of the social returns to R&D from specific industries, one at a time, to other industries does not reveal substantial social effects beyond the effect on the own firm. It is reasoned that the most likely reason for the small size of R&D spillovers rests in the Swedish corpo-rate structure, with most R&D being conducted by large multinationals.
1. Introduction
Recent policy discussions on the efficacy of the Swedish innovation system have suggested that despite being one of the most R&D intensive of the OECD countries (see OECD 2003) in terms of private and public R&D expenditures per capita and patented technological development, Sweden underperforms in terms of commercially implemented innovations (Gold-farb and Henreksson, 2003, Andersson et al., 2002). Arrow (1962b) de-scribed the appropriability problem of R&D: due to the risk of not being
1This chapter was in an earlier version presented at the conference "The Future of
Innovation Studies" in the Netherlands. I thank Bart Los, Christoph Meister and Bart Verspagen for comments. The paper has also been presented in the internal seminar series at JIBS. I thank all participants for their comments and especially Thomas Holgersson for his statistical advice.
able to appropriate the returns to R&D, firms may from the social plan-ner’s perspective, underinvest in R&D. Hence, economists have for some time tried to evaluate the appropriability problem by estimating the ex-tent to which R&D spillovers exist. This is of course not an easy task, given the many ways technical knowledge is accumulated. Nevertheless, while scepticism is warranted, R&D spillover estimates can give insight into whether Swedish industries tend to be self-sufficient or whether they benefit jointly from each other’s R&D.2The Swedish experience does not seem to illustrate Arrow’s appropriability problem, but quite the opposite. If anything, more R&D than perhaps efficient from a social point of view is conducted. Large volumes of R&D are being conducted with only modest appropriability problems, i.e. R&D does not spill over to any substantial extent.3
The aim of this paper is to examine the extent of R&D spillovers in Sweden. In this endeavour, we use methods previously undertaken, but with an unusually rich set of data. The data consist of 264 R&D perform-ing firms with information on R&D expenditures, capital stocks, labor and other firm characteristics. Also, 160,614 non-R&D performing firms are used to examine the effects of R&D spillovers extend beyond the R&D sector itself. It is also recognized that the results could be sensitive with respect to the matrix used for weighing effects on other industries. Two measures based on input–output (IO) matrices and one in the spirit of Jaffe (1986) are therefore used. As we will see, it turns out that this distinction between on the one hand, IO-matrices and on the other, a Jaffe type of weighing matrix, is important, because R&D spillovers are not significant using the Jaffe weighing matrix for R&D performing firms, but significant R&D spillovers are found with input–output matrices. Spillovers, though smaller in magnitude, are always significant and positive for non-R&D per-formers.
Earlier evidence on Swedish R&D spillovers is rare. One recent excep-tion is Braconier et al. (2001) who investigate internaexcep-tional spillovers of R&D, measured by foreign direct investments, using a database of Swedish multinational enterprises (MNEs) for the years 1980-1994. Their main results are that the only variable affecting total factor productivity is own R&D, and hence there is no sign of international spillovers in their study. Their paper does not estimate interindustry spillovers, however.
The importance of theoretically modeling the process by which tech-nology develops, has been recognized for a long time. Such modelling efforts gained new momentum in the 1980s and early 90s with the addi-tion of the ’new growth theory’ as represented by Romer (1987, 1990),
2Lööf (2001) conducts investigations on the effects of innovations on Swedish firm
productivity using European Community Innovation Survey primary data, but does not examine the effects of R&D spillovers.
3Whether this leads to a socially optimal situation is of course a more demanding
Chapter 2. Productivity Spillovers of R&D in Sweden
Lucas (1988), Rebelo (1991), Grossman and Helpman (1991) and Aghion and Howitt (1992, 1998).4 While convincingly demonstrating the impor-tance of technology in the growth process, advances to empirically quan-tify spillovers have been difficult to achieve. Much of this research has been pioneered by the late Zvi Griliches.
Griliches (1979) introduced the useful distinction between rent and idea (knowledge) spillovers. Rent spillovers (or pecuniary externalities) oc-cur when an invention is sold, directly or embodied in intermediate goods, to other producers, at a price lower than its true user value, since the buyer takes advantage of the knowledge embodied in the good. Idea spillovers on the other hand, refer to situations where producers borrow ideas, with or without the inventor’s consent. While rent spillovers relate to errors in output deflators (cf. Griliches and Mairesse 1984), idea spillovers are not a result of economic transactions in this interpretation.
Attempts to estimate the importance of R&D spillovers between in-dustries (and firms), require a principle for weighing them.5 Although such weighing procedures may seem analytically straightforward and in-tuitively acceptable, they are hard to translate into empirically clear-cut counterparts. In practice, measures can broadly be divided into three classes (cf. van Pottelsberghe 1997). Chronologically, the first type to be used has been based on input–output (IO) tables or capital investment information, where the idea is that industries or firms that use relatively much of a certain kind of input will borrow relatively much of its technol-ogy. Examples from this tradition include Terleckyj (1974, 1980), Wolff and Nadiri (1993), Wolff (1997) and Vuori (1997).
The second class is what van Pottelsberghe (1997) calls "technology flow estimators". A typical example of this methodology is Scherer’s (1982) classification of 15,112 patents from industries of origin to industries where they were most likely used. Expressed as shares, these patents were used to weigh R&D data by industry. Another of these methods is based on the so-called Yale matrix. Originally used by Putnam and Evenson (1994), this matrix utilizes a principal user-to-producer relationship uniquely provided by the Canadian patent office. This matrix has somewhat uncritically been used for many countries, with the motivation that the underlying eco-nomic conditions behind the relations are universal. Furthermore, it has been argued that since patents reflect commercialized attempts to protect knowledge, there will probably be a markup cost, thus giving estimates that will partly reflect rent spillovers (van Meijl 1995, 1997, Verspagen 1997b).
4This literature has been surveyed by, among others, Aghion and Howitt (1998). 5This section is by no means a complete survey of the R&D-productivity relationship.
The focus is on elucidation of some of the weighing issues. van Pottelsberghe (1997) offers an excellent survey of the relationships. In addition, Mairesse (1991) and Griliches (1995) provide surveys of empirical results.
Nonetheless, using patents as weights is advantageous for at least two rea-sons: millions of patent documents provide ample information about tech-nological relations between patent classes, firms, and inventors. Second, this information about knowledge is left in visible form as a "paper trail". Recognizing this, researchers have increasingly turned to patent citations, and the like, to weigh the estimates. In van Pottelsberghe’s terminology, this is referred to as technological proximity measures, and has been argued to be a better indicator of idea spillovers. Verspagen (1997b) used a classi-fication by Verspagen et al. (1994) that mapped International Patent Clas-sification (IPC) codes of patents into ISIC-2 sectors, where the underlying assumption is that these fit well into the idea of a knowledge-producing sector. Data from the European Patent Office (EPO) are then used in two ways. The first is to use information on claimed knowledge; that is, ci-tations that directly refer to other patents. The second information used is non-appropriable knowledge or additional information. US patent cita-tions provided by the US Patent and Trademark Office (USPTO) are used as a third measure of technological proximity. A fourth matrix is the Yale matrix.
The three classes IO types, technology flow estimators, and technolog-ical proximity do in increasing order resemble idea spillovers. But it is not self-evident which class they fit best, because there is an element of rent and idea spillovers in all of them. Authors have, however, seldom recog-nized these issues and asked themselves what the weights really measure or whether they are applicable to different countries and time periods. Two exceptions are Verspagen (1997b) and van Pottelsberghe (1997).
Verspagen (1997b) compared results using the matrices listed above. It was found that social rates of return to R&D differed little; they were between 10.4 and 15.2 percent. Moreover, there was a correlation be-tween the USPTO and EPO measures ranging from 0.68 to 0.86. The Yale matrix showed the lowest correlation with the others, around 0.5.
van Pottelsberge (1997) compared IO, technology flow and technolog-ical proximity matrices (in total 13 measures) by principal component pro-jection and hierarchical clustering analysis. The results indicate that tech-nological flow estimators are in an intermediate position between input– output and technological proximity estimators, but closer to input–output measures.
Results in the literature point to social returns to R&D from IO and investment measures in a wide range from -44 to +871 percent, with many studies reporting no effect, and many reporting effects between 0 and +60 percent. Technological flow matrices show values from -11 to +314 per-cent. Technological proximity values range from -45 to +74 perper-cent.6 In order of method, as given above, the social returns are in a narrower range.
Chapter 2. Productivity Spillovers of R&D in Sweden
One reason is that there are more studies of the first type, less of the sec-ond and few studies of the third type, but this is probably not the only reason. van Pottelseberghe goes on to estimate the 13 matrices described above, within a homogeneous framework. He finds that the effects, when estimated together with own R&D, are highest with patent-related rent spillovers, followed in sequence by technological proximity and IO-related measures.
For comparisons it is relevant to look at other cross-sectional studies. It appears that such studies are rare in the literature. Verspagen (1997a) contains one approach which includes a cross-section over time. The pa-per uses the EPO matrix to investigate spillovers in a panel data set of 14 countries with 22 sectors and over 19 years (1974-1992). While explicitly aiming at explaining international spillovers, it is relevant as a comparison for this paper, because it explores the two possibilities of using the panel data: BETWEEN and WITHIN estimates, where BETWEEN is essentially a cross-sectional (mean over time) investigation across countries and sec-tors. The WITHIN approach instead uses the time-series dimension of the data. Generally, it is found that domestic spillover estimates are significant, but estimates are both higher in an absolute sense and much more signifi-cant for the WITHIN approach. Verspagen (1997a) thinks that this has to do with different assimilation capabilities across industries. Similar results were also found in Los and Verspagen (2000). Their study utilizes a panel of US manufacturing firms. Spillover effects were estimated by using four different methods: unweighted R&D of other firms, the Yale matrix, the EPO matrix and a matrix based on ’additional information’, including non-claimable public knowledge from EPO. With regard to the cross-sectional dimension, R&D spillovers were non-significant or even negative and sig-nificant. Their result for the cross-section reminded of that in Verspagen (1997a), in the sense that spillover results were all smaller in the cross-section dimension of the data. Time series consistently showed higher estimated elasticities.
This paper is organized as follows. The next section describes the model used as a base for estimations, both with respect to R&D and non-R&D performing firms. Section 3 shows the different types of weighing matrices used for weighing the indirect R&D received from other indus-tries and firms. Section 4 describes the sources of the data material and the industry classification and gives some descriptive explanation. Section 5 presents ordinary least squares (OLS) and heteroskedasticity-corrected estimations. In addition, indirect effects and social effects from R&D in industries are estimated in separate regressions. Section 6 concludes.
2. The model
R&D capital stocks have typically been measured by one of two methods in the literature. The first method, which has been employed in many papers, is to accumulate R&D expenditures over a time period with a fixed depre-ciation rate, typically 15 percent. The second method uses the so-called Terleckyj transformation, shown below (cf. Terleckyj 1974, 1980). In the latter case only one year’s R&D expenditure data are needed. Although, as will be seen, two years’ data are available for some variables, R&D expen-diture data are only available from one year, making it necessary to follow the second approach. There are two types of firms in the material, those that spend money on R&D and those that do not. We therefore consider two Cobb-Douglas production functions. For confidentiality reasons, the full R&D material from Statistics Sweden was not matched with financial variables, so that only a random subset of the firms included in the col-lected R&D statistics was matched. Yet, information was given on R&D expenditures for the total set of firms for different industries.7 Hence, when calculating the indirect R&D effects, the full sample was used. Us-ing sets we can distUs-inguish the different types of firms accordUs-ing to:
I = f1; 2; :::; 687g
I0 I; I0 = f1; 2; :::; 264g J = f1; 2; :::; 160614g
From the set of 687 R&D performing firms, I, we have complete data for a subset I0 of 264 firms. Such a firm is denoted i 2 I 0. A non-R&D
performing firm is denoted by j 2 J.
2.1. R&D performing firms
The direct and indirect effects of firm R&D on firm output can be mod-eled in a Cobb-Douglas setting, of the type initially discussed in Terleckyj (1974, 1980). An R&D performing firm i 2 I 0 is assumed to use the
following production function:
Qit = Ae 1tLit1Kit1Rit1Eit1e"it (2.1)
where Qit is the value added of firm i in period t = 1997, A a constant,
e 1ta time effect, L
it number of employees, Kitthe capital stock, Rit the
firm’s R&D stock, i.e. accumulated R&D over time, and Eit the indirect
stock of R&D from other firms. "itis an error term. Eit will be explained 7To check whether this subset was representative, the first, second and third moments
of the amount of R&D expenditure were tested for equality. The tests indicated that equality could not be rejected.
Chapter 2. Productivity Spillovers of R&D in Sweden
in more detail in the next section. Assuming constant returns to scale with respect to labor and capital 1+ 1 = 1makes it possible to rewrite (2.1)
as8: p = Qit L 1 it K (1 1) it = Ae 1tR 1 itE 1 ite "it (2.2)
In what follows, the calculation of p is straightforward except for 1
which is proxied for by the labor cost of the firm as a share of value added at t 1. Taking natural logarithms and differentiating with respect to time leaves us with the commonly used formulation for the Total Factor Productivity growth rate:
T F P G = p_ p = 1+ 1 _ Rit Rit + 1 _ Eit Eit + it (2.3)
where the transformed error term it = _"it="it is assumed to have zero
mean and constant variance and 1 and 1 are elasticities of the internal
and external R&D stock with respect to TFPG. We cannot estimate (2.3) since data on R&D stocks are not available. However, by reformulating (2.3) as T F P G = 1+ 1 Qit Rit Rit Qit _ Rit Rit + 1 Qit Eit Eit Qit _ Eit Eit + it = 1+ 1 _ Rit Qit + 1 _ Eit Qit + it (2.4) with 1 = 1Qit Rit and 1 = 1 Qit
Eit, Equation (2.4) can be estimated. The
advantage of this formulation is that only the change in R&D stocks is needed (= _Ritand _Eit) which can be proxied for by R&D expenditures in
a single year, with the implicit assumption that R&D does not depreciate (cf. Terleckyj 1974, 1980). Estimated parameters should be interpreted as measuring the excess returns to R&D.
2.2. Non-R&D performing firms
The above setup has to be restated in the case of firms not performing R&D: j 2 J. Assuming an identical Cobb-Douglas function but with different parameters gives the form:
8There are two reasons for assuming constant returns to scale: 1) this makes the
esti-mations comparable with earlier studies, and 2) we only have data on the labour costs, and hence we assume that the remaining part is paid to capital. Following 2), the assumption is necessary in the present model, to make it empirically tractable, and does not mean that this author necessarily agrees with it.