LINA ANDERSSON & MATS HAMMARSTEDT
2012:1
Earnings and occupational
attainment among immigrants
from the new EU member
Earnings and occupational attainment among immigrants from the
new EU member states in Sweden
In 2004, Sweden gave all citizens from the EU’s ten new member states full access to the labour market. In this paper we show that these immigrants from these states are at a small earnings disadvantage compared to natives. This disadvantage is concentrated at the lower end of the earnings distribution. As we move up the earnings distribution, immigrants from the new member states improve their earnings position; at the top of the earnings distribution they have an earnings advantage over natives. Immigrants from the new member states are over-represented in occupations demanding little or no education, but are under-represented in occupations that require a university education. Thus, even if immigrants from the new member states who make it to top occupations do well in terms of earnings, there are obstacles to their attainment of the highest positions on the Swedish labour market.
Contact information
Lina Andersson Linnaeus University
Centre for Labour Market and Discrimination Studies SE-351 95 Växjö
lina.andersson@lnu.se
Mats Hammarstedt Linnaeus University
Centre for Labour Market and Discrimination Studies SE-351 95 Växjö
mats.hammarstedt@lnu.se
1 INTRODUCTION
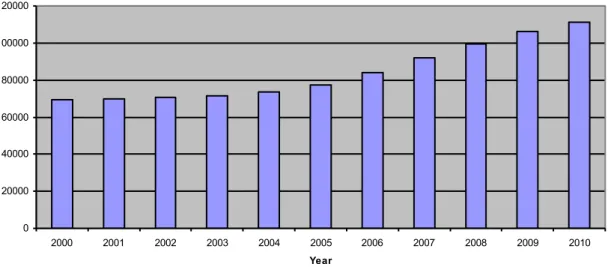
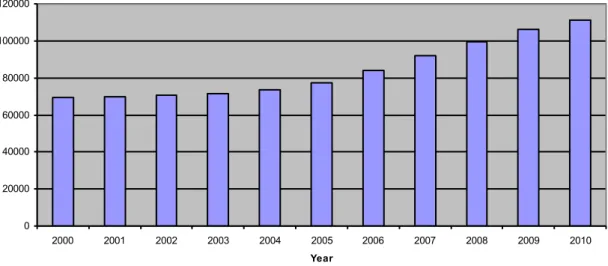
Today the European Union consists of 27 member states. In May 2004, ten new states joined the European Union and two members joined in 2007.1 The United Kingdom, Ireland and Sweden all gave citizens from the new member states full access to the labour market from the date of accession. This resulted in an inflow of immigrants from the new member states into these countries. The flow of immigrants from the new member states into Sweden during the 2000s is highlighted in Figure 1. In 2003, about 70,000 nationals from the ten states that became EU members in 2004 were living in Sweden. By 2007, this figure had risen to more than 92,000 and in 2010 it exceeded 110,000.2 Since Sweden’s total population today is about 9.2 million, of which about 1.3 million are foreign born, immigrants from the new member states make up about 1 per cent of Sweden’s total population and almost 10 per cent of its foreign-born population.3
Relatively little is known about the labour market position of immigrants from the new member states who have relocated to the old member states. Since the European Union is still expanding, it is important to acquire knowledge about the composition of the internal migration in Europe and about the performance of these immigrants on the labour market in their new country. Against this background, this paper focuses on the labour market position among Sweden’s immigrants from states that became members of the European Union in 2004.4 We study earnings and occupational attainment among
immigrants from the new member states in Sweden for the year 2007. In order to study the relative earnings position for these immigrants, we estimate earnings equations using OLS and quantile regressions. Furthermore, we estimate an ordered probit model
1 The ten new member states in 2004 were Cyprus, the Czech Republic, Estonia, Hungary, Latvia,
Lithuania, Malta, Poland, Slovakia and Slovenia. In 2007 Bulgaria and Romania became members of the European Union.
2 The inflow of immigrants from the new member states into the United Kingdom and Ireland was even
larger, see e.g., Blanchflower, Saleheen & Shadforth (2007).
3 See Statistics Sweden (2011).
4 Several studies have documented low earnings and high rates of unemployment among immigrants on
the Swedish labour market. See e.g., Edin, Lalonde & Åslund (2000), le Grand & Szulkin (2002), Nekby (2002), Hammarstedt (2003) and Hammarstedt & Shukur (2006).
Figure 1: Number of individuals born in NMS resident in Sweden in 2000-2010
0 20000 40000 60000 80000 100000 120000 2000 2001 2002 2003 2004 2005 2006 2007 2008 2009 2010 Year
in order to study occupational attainment among immigrants from the new member states.
Our empirical analysis reveals that immigrants from the new member states earn less than natives. However, this earnings disadvantage is concentrated at the lower end of the earnings distribution. As we move up the earnings distribution, immigrants from the new member states improve their position. At the top of the earnings distribution, they have an earnings advantage over natives. However, immigrants from the new member states are over-represented in occupations demanding little or no education but under-represented in occupations demanding a university education. Thus, even if immigrants from the new member states who make it to top occupations do well in terms of earnings, there are still obstacles to immigrants who aspire to reach those top-ranked positions.
The paper is organised as follows. An overview of the literature on the EU enlargement and the labour market position of immigrants from the new member states in different countries is given in Section 2. The data and some descriptive statistics are presented in Section 3; the estimation strategy is presented in Section 4. Section 5 contains the results and Section 6 is devoted to the conclusions.
2. PREVIOUS LITERATURE
Immigrants from the new member states were given full access to the labour market in the United Kingdom, Ireland and Sweden. Most of the previous studies on labour market outcomes among immigrants from the new member states have been conducted in these countries.
In the United Kingdom, Blanchflower, Saleheen and Shadforth (2007) estimated the effect of the migration from eight Eastern European countries on the UK economy. They found evidence that this migration had reduced inflationary pressures and lowered the natural rate of unemployment. Further, Blanchflower, Saleheen and Shadforth found that the immigration from countries in Eastern Europe had not led to higher unemployment in the United Kingdom.
Blanchflower and Lawton (2008) focused on the attitudes among residents in the new member states. They found that a relatively large share of Eastern Europeans was unhappy with the country in which they live and that they had difficulties in finding and keeping a job in their home countries. Further, many also expressed a desire to move abroad. Blanchflower and Lawton concluded that the United Kingdom had benefited economically from the enlargement of the European Union.
Drinkwater, Eade and Garapich (2008) examined labour market outcomes among post-enlargement migrants from the new member states in the United Kingdom. They found that most of these migrants had accepted low-paying jobs, even though some of them, especially from Poland, had university degrees. As a result, recent migrants from Poland were found to have lower returns to their education than other recent immigrants.
Barrett and McCarthy (2007) studied earnings among all immigrants to Ireland and found that recent immigrants from the new member states were at the greatest earnings
disadvantage. Barett and Duffy (2008) concluded that much of this disadvantage was related to low occupational attainment.
More recently, Barrett, McGuiness and O’Brien (2010) studied earnings among immigrants in Ireland who had come from the new member states. They found that these immigrants from were at an earnings disadvantage compared to natives of Ireland. However, this disadvantage was concentrated at the upper tail of the earnings distribution, suggesting that the transferability of human capital was an important determinant of the success of immigrants from the new member states on the Irish labour market.
Gerdes and Wadensjö (2008) found that in Sweden the employment rate was somewhat lower among immigrants from the new member states than among natives. Furthermore, they found that the earnings were slightly lower among immigrants from the new member states than they were among natives.
This paper adds to previous literature on labour market performance among immigrants from EU’s new member states, since we focus on how these immigrants perform across the earnings distribution as well as on their occupational attainment. These results will give a better understanding of whether immigrants from EU’s new member states are able to reach top occupations that demand more years of university education and high earnings or whether they are employed in low-paid occupations for which they are overqualified.
3. DATA AND DESCRIPTIVE STATISTICS
We use data from the register-based longitudinal data base LISA (Longitudinal Integration Database for Health Insurance and Labour Market Studies) developed by Statistics Sweden for 2007. LISA contains information on everyone in Sweden, 16 years and older, his or her demographic characteristics, labour market characteristics, and use of social benefits. We include all foreign-born individuals aged 20-64 who immigrated to Sweden in 2005 or in 2006 and who resided in Sweden in 2007. The selection based on migration year is done in order to ensure that the people originating in the new member states (NMS) are compared to other foreign-born people who were also new arrivals in Sweden in 2007. For the purposes of comparison, we include a 10 per cent random sample of people born in Sweden aged 20-64 and who were resident in Sweden in 2007. After this selection, the sample consists of
1,012,755 people: 517,646 men and 495,109 women.
The foreign-born people in our empirical analysis are divided into four groups: those born in the NMS, in EU14, in Non-EU Western countries, and in Non-EU Eastern European countries and non-European countries. The NMS are Cyprus, Estonia, Latvia, Lithuania, Malta, Poland, Slovakia, Slovenia, Czech Republic, and Hungary. EU14 comprises the old EU member states (excluding Sweden): Belgium, Denmark, Finland, France, Greece, Ireland, Italy, Luxemburg, the Netherlands, Portugal, Spain, the United Kingdom, Germany, and Austria. Non-EU Western countries comprise Western European countries outside the EU such as Norway, Switzerland and Iceland as well as the US, Canada, Australia, and New Zealand. Non-EU Eastern European countries and non-European countries comprise Eastern European countries outside the EU, such as Serbia and Croatia, and all non-European countries, except those include among
Western countries. Bulgaria and Rumania, who joined the EU in 2007, also are included in this group.
One purpose of the study is to explore differentials in monthly earnings. We obtained data on monthly earnings from the wage structure statistics (lönestrukturstatistiken) collected by Statistics Sweden for the National Mediation Office. The wage structure statistics contain information on, among other things, monthly earnings, hours of duty, and sector. Monthly earnings include fixed wages, fixed increments, piece wages, variable wages, penalty rates, and compensation for risk and emergency duty. In order to be comparable among workers with different working hours, the monthly earnings in the data are weighted to express full-time equivalents. Data are collected in September for the private sector and in November for the public, for all employees in the public sector and for a 50 per cent random sample of the total number of employees in the private sector.
We only include individuals with information about monthly earnings. After this selection is done, the sample consists of 432,874 individuals of whom 421,240 have positive monthly earnings. As result of the sampling procedure of the statistics on monthly earnings, public employees are overrepresented in the sample but private employees are under-represented. In addition, women are over-represented in our sample, since more women than men are active in the public sector. Another 1,766 people are dropped from the sample because of missing information on education. In total then, the final sample used to study monthly earnings consists of 419,474 individuals: 186,250 men and 233,224 women.
Another purpose of the study is to explore differences by occupational attainment. For this purpose we classify occupations into four categories. We use the classifications defined by Statistics Sweden (Standard för svensk yrkesklassificering (SSYK 96)), which classify occupations according their level of qualification: 1) little or no education, 2) a high school degree, 3) a university education of at most three years, and 4) a university education of at least three or four years. We do not have information on type of occupation for all members of the sample used to study monthly earnings. Therefore, the analysis of occupational attainment is done using a slightly smaller sample consisting of 397,473 individuals (171,789 men and 225,684 women).
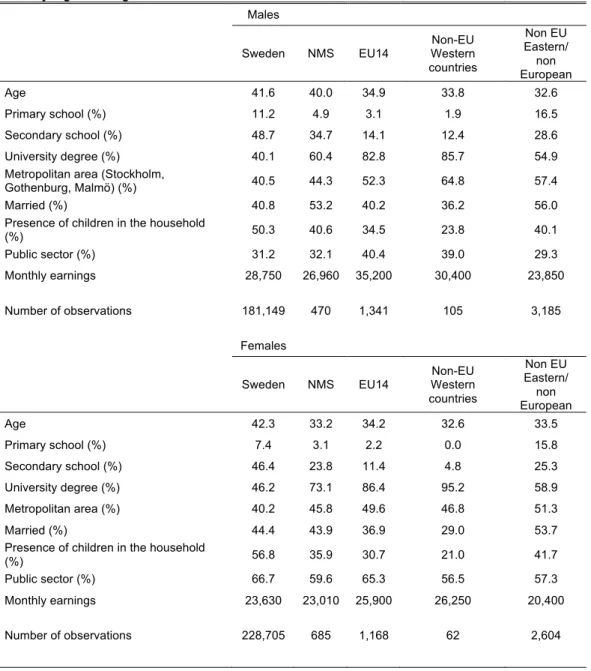
Table 1 shows some descriptive statistics of the individuals with positive monthly earnings. Male immigrants from the NMS are somewhat older than other immigrants. Male immigrants from the NMS are about 40 years of age; the average among the other groups is less than 35 years. Furthermore, about 60 per cent of immigrants from the NMS have a university degree. The corresponding figures for male immigrants from the EU14 and non-EU Western countries are 82 per cent and 86 per cent, respectively. However, among male immigrants from EU Eastern European countries and non-European countries this figure is about 55 per cent.
In terms of monthly earnings, male immigrants from the NMS earn, on average, about SEK 27,000. This is about 6 per cent less than natives and about 30 per cent less than immigrants from the EU14. However, male immigrants from the NMS earn about 13 per cent more than male immigrants from non-EU Eastern European and non-European countries.
Female immigrants from the NMS are younger than their male counterparts. The average age of female immigrants is about 33 years, which is comparable to the average age among other immigrant groups. Furthermore, the share of females with a university degree is higher than the share of males with a university degree education both among all immigrant groups and among natives. Among female immigrants from the NMS, about 73 per cent had a university degree.
Female immigrants from the NMS earned an average of SEK 23,000 per month, or about 3 per cent less than male natives and about 14 per cent less than female immigrants from the EU14 and from non-EU Western countries.
Table 1: Descriptive statistics of males and females with positive monthly earnings aged 20-64 in 2007 by region of origin
Males
Sweden NMS EU14 Western Non-EU countries Non EU Eastern/ non European Age 41.6 40.0 34.9 33.8 32.6 Primary school (%) 11.2 4.9 3.1 1.9 16.5 Secondary school (%) 48.7 34.7 14.1 12.4 28.6 University degree (%) 40.1 60.4 82.8 85.7 54.9 Metropolitan area (Stockholm,
Gothenburg, Malmö) (%) 40.5 44.3 52.3 64.8 57.4
Married (%) 40.8 53.2 40.2 36.2 56.0
Presence of children in the household
(%) 50.3 40.6 34.5 23.8 40.1 Public sector (%) 31.2 32.1 40.4 39.0 29.3 Monthly earnings 28,750 26,960 35,200 30,400 23,850 Number of observations 181,149 470 1,341 105 3,185 Females Sweden NMS EU14 Non-EU Western countries Non EU Eastern/ non European Age 42.3 33.2 34.2 32.6 33.5 Primary school (%) 7.4 3.1 2.2 0.0 15.8 Secondary school (%) 46.4 23.8 11.4 4.8 25.3 University degree (%) 46.2 73.1 86.4 95.2 58.9 Metropolitan area (%) 40.2 45.8 49.6 46.8 51.3 Married (%) 44.4 43.9 36.9 29.0 53.7
Presence of children in the household
(%) 56.8 35.9 30.7 21.0 41.7
Public sector (%) 66.7 59.6 65.3 56.5 57.3
Monthly earnings 23,630 23,010 25,900 26,250 20,400 Number of observations 228,705 685 1,168 62 2,604
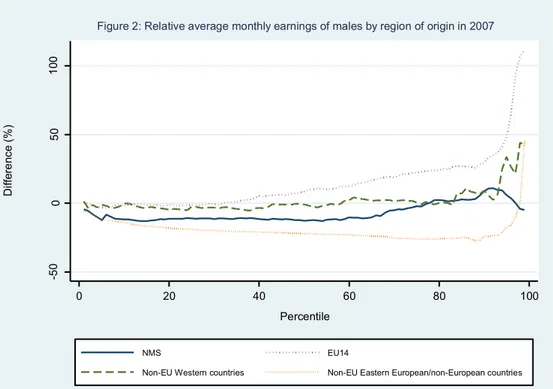
Figures 2 and 3 show the distribution of relative average monthly earnings for men and women by region of origin. The figures show the percentage difference in monthly
earnings between each of the four groups of foreign-born individuals and natives, respectively, over the earnings distribution for men and women. Following Nguyen et al (2006), the percentage difference in monthly earnings between e.g. the NMS and natives, is calculated as follows: ((EarningsNMS–EarningsNatives)/EarningsNatives)*100.
Figure 2 reveals that men originating in the NMS have lower monthly earnings than natives over most of the earnings distribution. However, around the 90th percentile the NMS have an earnings advantage over natives but also appear to be at an earnings disadvantage at the uppermost tail of the earnings distribution. For individuals born in EU14 there is no earnings differential compared to natives at the lower end of the earnings distribution. From the 30th percentile upwards, the monthly earnings of these men are larger than those of natives and this differential increases towards the upper tail of the earnings distribution. Men born in non-EU Western countries earn about the same as native men over most of the earnings distribution, except for the upper end of the distribution where these men are at an earnings advantage. Lastly, Figure 2 reveals that men born in non-EU Eastern European and non-European countries are at an earnings disadvantage over most of the earnings distribution and that the earnings differential slightly increases closer to the upper end of the distribution. However, at the uppermost tail, these foreign-born men earn more than Swedish men.
-5 0 0 50 10 0 Di ffe re nc e (% ) 0 20 40 60 80 100 Percentile NMS EU14
Non-EU Western countries Non-EU Eastern European/non-European countries Figure 2: Relative average monthly earnings of males by region of origin in 2007
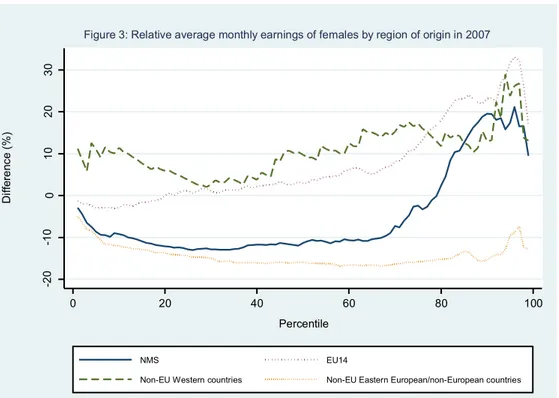
Figure 3 shows the relative monthly earnings of women and reveals large differences among these groups. Starting with women born in the NMS, Figure 3 reveals that these women are at an earnings disadvantage compared to native women up to about the 80th
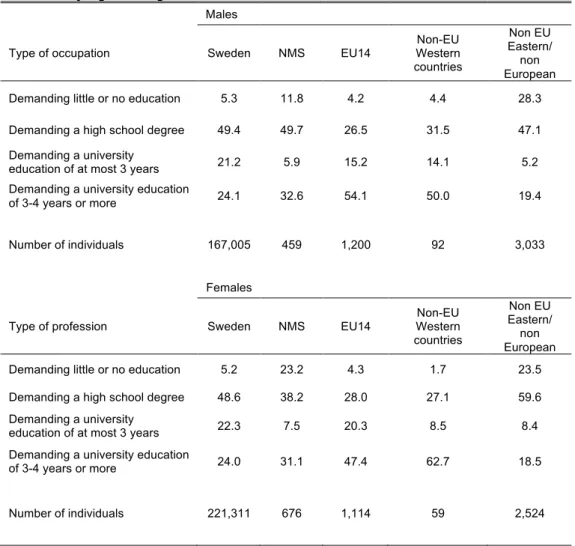
percentile. At the upper end of the earnings distribution, women originating from the NMS have higher monthly earnings than native women. For women born in EU14, we observe the same pattern as for men. There is no earnings differential relative to natives at the lower end of the distribution but from the 30th percentile upwards. Women from the EU14 are at an earnings advantage compared to natives – a differential that increases as we move up the distribution. Further, women originating in non-EU Western countries have higher monthly earnings than natives over the entire earnings distribution; the differential is largest at the upper tail of the distribution. Finally, Figure 3 shows that women born in non-EU Eastern European and non-European countries are at an earnings disadvantage compared to native women over the entire distribution. Table 2 shows the occupational attainment of men and women in 2007. We observe a similar pattern for both men and women. A relatively higher percentage of individuals originating in the NMS and in non-EU Eastern European and non-European countries holds occupations demanding little or no education or occupations demanding a high school degree. In contrast, men and women from the EU14 and in non-EU Western countries are more likely to be employed in occupations requiring at least three years of a university education. -2 0 -1 0 0 10 20 30 Di ffe re nc e (% ) 0 20 40 60 80 100 Percentile NMS EU14
Non-EU Western countries Non-EU Eastern European/non-European countries Figure 3: Relative average monthly earnings of females by region of origin in 2007
Table 2: Occupational attainment of males and females with positive monthly earnings aged 20-64 in 2007 by region of origin
Males
Type of occupation Sweden NMS EU14
Non-EU Western countries Non EU Eastern/ non European Demanding little or no education 5.3 11.8 4.2 4.4 28.3 Demanding a high school degree 49.4 49.7 26.5 31.5 47.1 Demanding a university
education of at most 3 years 21.2 5.9 15.2 14.1 5.2 Demanding a university education
of 3-4 years or more 24.1 32.6 54.1 50.0 19.4 Number of individuals 167,005 459 1,200 92 3,033
Females
Type of profession Sweden NMS EU14
Non-EU Western countries Non EU Eastern/ non European Demanding little or no education 5.2 23.2 4.3 1.7 23.5 Demanding a high school degree 48.6 38.2 28.0 27.1 59.6 Demanding a university
education of at most 3 years 22.3 7.5 20.3 8.5 8.4 Demanding a university education
of 3-4 years or more 24.0 31.1 47.4 62.7 18.5 Number of individuals 221,311 676 1,114 59 2,524
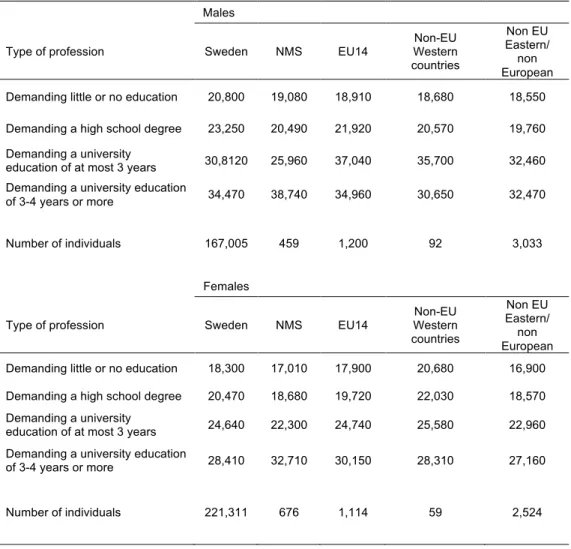
Table 3 shows average monthly earnings among the groups of immigrants within certain groups of occupational attainment. The figures in Table 3 are consistent with what was found in Figure 2 and Figure 3. Immigrants from the NMS are lower paid in professions demanding little or no education and those requiring a high school degree. However, the situation is different in professions requiring longer university education. Male immigrants from the NMS earn more than 10 per cent more per month than do natives in professions demanding a longer university education. Female immigrants from the NMS earn about 15 per cent more than female native in such professions.
Table 3: Monthly earnings of males and females with positive monthly earnings aged 20-64 in 2007 by occupational attainment and region of origin
Males
Type of profession Sweden NMS EU14
Non-EU Western countries Non EU Eastern/ non European Demanding little or no education 20,800 19,080 18,910 18,680 18,550 Demanding a high school degree 23,250 20,490 21,920 20,570 19,760 Demanding a university
education of at most 3 years 30,8120 25,960 37,040 35,700 32,460 Demanding a university education
of 3-4 years or more 34,470 38,740 34,960 30,650 32,470 Number of individuals 167,005 459 1,200 92 3,033
Females
Type of profession Sweden NMS EU14
Non-EU Western countries Non EU Eastern/ non European Demanding little or no education 18,300 17,010 17,900 20,680 16,900 Demanding a high school degree 20,470 18,680 19,720 22,030 18,570 Demanding a university
education of at most 3 years 24,640 22,300 24,740 25,580 22,960 Demanding a university education
of 3-4 years or more 28,410 32,710 30,150 28,310 27,160 Number of individuals 221,311 676 1,114 59 2,524
4. ESTIMATION STRATEGY
4.1 Earnings differentials
Most of the work on immigrants’ earnings departs from the work by Chiswick (1978) and Borjas (1985). The work by Chiswick and Borjas focuses on earnings assimilation. Their overarching question is how long it will take for immigrants to reach the earnings level of natives in the host country. However, this paper asks a different question. We are not interested in earnings assimilation among immigrants from the new member states. Instead, the aim of our empirical analysis is to explore the earnings situation in 2007 for immigrants arriving in Sweden from the new member states in 2005 and 2006. Since we are concerned with earnings among recently arrived immigrants, we neglect the influence of duration of residence in Sweden on earnings and begin by estimating a standard type Mincer earnings equation for males and females separately using OLS regression. Our specification is as follows:
ln yi = α + β1 X1+ β2 NMS + β3 EU14 +β4 Non-EU West + β5 Non-EU East/Non-Europe +
where ln yi is the logarithm of monthly earnings in 2007. The vector X1 contains control
variables for age, education, marital status, children resident in the household, region of residence in Sweden, and public sector.5 The variable NMS is a dummy variable and takes the value of 1 if the person migrated from the new member states and 0 otherwise. The variables EU14, Non-EU West and Non-EU East/Non-Europe are also dummy variables, indicating whether an individual migrated from any of the old member states, from a Western country outside the EU (e.g., Norway, Switzerland, United States, Australia or New Zealand), or from a non-EU Eastern European or non-European country (with the exceptions of the United States, Australia or New Zealand).6
As a second step, we estimate the same specification using quantile regression. In recent years, studies have used quantile regressions to explore how immigrants fare across the earnings distribution in different countries.7 Unlike OLS, quantile regression allows us to estimate the effect of a covariate on log monthly earnings at various points of the earnings distribution and not only the mean. Thus, quantile regressions enable us to estimate the effect of being an immigrant from the new member states on log monthly earnings at the 10th percentile as well as at the 90th percentile. We estimate quantile regressions separately for males and females for the 10th, 50th and 90th percentiles in our sample.8
4.2 Occupational attainment
In order to elucidate occupational attainment among immigrants from the new member states, we estimate an ordered probit model. The ordered probit model presumes that the occupational categories can be ranked from lowest to highest and predicts the conditional probability that an immigrant will end up in a certain occupation.9
Our specification of the model has the four types of professions as its categorical outcomes. Category 1 consists of professions requiring little or no education; category 2 consists of professions requiring a high school degree; category 3 comprises professions requiring a university education of up to three years, and category 4 is made up of professions requiring a university education of at least three or four years.
Our specification of the ordered probit model is as follows:
Prob(z = J) = 1 – Ф(µJ-1 – β´1X1 – β´2NMS – β´3 EU14 – β´4 Non-EU West – β´5 Non-EU East/Non-Europe)
for J = 1…4
where the variable z stands for the occupational categories described above. The vector X1 contains the same control variables as in the earnings equation described above.
Further, the variables NMS, EU14, Non-EU West, and Non-EU East/Non-Europe
5 All of the variables included in the regressions are presented in Table A1 in the Appendix.
6 Immigrants from the United States, Canada, Australia and New Zealand are included in the group of
Western countries.
7 See Butcher & Dinardo (2002), Chiswick, Le & Miller (2008), Hammarstedt & Shukur (2007).
8 See Koenker & Basset (1978) and Buchinsky (1994).
indicate region of origin and are defined in the same way as in the earnings equation above.10
5. RESULTS
5.1 Earnings differentials
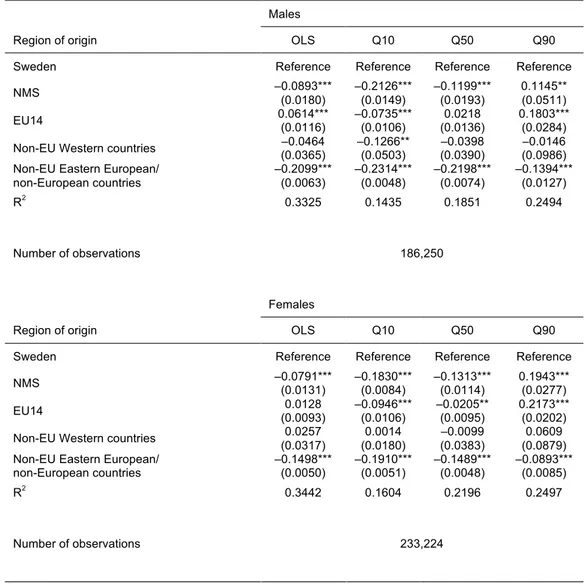
The results from the OLS and quantile regressions for males and females are presented in Table 4. The estimates from the OLS regression reveal that male immigrants from the NMS earn, on average, about 9 per cent less than native Swedes. Males originating from the EU14 earn about 6 per cent more than native males while males from non-European Eastern countries and non-European countries earn about 20 per cent less than natives. If we instead turn to the quantile regressions, it emerges that all male immigrant groups are at an earnings disadvantage compared to natives at the bottom of the earnings distribution (i.e. at the 10th percentile). This earnings disadvantage amounts to somewhat more than 20 per cent for male immigrants from the NMS and from non-EU Eastern European countries and to about 8 per cent for male immigrants from Western countries.
The pattern changes as we move up the earnings distribution. At the 90th percentile, male immigrants from the NMS earn about 12 per cent more than male natives while males originating from EU14 countries earn about 20 per cent more than male natives. Among male immigrants from non-EU Eastern European and non-European countries, the earnings disadvantage compared to natives at the 90th percentile is approximately 14 per cent.
The pattern observed for males also holds for females. The OLS results reveal that females originating from the NMS earn about 8 per cent less than native females while females from non-EU Eastern European countries or non-European countries earn about 15 percent less than female natives.
At the 10th percentile of the earnings distribution, females from the NMS earn about 18
per cent less than female natives. They are at an earnings advantage of about 20 per cent at the 90th percentile. The pattern is similar for females from the EU14, who earn almost 10 per cent less than female natives at the 10th percentile of the earnings distribution; they earn about 20 per cent more at the top of the earnings distribution. Female immigrants from non-EU Eastern European and non-European countries are at an earnings disadvantage compared to natives across the entire earnings distribution. This disadvantage amounts to about 10 percent at the 90th percentile.
Table 4: Estimation results from OLS and quantile regressions of monthly earnings (10th, 50th and
90th percentile, respectively) for males and females aged 20-64 in 2007 (robust standard errors
within parentheses)
Males
Region of origin OLS Q10 Q50 Q90
Sweden Reference Reference Reference Reference
NMS –0.0893*** (0.0180) –0.2126*** (0.0149) –0.1199*** (0.0193) 0.1145** (0.0511) EU14 0.0614*** (0.0116) –0.0735*** (0.0106) (0.0136) 0.0218 0.1803*** (0.0284) Non-EU Western countries (0.0365) –0.0464 –0.1266** (0.0503) (0.0390) –0.0398 (0.0986) –0.0146 Non-EU Eastern European/
non-European countries –0.2099*** (0.0063) –0.2314*** (0.0048) –0.2198*** (0.0074) –0.1394*** (0.0127) R2 0.3325 0.1435 0.1851 0.2494 Number of observations 186,250 Females
Region of origin OLS Q10 Q50 Q90
Sweden Reference Reference Reference Reference NMS –0.0791*** (0.0131) –0.1830*** (0.0084) –0.1313*** (0.0114) 0.1943*** (0.0277) EU14 (0.0093) 0.0128 –0.0946*** (0.0106) –0.0205** (0.0095) 0.2173*** (0.0202) Non-EU Western countries (0.0317) 0.0257 (0.0180) 0.0014 (0.0383) –0.0099 (0.0879) 0.0609 Non-EU Eastern European/
non-European countries –0.1498*** (0.0050) –0.1910*** (0.0051) –0.1489*** (0.0048) –0.0893*** (0.0085)
R2 0.3442 0.1604 0.2196 0.2497
Number of observations 233,224
Note: Controls for age, education, residence in metropolitan area, marital status, children in the household, and public sector are included.
* indicates statistical significance at the 10-per cent level, ** at the 5 per cent level, and *** at the 1 per cent level.
5.2 Occupational attainment
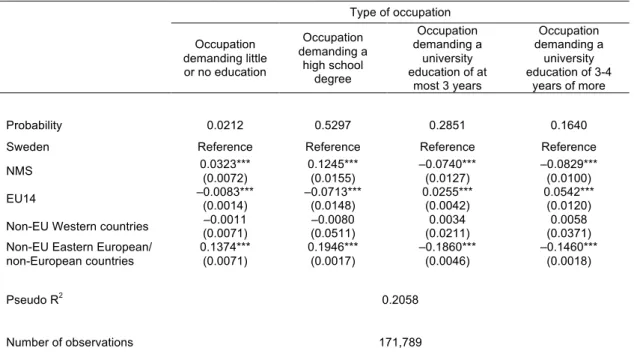
Tables 5 and 6 show the estimates of occupational attainment for males and females. Both male and female immigrants from the NMS have a higher propensity than natives to be employed in occupations demanding little or no education or a high school degree. Furthermore, the propensity to end up in occupations demanding a university education is lower for both male and female immigrants from the NMS than for natives.
The same pattern occurs for all immigrants from EU Eastern European and non-European countries. However, the propensity of employment in occupations requiring a minimal education or a high school degree is even higher for immigrants from non-EU Eastern European countries and non-European countries than for immigrants from the NMS. The propensity of holding a job that requires a university degree is lower for immigrants from non-EU Eastern European countries and non-European countries than for immigrants from the NMS.
Table 5: Ordered probit estimations of occupational attainment for males aged 20-64 in 2007, marginal effects (standard errors within parentheses)
Type of occupation Occupation demanding little or no education Occupation demanding a high school degree Occupation demanding a university education of at most 3 years Occupation demanding a university education of 3-4 years of more Probability 0.0212 0.5297 0.2851 0.1640
Sweden Reference Reference Reference Reference
NMS 0.0323*** (0.0072) 0.1245*** (0.0155) –0.0740*** (0.0127) –0.0829*** (0.0100) EU14 –0.0083*** (0.0014) –0.0713*** (0.0148) 0.0255*** (0.0042) 0.0542*** (0.0120) Non-EU Western countries (0.0071) –0.0011 (0.0511) –0.0080 (0.0211) 0.0034 (0.0371) 0.0058 Non-EU Eastern European/
non-European countries 0.1374*** (0.0071) 0.1946*** (0.0017) –0.1860*** (0.0046) –0.1460*** (0.0018) Pseudo R2 0.2058 Number of observations 171,789
Note: Controls for age, education, residence in metropolitan area, marital status, children in the household, and public sector are included.
* indicates statistical significance at the 10-per cent level, ** at the 5 per cent level, and *** at the 1 per cent level.
Among immigrants from the EU14 a different pattern emerges. All immigrants from the EU14 are less likely than natives to be employed in occupations requiring either little or no education or a high school degree. Furthermore, they are more likely to be employed in occupations that require a university education.
Table 6: Ordered probit estimations of occupational attainment for females aged 20-64 in 2007, marginal effects (standard errors within parentheses)
Type of occupation Occupation demanding little or no education Occupation demanding a high school degree Occupation demanding a university education of at most 3 years Occupation demanding a university education of 3-4 years of more Probability 0.0155 0.5388 0.2982 0.1475
Sweden Reference Reference Reference Reference
NMS 0.0715*** (0.0107) 0.2001*** (0.0068) –0.1560*** (0.0125) –0.1155*** (0.0050) EU14 –0.0028** (0.0014) –0.0278* (0.0154) (0.0063) 0.0121* (0.0105) 0.0185* Non-EU Western countries –0.0091** (0.0036) –0.1233 (0.0756) 0.0422** (0.0166) (0.0626) 0.0903 Non-EU Eastern European/
non-European countries 0.0872*** (0.0059) 0.2100*** (0.0022) –0.1738*** (0.0058) –0.1235*** (0.0021)
Pseudo R2 0.2257
Number of observations 225,684
Note: Controls for age, education, residence in metropolitan area, marital status, children in the household, and public sector are included.
6. CONCLUSIONS AND DISCUSSION
In 2004 the United Kingdom, Ireland and Sweden gave citizens from the EU’s new member states full access to their labour markets. This paper has been devoted to an empirical analysis of earnings and occupational attainment among immigrants from these states in Sweden.
Previous research has shown that immigrants from the NMS have a somewhat lower employment rate and slightly lower earnings than do Swedish natives. The results in this paper add to previous research, since the observed earnings disadvantage for immigrants from the NMS are largely concentrated at the lower end of the earnings distribution. Immigrants from the NMS are at an earnings disadvantage compared to natives among low-income earners in Sweden. However, as we move up the earnings distribution, immigrants from the NMS improve their position at the top of the earnings distribution where they hold an earnings advantage over natives.
However, the picture of the labour market position of immigrants from the NMS is complex. When we look at occupational attainment, we find that immigrants from the NMS are over-represented in occupations demanding little or no education while they are under-represented in occupations demanding university educations. So even if immigrants from the NMS who get highly qualified jobs do well in terms of earnings, these immigrants still encounter obstacles before reaching those positions.
Our study sheds light on a new dimension of the integration of immigrants. The enlargement of the European Union is ongoing and it is important to build up knowledge about the composition of internal migration in Europe and about the performance of these immigrants in the labour market of their new country. Non-European immigrants in Europe are especially susceptible to low earnings and high rates of unemployment. Our study has shown both differences and similarities between the labour market position of immigrants from the NMS and non-European immigrants. Both groups of immigrants have difficulties in attaining highly qualified positions on the labour market. However, while non-European immigrants struggle to find well-paid positions, immigrants from the NMS who do attain such positions have an earnings advantage over natives.
These results suggest that more research on the mechanisms behind labour market outcomes among immigrants from the NMS is needed. Such research may deepen the understanding of why immigrants have trouble obtaining high ranked positions. It may also give us an understanding what applicants need to be offered such positions and the determinants of their success on the labour market.
REFERENCES
Barrett, A. and D. Duffy
2008 “Are Ireland’s immigrants integrating into its labour market?” International Migration
Review 42: 579–619. ______ , and Y. McCarthy
2007 “Immigrants in a booming economy: analysing their earnings and welfare dependence.”
Labour, 21: 789–808.
______ , S. McGuiness, and M. O’Brien, M.
2011 “The immigrant earnings disadvantage across the earnings and skills distribution: The
case of immigrants from EU’s new member states.” British Journal of Industrial Relations, forthcoming.
Blanchflower, D.G., J. Saleheen and C. Shadforth
2007 “The impact of the recent migration from Eastern Europe on the UK Economy.” IZA
Discussion Paper, 2615. ______ , and H. Lawton
2009 “The impact of the expansion of the EU on the British labour market.” in: Kahanec, M.
and K.F Zimmermann (eds.) EU labor markets after post-enlargement migration, Springer.
Borjas, G.J.
1985 “Assimilation, changes in cohort quality, and the earnings of immigrants.” Journal of
Labor Economics 3: 463–489. Buchinsky, M.
1994 “Changes in the US wage structure 1963 to 1987: application of quantile regression”
Econometrica 62: 405–458. Butcher, K. and J. Dinardo
2002 “The immigrant and native-born wage distribution: evidence from the United States”
Industrial and Labor Relations Review 56: 97–121.
Chiswick, B.R.
1978 “The effect of Americanization on the earnings of foreign-born men” Journal of Political Economy 86: 897–921.
______ , A. T Le and P.W Miller
2008 “How immigrants fare across the earnings distribution: International analysis” Industrial and Labor Relations Review 61: 353–373.
Drinkwater, S., J. Eade and M. Garapich
2008 “Poles apart? EU enlargement and the labour market outcomes of immigrants in the
UK” International Migration 47: 161–190.
Edin, P-A, R. Lalonde and O. Åslund
2000 “Emigration of immigrants and measures of immigrant assimilation.” Swedish Economic Policy Review 7: 163–204.
Gerdes, C. and E. Wadensjö
2008 “Immigrants from the new member states and the Swedish welfare state.” Sieps Report
2008:9.
le Grand, C. and R. Szulkin
2002 “Permanent disadvantage or gradual integration: Explaining the immigrant-native earnings gap in Sweden.” Labour 16: 37–64.
Hammarstedt, M.
2003 ”Income from work among immigrants in Sweden.” Review of Income and Wealth 49:
185–203.
______ , and G. Shukur
2006 ”Immigrants’ relative earnings in Sweden – a cohort analysis.” Labour 20: 285– 323.
______ , and ______
2007 ”Immigrants’ relative earnings in Sweden – a quantile regression approach.” International Journal of Manpower 28: 456–473.
Koenker, R. and G. Basset
1978 “Regression quantiles.” Econometrica 46: 33–50. McKelvey, R.D. and W. Zavoina
1975 “A statistical model for the analysis of ordinal level dependent variable.” Journal of Mathematical Sociology 4: 103–120.
Miller, P.W. and P.A. Volker
1985 “On the determination of occupational attainment and mobility.” Journal of Human
Resources 20: 197–213. Nekby, L.
2002 “How long does it take to integrate? Employment convergence of immigrants and natives in Sweden.”, FIEF Working Paper, 185.
2006 “A quantile regression decomposition of urban-rural inequality in Vietnam.”, Journal of
Development Economics 83: 466–490. Statistics Sweden
APPENDIX
Appendix A
Table A1: Explanatory variables used in the OLS, quantile and ordinal probit regressions
Variable Explanation
Dependent variables
ln yi Log monthly full-time earnings in 2007
Prob(z = J)
J = 1 for occupations demanding little or no education, J = 2 for occupations demanding a high school degree,
J = 3 for occupations demanding a university education of 3 years at most,
J = 4 for occupations demanding a university education of 3-4 years or more.
Independent variables
Sweden Reference
NMS 1 if the individual is born in Cyprus, Estonia, Latvia, Lithuania, Malta Poland, Slovakia, Czech Republic or in Hungary, 0 otherwise EU14
1 if the individual is born in Belgium, Denmark, Finland, France, Greece, Ireland, Italy, Luxemburg, the Netherlands, Portugal, Spain, Great Britain, Germany, or in Austria, 0 otherwise
Non-EU Western countries 1 if the individual is born in Western countries outside the EU, 0 otherwise Non-EU Eastern European/
non-European countries
1 if the individual is born in Eastern European countries outside the EU or in non-European countries, 0 otherwise
Age Continuous
Age squared / 100 Continuous Primary school Reference
Secondary school 1 if secondary school, 0 otherwise University degree 1 if university degree, 0 otherwise
Metropolitan area 1 if living in the region of Stockholm, Gothenburg or Malmö, 0 otherwise Married 1 if married, 0 otherwise
Children in the household 1 if resident children in the household, 0 otherwise Public sector 1 if employed in the public sector, 0 otherwise
Figure 1: Number of individuals born in NMS resident in Sweden in 2000-2010 0 20000 40000 60000 80000 100000 120000 2000 2001 2002 2003 2004 2005 2006 2007 2008 2009 2010 Year -5 0 0 50 10 0 Di ffe re nc e (% ) 0 20 40 60 80 100 Percentile NMS EU14
Non-EU Western countries Non-EU Eastern European/non-European countries Figure 2: Relative average monthly earnings of males by region of origin in 2007
-2 0 -1 0 0 10 20 30 Di ffe re nc e (% ) 0 20 40 60 80 100 Percentile NMS EU14
Non-EU Western countries Non-EU Eastern European/non-European countries Figure 3: Relative average monthly earnings of females by region of origin in 2007
Table 1: Descriptive statistics of males and females with positive monthly earnings aged 20-64 in 2007 by region of origin Males Sweden NMS EU14 Non-EU Western countries Non EU Eastern/ non European Age 41.6 40.0 34.9 33.8 32.6 Primary school (%) 11.2 4.9 3.1 1.9 16.5 Secondary school (%) 48.7 34.7 14.1 12.4 28.6 University degree (%) 40.1 60.4 82.8 85.7 54.9 Metropolitan area (Stockholm,
Gothenburg, Malmö) (%) 40.5 44.3 52.3 64.8 57.4
Married (%) 40.8 53.2 40.2 36.2 56.0
Presence of children in the household
(%) 50.3 40.6 34.5 23.8 40.1 Public sector (%) 31.2 32.1 40.4 39.0 29.3 Monthly earnings 28,750 26,960 35,200 30,400 23,850 Number of observations 181,149 470 1,341 105 3,185 Females Sweden NMS EU14 Non-EU Western countries Non EU Eastern/ non European Age 42.3 33.2 34.2 32.6 33.5 Primary school (%) 7.4 3.1 2.2 0.0 15.8 Secondary school (%) 46.4 23.8 11.4 4.8 25.3 University degree (%) 46.2 73.1 86.4 95.2 58.9 Metropolitan area (%) 40.2 45.8 49.6 46.8 51.3 Married (%) 44.4 43.9 36.9 29.0 53.7
Presence of children in the household
(%) 56.8 35.9 30.7 21.0 41.7
Public sector (%) 66.7 59.6 65.3 56.5 57.3
Monthly earnings 23,630 23,010 25,900 26,250 20,400 Number of observations 228,705 685 1,168 62 2,604
20-64 in 2007 by region of origin
Males
Type of occupation Sweden NMS EU14
Non-EU Western countries Non EU Eastern/ non European Demanding little or no education 5.3 11.8 4.2 4.4 28.3 Demanding a high school degree 49.4 49.7 26.5 31.5 47.1 Demanding a university
education of at most 3 years 21.2 5.9 15.2 14.1 5.2 Demanding a university education
of 3-4 years or more 24.1 32.6 54.1 50.0 19.4 Number of individuals 167,005 459 1,200 92 3,033
Females
Type of profession Sweden NMS EU14
Non-EU Western countries Non EU Eastern/ non European Demanding little or no education 5.2 23.2 4.3 1.7 23.5 Demanding a high school degree 48.6 38.2 28.0 27.1 59.6 Demanding a university
education of at most 3 years 22.3 7.5 20.3 8.5 8.4 Demanding a university education
of 3-4 years or more 24.0 31.1 47.4 62.7 18.5 Number of individuals 221,311 676 1,114 59 2,524
2007 by occupational attainment and region of origin Males
Type of profession Sweden NMS EU14
Non-EU Western countries Non EU Eastern/ non European Demanding little or no education 20,800 19,080 18,910 18,680 18,550 Demanding a high school degree 23,250 20,490 21,920 20,570 19,760 Demanding a university
education of at most 3 years 30,8120 25,960 37,040 35,700 32,460 Demanding a university education
of 3-4 years or more 34,470 38,740 34,960 30,650 32,470 Number of individuals 167,005 459 1,200 92 3,033
Females
Type of profession Sweden NMS EU14
Non-EU Western countries Non EU Eastern/ non European Demanding little or no education 18,300 17,010 17,900 20,680 16,900 Demanding a high school degree 20,470 18,680 19,720 22,030 18,570 Demanding a university
education of at most 3 years 24,640 22,300 24,740 25,580 22,960 Demanding a university education
of 3-4 years or more 28,410 32,710 30,150 28,310 27,160 Number of individuals 221,311 676 1,114 59 2,524
Table 4: Estimation results from OLS and quantile regressions of monthly earnings (10th, 50th and
90th percentile, respectively) for males and females aged 20-64 in 2007 (robust standard errors
Males
Region of origin OLS Q10 Q50 Q90
Sweden Reference Reference Reference Reference NMS –0.0893*** (0.0180) –0.2126*** (0.0149) –0.1199*** (0.0193) 0.1145** (0.0511) EU14 0.0614*** (0.0116) –0.0735*** (0.0106) (0.0136) 0.0218 0.1803*** (0.0284) Non-EU Western countries (0.0365) –0.0464 –0.1266** (0.0503) (0.0390) –0.0398 (0.0986) –0.0146 Non-EU Eastern European/
non-European countries –0.2099*** (0.0063) –0.2314*** (0.0048) –0.2198*** (0.0074) –0.1394*** (0.0127) R2 0.3325 0.1435 0.1851 0.2494 Number of observations 186,250 Females
Region of origin OLS Q10 Q50 Q90
Sweden Reference Reference Reference Reference NMS –0.0791*** (0.0131) –0.1830*** (0.0084) –0.1313*** (0.0114) 0.1943*** (0.0277) EU14 (0.0093) 0.0128 –0.0946*** (0.0106) –0.0205** (0.0095) 0.2173*** (0.0202) Non-EU Western countries (0.0317) 0.0257 (0.0180) 0.0014 (0.0383) –0.0099 (0.0879) 0.0609 Non-EU Eastern European/
non-European countries –0.1498*** (0.0050) –0.1910*** (0.0051) –0.1489*** (0.0048) –0.0893*** (0.0085) R2 0.3442 0.1604 0.2196 0.2497 Number of observations 233,224
Note: Controls for age, education, residence in metropolitan area, marital status, children in the household, and public sector are included.
* indicates statistical significance at the 10-per cent level, ** at the 5 per cent level, and *** at the 1 per cent level.
Table 5: Ordered probit estimations of occupational attainment for males aged 20-64 in 2007, marginal effects (standard errors within parentheses)
Type of occupation
demanding little or no education demanding a high school degree demanding a university education of at most 3 years demanding a university education of 3-4 years of more Probability 0.0212 0.5297 0.2851 0.1640
Sweden Reference Reference Reference Reference
NMS 0.0323*** (0.0072) 0.1245*** (0.0155) –0.0740*** (0.0127) –0.0829*** (0.0100) EU14 –0.0083*** (0.0014) –0.0713*** (0.0148) 0.0255*** (0.0042) 0.0542*** (0.0120) Non-EU Western countries (0.0071) –0.0011 (0.0511) –0.0080 (0.0211) 0.0034 (0.0371) 0.0058 Non-EU Eastern European/
non-European countries 0.1374*** (0.0071) 0.1946*** (0.0017) –0.1860*** (0.0046) –0.1460*** (0.0018) Pseudo R2 0.2058 Number of observations 171,789
Note: Controls for age, education, residence in metropolitan area, marital status, children in the household, and public sector are included.
* indicates statistical significance at the 10-per cent level, ** at the 5 per cent level, and *** at the 1 per cent level.
Table 6: Ordered probit estimations of occupational attainment for females aged 20-64 in 2007, marginal effects (standard errors within parentheses)
Type of occupation Occupation demanding little or no education Occupation demanding a high school degree Occupation demanding a university education of at most 3 years Occupation demanding a university education of 3-4 years of more Probability 0.0155 0.5388 0.2982 0.1475
Sweden Reference Reference Reference Reference
NMS 0.0715*** (0.0107) 0.2001*** (0.0068) –0.1560*** (0.0125) –0.1155*** (0.0050) EU14 –0.0028** (0.0014) –0.0278* (0.0154) (0.0063) 0.0121* (0.0105) 0.0185* Non-EU Western countries –0.0091** (0.0036) –0.1233 (0.0756) 0.0422** (0.0166) (0.0626) 0.0903 Non-EU Eastern European/
non-European countries 0.0872*** (0.0059) 0.2100*** (0.0022) –0.1738*** (0.0058) –0.1235*** (0.0021) Pseudo R2 0.2257 Number of observations 225,684
Note: Controls for age, education, residence in metropolitan area, marital status, children in the household, and public sector are included.