Title: Authors: Unit: Sponsor: Project No.: Project title: Distribution:
MEASUREMENT OF MEGATEXTURE AND MACROTEXTURE BY THE VTI MoBILE LAsER PROFILOMETER AT THE NASA WALLoPs FLIGHT FaCciLiTY, ViRGiNiA, USA
Ulf Sandberg Per Anund
Road Vehicle Engineering 20229
Measurement of Road Surface Texture
NASA Langley Research Center, Swedish National Road Administration
Free div Väg- och transport-forskningsinstitutet ä
CONTENTS
SUMMARY
1. BACKGROUND
2. PURPOSE OF THE MEASUREMENTS EQUIPMENT
1 The VTI Mobile Laser Profilometer 1.1 General Description
1.2 Principle of Operation
2 The "Stripped" Version of the Profilometer
3 Data Processing and Presentation
4 Calibration TEST SITES RESULTS
COMMENTS TO THE RESULTS REFERENCES
APPENDIX 1: AVERAGE TEXTURE SPECTRUM FOR EACH TEST SITE APPENDlX 2: TEXTURE SPECTRUM FOR EACH INDIVIDUAL SECTION APPENDIX 3: CALIBRATION AND BACKGROUND NOlSE
APPENDIX 4: PROFlLE CURVES
VTI NOTAT 52-94 N (D o m h wwo øw N 10 12 13 14 28 43 47
Measurement of Megatexture and Macrotexture by the VTI Mobile Laser
Profilometer, at the NASA Wallops Flight Facility, Virginia, USA by Ulf Sandberg and Per Anund
Swedish Road and Transport Research Institute (VTI)
8-581 95 Linköping, Sweden
SUMMARY
This report presents the results of texture measurements made by VTI in May
1993, at the NASA Wallops Flight Facility, Virginia, USA. The measurements were carried out on selected test surfaces on airñeld runways, some of which were also included in an international experiment to compare friction and texture measuring devices. The mentioned international experiment was organized by the Surface Characteristics Committee of the Permanent International Association of Road Congresses (PIARC) which originally included test sites on roads and airfields in Belgium and Spain measured in 1992. The measurements reported in this VTI
Notat will contribute to the data base of the mentioned international experiment and
be used for subsequent evaluations involving this experiment.
The texture measuring device utilized here was a "stripped" version of the VTI Mobile Laser Profilometer. The original profilometer is a complete system mounted in a Volvo car including an electro-optical device with a laser beam to measure the
surface profile, hardware and software to process its signal, third-octave band frequency analyzer, speed control systern, an AC 240 V power system, a calibration surface and a computer to process and present the data. In the NASA experiment, it was too expensive to carry the entire system over the Atlantic, so a "stripped" version was prepared. In this version, only the electro-optical device with its hard- and software, the calibration surface and a digital tape recorder were shipped from Sweden to USA. The signal was then tape recorded for later analysis
in the VTI Iaboratories. In order to cany the equipment during the measurements, a van from NASA was utilized.
Once the equipment had arrived from Sweden, the preparations and the measurements were conducted in just a few hours. Everything worked satisfactory
and the results demonstrates that it is possible to conduct measurements with such a stripped profilometer version without major problems. However, being the first time this technique was utilized, several procedures need to be improved from a practical point of view.
The texture measures collected by the VTI profilometer and reported here include Mean Profile Depth (MPD), Estimated Texture Depth (ETD), Root Mean Square
(RMS), Texture Depth predicted by the MAcrotexure Level (TDMa), Macrotexture
Level (LMa), Megatexture Level (LMe) and texture spectra expressed in 25
third-octave bands covering the texture wavelength range of 2-500 mm. ETD is a measure that attempts to predict from the profile curve a mean texture depth measured according to the volumetn'c method (also called "sand-patch method"). This report also includes typical proñle curves on each site, along with amplitude distribution curves.
International Association of Road Congresses (PIARC). The main measurements
were conducted in 1992 and included test sites on roads and airfields in Belgium
and Spain. The VTI Mobile Laser Profilometer participated as one of several texture measuring devices from Europe and North America in this experiment. Results of this very successful experiment are reported in [PlARC, 1994].
In 1993, the experiment was "linked" to a somewhat related experiment conducted at the NASA flight facility on Wallops Island, on the eastem shore of Virginia, USA.
This facility, called NASA Wallops Flight Facility, includes several test surfaces with
various textures and made of various materials, located on an airfield runway and a taxiway. On some of these surfaces, measurements of friction and texture were made in 1993, to be followed by some measurements also in 1994, utlizing several
of the devices of the PIARC experiment in Europe but also including several devices which were not used in the European tests.
An invitation to participate in this NASA experiment was extended to the
participants of the PIARC experiment. It was decided to include the VTl Mobile
Laser Profilometer in the experiment (in a "stripped" version, see below), partly
because the main author of this report was travelling to the United States for another reason at a time which coincided with the experiments, partly because it was judged that the extension of the PlARC project to include the NASA test surfaces and some new devices would largely increase the quality of the PIARC experiment. One of the reasons for the latter was the special grooved surfaces and an extremely smooth surface (aluminum panels) available at the NASA Wallops Flight Facility. Such surfaces had not been included in the European experiment,
which was later realized to be a certain disadvantage. In addition, the VTl profilometer was the only equipment participating in the NASA experiment which
was able of characterizing the surface texture in a texture spectrum and the only
one capable of measuring megatexture. Without such measurements, it would be
difficult to link the two experiments together totally.
This report presents the results of texture measurements made by VTI in May 1993, at the NASA Wallops Flight Facility, Virginia, USA.
2. PURPOSE OF THE MEASUREMENTS
The purpose was to conduct mega- and macrotexture measurements on the test
sites of the NASA Wallops Flight Facility with the VTl Mobile Laser Profilometer, in
order to make it possible to link the tests with those made in the International PIARC Experiment in 1992 in Europe and also to extend the data base significantly with new types of surfaces and new devices.
A secondary purpose was to see if the "stripped" version of the profilometer used here was feasible to use in such a case when the complete system could not be transported to the test location.
3 EQUIPMENT
3.1 The VTI Mobile Laser Profilometer
3.1.1 General Description
The VTI Mobile Laser Profilometer consists of an electro-optical system, mounted in a car, which measures the vertical distance between the vehicle body and a small laser spot on the road surface, a real-time third-octave band spectrum
analyzer, a computer for data processing and presentation of results, as well as a
Volvo 245 car in which the equipment is mounted. The computer is equipped with a data acquisition board and a GPlB interface.
The system is described further in [Sandberg & Anund, 1992].
3.1.2 Principle of Operation
The non-contact measurement makes use of an infrared laser beam which creates a light spot on the road surface. An optical lens system, looking at the light spot at
30° inclination relative to the vertical laser beam, projects this light spot onto a
certain position on a linear silicon sensor. This gives an output current with a
certain relation to the position of the light spot on the sensor and thus to the vertical position of the light spot on the road. When the vehicle moves at constant speed, this light spot moves over the surface profile, thus giving a profile curve which describes the texture of the surface.
After regulation of the signal in order to have an optimum light spot intensity and
linearization of the output signal, the output is fed to a frequency analyzer which calculates on-line the texture spectrum of the profile signal. At the same time, the
output signal is fed to a computer which stores the complete profile curve in a file. Based on the texture spectrum and the profile curve, some overall texture descriptors, which have been found to have interesting relationships with road surface Characteristics and vehicle performance, are calculated.
The profile curve is used for calculation of the three major macrotexture descriptors; MPD, ETD and RMS:
MPD = Mean Profile Depth = the area between a line which touches the peaks of the surface and the profile curve. Such lines/areas are calculated each 70 mm of the profile. Before this calculation is made, the profile over 140 mm is "straightened up" to remove any constant slope over this distance. The area has a very close relationship with the volume of the sand which tills the surface voids when the
so-called sand-patch method is used to measure the texture depth [PIARC, 1994]. ETD = Estimated Texture Depth = a measure derived from MPD but using an
equation to transform the MPD values to become nominally equal to the texture
depth measured by the "Volumetn'c Patch Method", generally referred to as the Sand Patch Method earlier.
RMS = the Root Mean Square of the profile curve.
was a "stripped" version of the VTI Mobile Laser Profilometer which could be
transported in a box by an air carrier. As described above, the original profilometer
is a complete system mounted in a Volvo 245 car, including an electro-optical device with a laser beam to measure the surface profile, hardware and software to
process its signal, third-octave band frequency analyzer, speed control system, an AC 240 V power system, a calibration surface and a computer to process and
present the data. In the NASA experiment, only the electro-optical device with its
hard- and software, the calibration surface and a digital tape recorder were shipped
from Sweden to Virginia. The signal was then tape recorded for later analysis in the VTI laboratories.
In order to carry the equipment during measurements, a van from NASA was
utilized. The electro-optical sensor was mounted at the rear bumper of this van making use of the same suspension device in which the sensor usually is mounted. The speedometer of the van had been tested prior to the measurements in order to check where on the scale the appropriate measurement speed of 10 m/s (36 km/h) was located. This speed was then kept during the measurements to within 3 km/h.
Such a variation is somewhat higher than when using thespeed control of the VTI Volvo car, but would at most displace the texture wavelength scale by :8 °/o from the ideal. Since the frequency resolution is third-octave bands, with a bandwidth of :t11°/o, the potential error would be accommodated within such a band.
The tape recorder was a Casio "Portable Audio Digital Tape Recorder, type DA-7".
Its performance is critical for this expen'ment. The most important Characteristics
were an impressive SIN ratio of 90 dB (dynamic range 85 dB) and a frequency response which was claimed to be flat within 10 and 20000 H2 (-1 dB at the limits). The potential effect of the tape recording would be as follows. The use of the tape recorder means that the signal would be an AC instead of a DC signal, i.e. there would be a lower frequency limit. A reduction of at most 1 dB at 10 Hz would not in any way influence the interesting part of the texture spectrum, the latter of which is limited to wavelengths of 500 mm or lower, corresponding to frequencies of no less
than 20 Hz. Nevertheless, there might be some influence on the low-frequency part
of the profile curve which might be slightly distorted. The latter was tested by running a rectangular wave with a fundamental period corresponding to approx. 50 mm of texture wavelength through the tape recorder and comparing the input and output signals. lt was found that the high and low levels of the curve were slightly "tilted" as a result of the high-pass tiltering of the recorder, but that this effect was so small that it would not signiñcantly influence the calculations based on the proñle curve.
Once the equipment had arrived from Sweden, the preparations and the measurements were conducted in just a few hours. Everything worked satisfactory and the results demonstrates that it is possible to conduct measurements with such a stripped profilometer version without major problems. However, being the first
time this technique was utilized, several procedures need to be improved from a
practical point of view.
3.3 Data' Processing and Presentation
For a measurement over 80 m, the profile curve is divided into 512 parts and for
160 m it is divided into 1024 parts, where each part is 156.25 mm long. For historical and technical reasons, only 140 mm of 156.25 mm (90 %) of each profile is used for MPD, ETD and RMS calculations. A total MPD, ETD and RMS are calculated as the mean value of all these 512 (or1024) individual values.
In the typical printout of a profile curve, seen in Fig. 1, the level distribution is
plotted to the right of the profile curve. The thick distribution curve corresponds to the average of all measurements of this run and the thin curve to the particular profile shown in the figure. The text within the frame concerns the following: The
left column shows the data for the particular profile shown in the figure, the right column shows the data for an average profile based on all profiles recorded in the
run. An example of a texture printout with spectrum is shown in Fig. 2.
Note: The ETD values have been calculated based on a transformation equation
deterrnined in an experiment many years ago. The equation is assumed to result in
ETD values which are nominally equal to "sand-patch" texture depth. In the PlARC
experiment, it has appeared that a slight modification of this equation is necessary.
While international standardization work is still in progress, this equation has not yet been modified, but it is likely to be modified in 1994. The conversion factors for
this will be available so that it will always be possible to convert the "old" ETD values here to "new" ones.
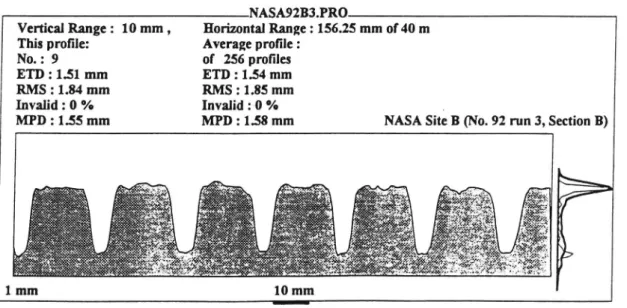
NASA92B3.PRO
Vertical Range : 10 mm , Horizontal Range: 156.25 mm of 40 m This profile: Average profile:
No. : 9 of 256 protiles
ETD : 1.51 mm ETD : 1.54 mm
RMS : 1.84 mm RMS : 1.85 mm
Invalid : 0 % Invalid :0 % .
MPD : 1.55 mm MPD : 1.58 mm NASA Site B (No. 92 run 3, Section B)
Fig. 1 Typical profile curve printout from texture measurement. Site No. 92, i.e. NASA B which is a cement concrete with transverse grooves 1/ " deep and 1/ "wide, spaced 1" apart. The length of this profile is 156.25 mm or 1/512 of the complete 40 m measurement in this particular run. The
vertical range is 10 mm from top to bottom of the rectangle. Scales are
indicated as thicker lines on the frame. Thicker parts of the proñle curve
are drop-outs, i.e. where the profile signal has been invalid and the profile is interpolated (no such parts appear here).
Other site description' : AsplL coca.. ground. 1' 51.8 dB(Mc) cum
48.7 Mim) For nota: pred.
Unna/nn : 337 49.0 W) For nom prcd.
I deeptbnluainm: 1111): 1.65 MPD: 1.75 RMS: 1.56 TDMA: 3.33
Du: HW : 4 MAY 1993 W Disa.: : 20 In Invalid 06) . 0
Nu.: Report File : NASAS'IAVG
Spelarna Fila : NASAB'I_LSPC NASM7_J.SPC
Pmñle Fila : NASAHJJFRO NASAUJJRO
W band mal levels
m dB mm 43 500 42.9 80 43.6 1 400 42.8 63 45.1 8 . 315 43.8 2 45.6 . 42.0b ru i.: u :- '0. 8 ha 4 43.6 \ n u" an såg Ö Ö 2» .-äl W ;a an u .5.3 .8 9-a uc h U
/
U U U .N e-:o Öi -O [q u m l13 1 gp ] |3 Aa |ur q u60- F "6° - 50 50-I'_ rr_ FF_-r-r-T_ __ -oo_ "- *o 30- '- 3° 2" r . I I T T i j' 500 200 100 50 20 to 5 2
Tamm: wavelength [Im]
L5 = text. level in the 5 mm octave band Lao = text. level in the 80 mm oct. band
Unit: dB rel. 1 um rms
\ TDMA = Texture depth of macrotexture =
Texture depth calculated as the antilog of LMa
\ RMS value of profile curve
\
\ ETD = Calculated texture depth, to corre-MPD = Mean Profile Depth in mm spond to sand-patch texture depth \This table gives the same data as the
diagram below
4._ This is the full spectrum, i.e. texture ampli-tude level versus texture wavelength Vertical scale is "amplitude" in rms, but converted to logarithmic levels
(i.e. dB rel. 1 pm rms per each band). 20 dB corresponds to 0.01 mm rms and 60 dB to 1 mm rms
Elg; Typical printout of texture spectrum (diagram and corresponding table) as well as single overall values of texture depth, etc.
3.4 Calibration
Calibration of the equipment was made before and after the measurements. The
entire measuring system was calibrated by means of a disc, having a periodical triangular profile with an amplitude of 10 mm peak-to-bottom and a texture wavelength of 20 mm, which was rotated undemeath the laser with a speed equal to that during measurement. When calibrating the profile curve, the curve was ampliñed to match an RMS value of 2.887 mm which is the theoretically calculated RMS value of such a profile curve. In order to calibrate the texture spectrum, the spectrum analyzer was fed with the triangular profile signal and the attenuation of the analyzer was set (manually) so that a level of 69.1 dB was read in the 20 mm wavelength band, i.e. for the fundamental frequency component.
This level is the theoretical level of the fundamental frequency of such a profile, determined by fourier transformation of the profile signal. There are printouts of profile curve and texture spectrum in the Appendices from the triangular calibration
profile.
A test of the background noise of the system was also made. In this case, the
output signal was recorded when the car was not moving. A spectrum of this
measurement is shown in an Appendix. Note, however, that in order to bring the
spectrum into the scale, the noise spectrum has been lifted by 10 dB. It turned out that background noise was no problem other than to some extent when measuring
on the smooth aluminum panels and at the very shortest wavelengths on the smoothest surfaces.
measurements with approximately 20°C in the air and dry surfaces. The 'Measured
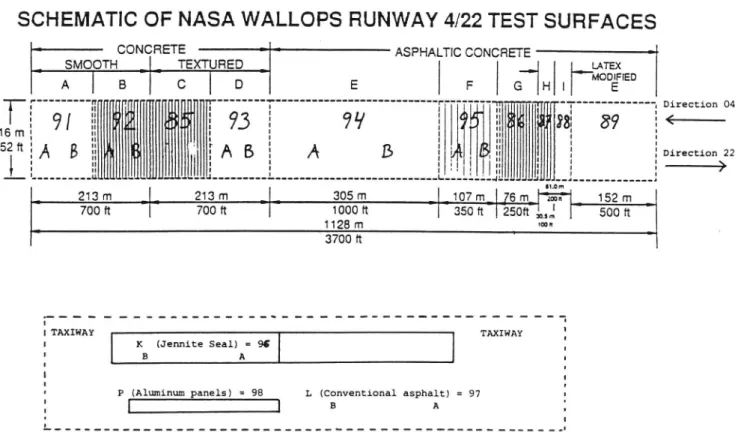
length' in Table 1 shows the length of every single measurement on that site. Site numbers refer to the numbering principles of the international experiment, in which sites 91, 92, 93, 94, 95, 96, 97 and 98 were included. The remaining sites
were given numbers in the 80's. ln parallel, there is a "NASA site designation"
which is in accordance with the site designation used by NASA, with Ietters instead
of numbers. The measurements by VTI have treated most sites in two separate sections: A and B. Basically, section A represents the first half of the site (=
measured first in the appropriate direction) and section B the second half.
The measurement by most other devices at NASA included also a site No. 99 (NASA S and S'). However, when VTI made the measurements 4 May 1993 (some days earlier than the others), this site was not considered. Consequently, VTI has no measurements on Site 99.
Ia_bl_e_1 The tested airñeld surfaces
Site NASA Site Sections Measured
No. designation tested length Type of pavement Notes about the texture
per run [m]
85 C just one 80 Same as 92 Grooves 1/4x1/4", period 1"
(and slots out in pavement)
86 G just one 40 Grooved asphalt Grooves 1/4x1/4", period 1"
concr., small aggr
87 H just one 20 Grooved asphalt Grooves 1/4x1/4", period 1"
concr., small aggr
88 I just one 20 Asphalt concrete, Medium-textured
small aggr_egate
89 E just one 80 Asphalt concrete, Medium-textured
Latex mod. small aggr_egate
91 A A and B 40+40 Canvas bett-finish Smooth-textured, ungrooved
cement concrete (but slots out in pavement)
92 B A and B 40+40 Same as 91, but Grooves 1/4x1/4", period 1"
grooved (and slots out in pavement)
93 D A and B 40+40 Burlap drag-finish Medium-textured, ungrooved
cement concrete (but slots cut in pavement)
94 E A and B 80+80 Asphalt concrete, Medium-textured
small agggggate
95 F A and B 40+40 Same as 94, but Grooves 1/4x1/4", period 2"
grooved
96 K A and B 40+40 Jennite Seal Very smooth but lots of cracks
(northern half) (not as bad as the south. half)
97 L A and B 40+40 Convent. asphalt Medium-textured
concr., med. aggr.
98 P just one 40 Aluminum panels, Metal sheets, with joints
extremely smooth between, some waviness
All measurements reported were made in the direction called 22, which is from A to
E in Fig. 3. Measurements were made also in the opposite direction (called 04) but
they are not presented in this report since friction measurements were not made in
that direction. It was noticed that texture was significantly different in the two
directions for a few of the sites (87, 88, 94), probably because they were measured in different Iateral positions with texture changing with such position.
Most sites reported here were measured with 4 runs on each. Exceptions are Sites
H and I where 2 runs were made in each direction and only direction 22 is included
here. There are also a few sites where one of the four runs had to be omitted from
the analysis, because of some problem. Sites 96-98 included 6 runs.
SCHEMATIC OF NASA WALLOPS RUNWAY 4/22 TEST SURFACES
m -Ã -4 -N m ; 3 3
: CONCRETE i ASPHALTIC CONCRETE '
SMOOTH : TEXTURED i __J LATEX
MODIFIED A B C D E F l (3 H I E 7 ' M | T i ' i 3 . Direction 04 I I " W : | | I 4 :
5 9/ : El'
5 ?3 g
99
l
:l l: Jill 38; 89
:
4_-:
i
.
.
. i
'
ll
'
:
: A B 5 Vi, \ E A B i A B i ' l i : Direction 22i
2
H E
i
' I l ::
i
5 _>
i 7 81.00! Å J213m
#1
213m
-L
305m
:107m ljöm han..
152m
700 lt 700 ft 1000 ft 350 it l 2500 lm! 500 n _ 1128 rn man 3700 ft ' ;- - - ' - - ' - ' ' - ' ' ' ' - - - - ' ' ° - ' - - ' - - - " -. l TAXIWAY TAXIWAY : l K (Jennite Seal) = 96 , ' B A a l 2 I t' P (Aluminum panels) = 98 L (Conventional asphalt) = 97 I
I 0
. [ B A ,
' I
Fig. 3 Test site locations
5. RESULTS
Table 2 presents the overall values obtained on the sites with all appropriate runs
on the same test site averaged. The 'major spacing' is the wavelength of the
third-octave-band in the texture spectrum with the maximum magnitude. This value gives an indication of the 'average' spacing between individual stones (the bigger
ones) or between grooves. The former has been found to, generally, be one
third-octave band bigger than the maximum chipping size of the test surfaces.
The average spectrum for each test site (sections A and B averaged. where
appropriate) is presented in Appendix 1. The texture spectra for each test site section are presented in Appendix 2. Appendix 3 presents the results of calibration
and background tests. Finally, Appendix 4include representative protile curves and amplitude distributions of profiles for each site.
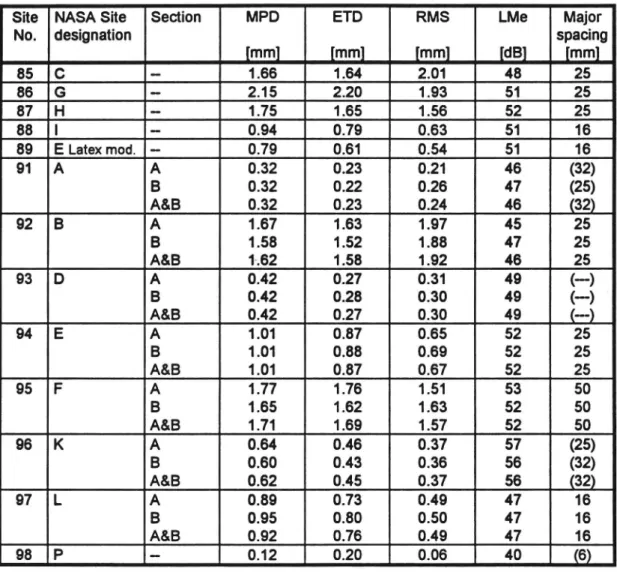
Table 2 Overall texture values obtained on the NASA test sites.
Site NASA Site Section MPD ETD RMS LMe Major
No. designation spacing
[mm] [mm] [mm] [dB] [mm] 85 C -- 1.66 1.64 2.01 48 25 86 G - 2.15 2.20 1.93 51 25 87 H - 1.75 1.65 1.56 52 25 88 I - 0.94 0.79 0.63 51 16 89 ELatexmod. - 0.79 0.61 0.54 51 16 91 A A 0.32 0.23 0.21 46 (32) B 0.32 0.22 0.26 47 (25) A&B 0.32 0.23 0.24 46 (32) 92 B A 1.67 1.63 1.97 45 25 B 1.58 1.52 1.88 47 25 A&B 1.62 1 .58 1 .92 46 25 93 D A 0.42 0.27 0.31 49 (--) B 0.42 0.28 0.30 49 (--) * A&B 0.42 0.27 0.30 49 (--) 94 E A 1.01 0.87 0.65 52 25 B 1.01 0.88 0.69 52 25 A&B 1.01 0.87 0.67 52 25 95 F A 1.77 1.76 1.51 53 50 B 1.65 1.62 1.63 52 50 A&B 1.71 1 .69 1.57 52 50 96 K A 0.64 0.46 0.37 57 (25) B 0.60 0.43 0.36 56 (32) A&B 0.62 0.45 0.37 56 (32) 97 L A 0.89 0.73 0.49 47 16 B 0.95 0.80 0.50 47 16 A&B 0.92 0.76 0.49 47 16 98 P - 0.12 0.20 0.06 40 (6) VTI NOTAT 52-94
11
Of the measures above, as a measure representing macrotexture in general, the reader is adviced to emphasize either MPD or ETD, since these measures are
subject to standardization in on-going ISO work. They have also been found to be a very good measure for describing the texture influence on friction (speed
dependence), see [PlARC, 1994].
The megatexture level, LMe is a measure which gives an idea of the "waviness" of the surfaces.
6. COMMENTS TO THE RESULTS
Major spacing:
The measurements verify very clearly the spacing between grooves. See Table 2 and each spectrum. In the spectrum, one can see not only the fundamental
wavelength, but also some harmonics. For the asphalt surfaces, the major spacing minus one third-octave band indicates the expected maximum chipping size.
However, this relies on the chippings being quite well and uniformly packed together, which is not always the case.
Megatexture:
Megatexture is rather similar on all sites except the aluminum panel (very low) and
the Jennite Seal (very high). The latter is probably caused by non-uniform spreading of the sealing material.
Macrotexture as represented by MPD and ETD:
The MPD and ETD measures are very well correlated and thus need no separate discussion. Site 98 is of course an extremely smooth surface. The major texture
recorded there is caused by the joints between the plates, see an example at the
end of Appendix 4.
-Site 91 is one of the smoothest surfaces in operation ever measured by us. It is smoother than any of the surfaces in the PIARC experiment. Surface 96 looks rather smooth by appearance, but it still has some texture. This is due partly to
some megatexture, partly to frequent cracks over the surface.
Many of the surfaces had cuts in them at certain intervals (apart from the densely-spaced grooves). The measurements here include the effects of these on macrotexture values. lf one would avoid measuring over these cuts, then the texture values would be lower.
Most sites did not differ between sections. The only site for which sections A and B seem to be slightly different is Site 95, possibly also Site 92.
Profile appearance:
The profile curves, see e.g. Site 92, display very clearly the grooves. When studying the curves, however, it shall be remembered that the laser light spot is approx. 1 mm which will average out some of the sharp corners on the curves. In principle, at each sudden drop from a high to a low level, the laser device will show
a gradual change over 1 mm rather than an immediate change. Nevertheless, the average widths and depths of the grooves can be estimated and are found to be in accordance with the nominal values.
13
Profile distribution:
The distribution of profile on a vertical scale is shown in the rightmost parts of the figures in Appendix 4. One can distinguish between two types of distribution. For the non-grooved surfaces, the distribution is mainly "normal" and symmetrical around an "average" level. The other type appears for the grooved surfaces, resulting in a skew distribution with peaks at the upper (non-grooved part) and lower levels (down in the grooves) in the profile.
7. REFERENCES
PIARC (1994): "International PIARC Experiment to Compare and Harmonize Texture and Skid Resistance Measurements". Report under preparation, from the
Permanent International Association of Road Congresses (PIARC), Paris (eds.: Wambold, J.C. and Henry, J.J.).
Sandberg, Ulf; Anund, Per, (1992): "Measurement of Macrotexture by the VTI Mobile Laser Profilometer in the PIARC International Experiment 1992". VTI Notat TF 52-20, Swedish Road and Transport Research Institute, Linköping, Sweden.
APPENDIX 1: AVERAGE TEXTURE SPECTRUM FOR EACH TEST SlTE
VTI Mobile Laser Profilometer
Texture measurement protocol
Test Site No.: 85 ( NASA C ) Spectrum-derived overall levels:
Road Section No.: Aver. of Run 1,2,3 66.2 dB(Ma) Macrotexture
Other site description: Cement concr., grooved,1" 48.1 dB(Me) Megatexture
49.2 dB(5mm) For noise pred.
Units/mm : 337 42.9 dB(80mm) For noise pred.
Texture depth values in mm : ETD: 1.64 MPD: 1.66 RMS: 2.01 TDMA: 4.49
Date of Measurement : 4 MAY 1993
Measured Distance : 80 rn
Invalid (%) : 0
Name ofReport File : NASA85.AVG
Spectmm Files : NASA85_1.SPC NASA85_2.SPC NASA85_3.SPC
Proñle Files : NASA85_1.PRO NASA85_2.PRO NASA85_3.PRO
Third-octave band spectral levels
mm dB mm dB mm dB 500 41.5 80 37.8 10 49.8 400 39.6 63 38.4 8 51.3 315 39.1 50 38.7 6.3 40.8 250 38.5 40 38.5 5 46.0 200 38.4 31.5 42.1 4 45.0 160 37.9 25 64.1 3.1 39.3 125 38.1 20 54.0 2.5 35.8 100 38.2 16 41.2 2 30.9 12.5 59.9 dB dB _ F_ _ ...3 ' _.
å
50_
F_
T_
_ 50
05'
F_
få_ _ T_f ._ 'E _r-m 40_
T_
T'
_40
3 h_- p--r-[-5 '
V_ *
3 30- F_- 30 20 l ' ' 7 f ' l u ' I I T r I I * F 20 500 200 100 50 20 10 5 2 Texture wavelength [mm]VTI Mobile Laser Profiloømeter
Texture measurement protocol
Test Site No.: 86 (NASA G ) Spectrum-derived overall levels:
Road Section No.: Aver. of Run 2, 3, 4 65.7 dB(Ma) Macrotexture
Other site description: Asph.concr., grooved, 1" 50.6 dB(Me) Megatexture
50.3 dB(5mm) For noise pred.
Units/mm : 337 48.5 dB(80mm) For noise pred.
Texture depth values in mm : ETD: 2.2 MPD: 2.15 RMS: 1.93 'I'DMAz 4.23
Date of Measurement : 4 MAY 1993
Measured Distance : 40 m
Invalid (%) : 0
Name of Report File : NASA86.AVG
Spectmm Files : NASA86_2.SPC NASA86_3.SPC NASA86_4.SPC
Proñle Files : NASA86_2.PRO NASA86_3.PRO NASA86_4.PRO
Third-octave band spectral levels
mm dB mm dB mm dB 500 39.5 80 44.2 10 48.3 400 40.3 63 44.0 8 51.5 315 41.9 50 44.5 6.3 44.4 250 40.3 40 45.2 5 46.5 200 40.8 31.5 49.0 4 45.5 160 42.6 25 63.5 3.1 40.1 125 42.8 20 50.0 2.5 36.9 100 42.8 16 48.2 2 34.1 12.5 59.2 dB dB r 60- 7._ _- 60 '-1 _ _ O
2'
50-*-
- 50 a ,_- T i_ r__
r_
1_
7_
..
: #7--F_-êâ
r_
T_
ä 40-_F- _F_- r_ - 40 2. 3_ 30- - 30 20 1 r T T T i ' l ' T I ' ' ' I ' 7 I I F * I 20 500 200 100 50 20 10 5 2 Texture wavelength [mm]17
VTI Mobile Laser Profilometer
Texture measurement protocol
Test Site No.: 87 ( NASA H) Spectrum-derived overall levels:
Road Section No.: Run 1, 3, Direction 22 63.7 dB.(Ma) Macrotexture
Other site description: Aspb. concr., grooved, 1" 51.8 dB(Me) Megatexture
48.7 dB(5mm) For noise pred.
Units/mm : 337 49.0 dB(80mm) For noise pred.
Texture depth values in mm: ETD: 1.65 MPD: 1.75 RMS: 1.56 TDMA: 3.33
Date of Measurement : 4 MAY 1993
Measured Distance : 20 m
Invalid (%) : 0
Name of Report File : NASA87.AVG
Spectrum Files : NASA87_1.SPC NASA87_3.SPC
Proñle Files : NASA87_1.PRO NASA87_3.PRO
Third-octave band spectral levels
mm dB mm dB mm dB 500 42.9 80 43.6 10 48.1 400 42.8 63 45.1 8 49.5 315 43.8 50 45.6 6.3 43.4 250 42.0 40 46.0 5 44.8 200 41.2 31.5 48.1 4 43.6 160 41.9 25 61.2 3.1 39.0 125 43.3 20 50.0 2.5 35.1 100 43.7 16 47.5 2 32.4 12.5 57.0 dB dB
60-
F_
_ 60
F_ '-1 ' _ 0 ><:E: 50_-
T
F
_50
2
l_
l_ l_
0 ._ T'- _E 40_
_40
2. T_i_
å 30- - 30 20 I 7 , T T , T . , 1 . T 1 T r , s i I . r I 1 20 500 200 100 50 20 10 5 2 Texture wavelength [mm]VTI Mobile Laser Profilometer
Texture measurement protocol
Test Site No.: 88 (NASA I) Spectrum-derived overall levels:
Road Section No.: Run l, 3 Direction 22 54.8 dB(Ma) Macrotexture
Other site description: Asph.concr., med. texture 50.8 dB(Me) Megatexture
44.1 dB(5mm) For noise pred.
Units/mm : 337 48.3 dB(80mm) For noise pred.
Texture depth values in mm : ETD: 0.786 MPD: 0.935 RMS: 0.625 TDMA: 1.07
Date of Measurement : 4 MAY 1993
Mcasured Distance : 20 m
Invalid (%) : 0
Name of Report File : NASA88.AVG
Spectrum Files : NASA88_1.SPC NASA88_3.SPC
Proñle Files : NASA88_1.PRO NASA88_3.PRO
Third-octave band spectral levels
mm dB mm dB mm dB 500 42.6 80 42.9 10 43.6 400 40.4 63 44.4 8 42.8 315 41.4 50 44.2 6.3 41.2 250 41.0 40 45.1 5 38.8 200 40.8 31.5 45.5 4 36.9 160 41.7 25 45.8 3.1 34.2 125 42.3 20 45.3 2.5 31.3 100 43.0 16 45.7 2 29.1 12.5 45.0 dB dB 60- - 60 *i 'i ._ O ><
g 50_-
_. 50
'i
a -'-'Ei
w-
l-_,_. l_-F
hl_
3 40- r- r 7-_ - 403 30_
T_- 30
20 r r T T r 1 T I 1 W T I u* T I 20 500 200 100 50 20 10 5 2 Texture wavelength [mm]19
VTI Moblle Laser Profilometer
Texture measurement protocol
Test Site No.: 89 ( NASA E Latex mod) Spectrum-derived overall levels:
Road Section No.: Run 2,3,4 53.5 dB(Ma) Macrotexture
Other site description: Asph.concr., latex mod 50.8 dB(Me) Megatexture
43.4 dB(5mm) For noise pred.
Units/mm : 337 46.1 dB(80mm) For noise pred.
Texture depth values in mm: ETD: 0.613 MPD: 0.788 RMS: 0.539 TDMA: 0.894
Date of Measurement : 4 MAY 1993
Measured Distance . 80 m
Invalid (%) : 0
Name of Report File : NASA89.AVG
Spectrum Files : NASA89_2.SPC NASA89_3.SPC NASA89_4.SPC
Proñle Files : NASA89_2.PRO NASA89_3.PRO NASA89_4.PRO
Third-octave band spectral levels
mm dB mm dB mm dB 500 44.9 80 41.2 10 42.6 400 44.3 63 41.9 8 41.9 315 41.5 50 42.8 6.3 40.3 250 40.2 40 42.9 5 38.2 200 38.9 31.5 43.9 4 36.5 160 39.1 25 44.2 3.1 34.3 125 40.3 20 44.0 2.5 31.6 100 40.8 16 44.4 2 29.8 12.5 43.9 dB dB 60- - 60 ...1 ' _ 0 x
g 50_
_50
8' < 2 q_ __ _..
r--r-§5
T
?-
F_
T??
,1 40- r--I-T_ _ _40.a
-- _TT_
_-
[-_-S
T_
_å_ 30-
fr_- 30
20I 7,,rTñ.j1,vl,.,wrl,,.,20 500 200 100 50 20 10 5 2 Texture wavelength [mm]VTI Mobile Laser Proñlometer
Texture measurement protoeol
Test Site No.: 91 ( NASA A ) Spectrum-derived overall levels:
Road Section No.: Aver. of Sections A & B 46.7 dB(Ma) Macrotexture
Other site description: Cement concrete, smooth 46.1 dB(Me) Megatexture
35.5 dB(Smm) For noise pred.
Units/mm : 337 41.4 dB(SOmm) For noise pred.
Texture depth values in mm : ETD: 0.225 MPD: 0.318 RMS: 0.236 TDMA: 0.299
Date of Measurement : 4 MAY 1993
Measured Distance : 40 m
Invalid (%) : 0
Name of Report File : NASA91.AVG
Spectmm Files - mun/um Wim WMJSPC mun/unc Wimspc W9lem Wimspc NASA9|B45PC
Profile Files ' WIMHO WlALPRO mamma mun/uno mamma WIRLPRO Wimno Wimmo
Third-octave band spectral levels
mm dB mm dB mm dB 500 38.4 80 36.4 10 34.7 400 38.1 63 37.1 8 33.0 315 37.8 50 37.4 6.3 31.2 250 37.1 40 37.3 5 30.6 200 36.6 31.5 37.8 4 30.2 160 35.7 25 37.7 3.1 27.9 125 36.2 20 37.3 2.5 25.9 100 36.2 16 37.0 2 23.0 12.5 36.3 dB dB 60- - 60 '-l '" _ o ><
g 50_
- 50
5' < :1 _ __'ä-
?L 40-__
i
_ 40
g- rr_ T
*-
-3 -30_
T'
_ 30
20 I ' ' I ' i l ' l ' ' ' l ä ' r ' ' l * T I 20 500 200 100 50 20 10 5 2 Texture wavelength [mm]21
VTI Mobile Laser Proñlometer
Texture measurement protocol
Spectrum-derived overall levels:
Test Site No.: 92 ( NASA B )
Road Section No.: Aver. of Sections A & B 65.7 dBCMa) Macrotexture
Other site description: Cement concr., grooved,l" 45.9 dB(Me) Megatexture
49.0 dB(5mm) For noise pred.
Units/mm : 337 41.3 dB(80mm) For noise pred.
Texture depth values in mm : ETD: 1.58 MPD: 1.62 RMS: 1.92 TDMA: 4.22_
Date of Measurement : 4 MAY 1993
Measured Distance : 40 m
Invalid (%) : 0
Name of Report File : NASA92.AVG
Spectmm Files ; mmm mmm marc mac mmm man msn msec
Profile Files - WHO WO WHO NASADZMJRO NAMDZBIPRO mmo NWPRO WPRO
Third-octave band spectral levels
mm dB mm dB mm dB 500 36.9 80 36.0 10 49.2 400 37.8 63 37.0 8 50.4 315 36.2 50 37.6 6.3 41.1 250 37.0 40 38.5 5 45.9 200 37.1 31.5 42.5 4 44.5 160 37.1 25 63.6 3.1 38.3 125 36.5 20 53.7 2.5 35.3 100 36.3 16 41.6 2 30.4 12.5 59.2 dB dB h 60- F_ _60 __3 _ _
ä
50-T_
-50g
r-T
0?i
-
7_
-'EF"-23 40_
T_
T_
_40
2. 7-_ r'-. _f_- _-g .. r_ _ r-3 r-30- r--3020 ,
T , 4 T I ,
, v , j , , , T i 1 , , , T ,
20
500 200 100 50 20 10 5 2 Texture wavelength [mm]VTI Mobile Laser Profilometer
Texture measurement protoeol
Test Site No.: 93 (NASA D ) Spectrum-derived overall levels:
Road Section No.: Aver. of Sections A & B 46.9 dBCMa) Macrotexture
Other site description: Cement concr. burlap drag 49.1 dB(Me) Megatexture
35.9 dB(5mm) For noise pred.
Units/mm : 337 44.2 dB(80mm) For noise pred.
Texture depth values in mm : ETD: 0.274 MPD: 0.42 RMS: 0.302 TDMA: 0.309
Date of Measurement : 4 MAY 1993
Measured Distance : 40 m
Invalid 0%)
: 0
Name of Report File : NASA93.AVG
Spectmm Files ; mmm mms/um mms/om mmm mmm mazsrc mmm mmm
Profile Filcs ' man no mama wanna mumo wanna maamo mamma mammo
Third-octave band spectral levels
mm dB mm dB mm dB 500 41.0 80 39.4 10 33.9 400 40.4 63 39.5 8 33.2 315 39.9 50 39.1 6.3 32.4 250 39.9 40 37.9 5 30.8 200 39.6 31.5 37.8 4 29.8 160 39.7 25 37.5 3.1 27.8 125 40.2 20 37.2 2.5 "25.3 100 39.6 16 36.9 2 23.2 12.5 35.6 dB dB 60- - 60 '-3 '- L-§3
g 50_
_ 50
F < 9_ .. _E
40-_" r- - 40i
7
r_
__
'ä' 1 [_7- _ å 30- _ 30 20 l ' ' l ' ' I ' l ' T ' I ' ' I l T 20 500 200 100 50 20 10 5 2 Texture wavelength [mm]23
VTI Mobile Laser Profilometer
Texture measurement protocol
Test Site No.: 94 (NASA E ) Spectrum-derived overall levels:
Road Section No.: Aver. of Sections A & B 55.1 dB(Ma) Macrotexture
Other site description: Asph. concr., med. texture 52.1 dB(Me) Megatexture
44.1 dB(Smm) For noise pred.
Units/mm : 337 48.9 dB(80mm) For noise pred.
Texture depth values in mm : ETD: 0.873 MPD: 1.01 RMS: 0.666 TDMA: 1.11
Date of Measurement : 4 MAY 1993
Measured Distance : 80 m
Invalid (%) : 0
Name of Report File : NASA94.AVG
Spectmm Files - WALSPC mm mmm mmm mmm WBZSPC mmm WMSPC
Profile Files 0 mmno mama mama mumo wanna memo WBJPRO mama
Third-octave band spectral levels
mm dB mm dB mm dB 500 44.0 80 44.0 10 43.7 400 43.2 63 44.6 8 42.8 315 42.5 50 45.0 6.3 41.2 250 42.4 40 45.5 5 38.9 200 42.3 31.5 46.0 4 37.0 160 42.7 25 46.1 3.1 34.4 125 43.0 20 45.6 2.5 31.3 100 43.7 16 45.6 2 28.7 12.5 44.9 dB dB 60- - 60 H _ _ 0 :r:
E 50_-
-- 50
<7 å _-u-n " F'-'-_.
a.
_2-
-T
r-r'-
(-
l_-
Vf
E 40_
F_
_40
2. T3 30_
- _ 30
F__ 20 , , f f j T T , 1 r , 1 . , . I I 1 r , 1 T 20 500 200 100 50 20 10 5 2 Texture wavelength [mm]VTI Mobile Laser Profilometer
Texture measurement protocol
Texture wavelength [mm]
Test Site No.: 95 ( NASA F) Spectnnn-derived overall levels:
Road Section No.: Aver. of Sections A & B 63.8 dBCMa) Macrotexture
Other site description: Asph. concr., grooved, 2" 52.4 dB(Me) Megatexture
48.0 dB(5mm) For noise pred.
Units/mm : 337 50.0 dB(80mm) For noise pred.
Texture depth values in mm : ETD: 1.69 MPD: 1.71 RMS: 1.57 TDMA: 3.37
Date of Measurement : 4 MAY 1993
Measured Distance : 40 m
Invalid (%) : 0
Name of Report File : NASA95.AVG
Spectmm Files - WSAlsPc msnspc mmost mmsusrc WSBISPC Wsazspc WSmÅPC massage
Profile Files 3 NMS/uno mama msnmo NMS/uno msmno mmmo mansno W384er
Third-octave band spectral levels
mm dB mm dB mm dB 500 43.2 80 44.8 10 50.8 400 43.1 63 46.2 8 47.5 315 42.5 50 58.7 6.3 43.4 250 42.8 40 48.7 5 43.3 200 43.1 31.5 47.3 4 42.9 160 43.4 25 57.6 3.1 38.3 125 44.2 20 49.2 2.5 35.4 100 44.3 16 56.0 2 32.9 12.5 53.6 dB dB 60- r_ - 60 r_ '-i " .. 0 F' :4
g 50_-
__
__
_
- 50
5"' __?2. -
E
T
-2
-TV-5? 40_-
-40
2. 3 30- - 30 20 l Y 1 ' ' l ' ' l r a r 1 1 * I 20 500 200 100 50 20 10 5 225
VTI Mobile Laser Profilometer
Texture measurement protocol
Texture wavelength [mm]
Test Site No.: 96 ( NASA K) Spectrum-derived overall levels:
Road Section No.: Aver. of Section A & B 47.6 dB(Ma) Macrotexture
Other site description: Jennite Seal 56.4 dB(Me) Megatexture
36.1 dB(5mm) For noise pred.
Units/mm : 337 43.5 dB(80mm) For noise pred.
Texture depth values in mm : ETD: 0.445 MPD: 0.622 RMS: 0.368 TDMA: 0.353
Date of Measurement : 4 MAY 1993
Measured Distance : 40 m
Invalid (Va) : 0
Name of Report File : NASA96.AVG
Spectrum Files : NASA96A.SPC NASA968.SPC
Proñle Files : NASA96A.PRO NASA9GB.PRO
Third-octave band spectral levels
mm dB mm dB mm dB 500 49.8 80 38.3 10 35.9 400 50.3 63 38.6 8 34.7 315 48.8 50 38.5 6.3 33.1 250 48.7 40 38.4 5 30.8 200 46.6 31.5 38.6 4 29.3 160 43.5 25 38.5 3.1 27.6 125 40.8 20 38.1 2.5 25.7 100 39.2 16 37.8 2 24.1 12.5 37.1 dB dB 60- - 60 '-1 d .. 0 <
å 50__h
_- 50
8'a -
i_
6
'E
F_
5' 40-
*f
_40
0 7-.. .- r_-g _ [- ' å 30- - 30 20 1 7 ' l F 1 r i l 1 T * T ' ' l ' * T I 20 500 200 100 50 20 10 5 2VTI Mobile Laser Profilometer
Texture measurement protocol
Test Site No.: 97 ( NASA L ) Spectrum-derived overall levels:
Road Section No.: Aver. of Section A & B 53.0 dB(Ma) Macrotexture
Other site description: Asph.concr., med.texture 47.2 dB(Me) Megatexture
43.4 dB(Smm) For noise pred.
Units/mm : 337 45.4 dB(80mm) For noise pred.
Texture depth values in mm : E'I'D: 0.763 MPD: 0.917 RMS: 0.492 TDMA: 0.824
Date ofMeasurement : 4 MAY 1993
Measured Distance : 40 m
Invalid (%) : 0
Name of Report File : NASA97 .AVG
Spectrum Files : NASA97A.SPC NASA97B.SPC
Proñle Files : NASA97A.PRO NASA97B.PRO
Third-octave band spectral levels
mm dB mm dB mm dB 500 38.9 80 40.5 10 42.7 400 37.6 63 41.4 8 42.1 315 36.2 50 41.9 6.3 40.5 250 37.2 40 42.3 5 38.2 200 37.5 31.5 42.9 4 35.9 160 37.9 25 43.4 3.1 32.7 125 39.0 20 43.2 2.5 29.0 100 40.0 16 43.6 2 25.8 12.5 43.4 dB dB 60- _ 60 '-1 ' p 0 x
få 50_
_ 50
5 < 2 - -E _f*_F_r_-Tr-E 40-_
__ _T_ r
r-
_40
5_ 30- - 30 20 I I T T 1 I I 1 I 1 *6 I I l' T I j' j T 500 200 100 50 20 10 5 2 Texture wavelength [mm]27
VTI Mobile Laser Profilometer
Texture measurement protocol
Test Site No.: 98 ( NASA P) Spectrum-derived overall levels:
Road Section No.: Run 1,2,3,4,5,6 35.2 dB(Ma) Macrotexture
Other site description: Aluminum panels 40.2 dB(Me) Megatexture
29.3 dB(5mm) For noise pred.
Units/mm : 337 30.3 dB(80mm) For noise pred.
MPD: 0.123 RMS: 0.0597 TDMA: -0.0669
Texture depth values in mm : ETD: 0.2 Date of Measurement : 4 MAY 1993
Measured Distance : 40 m
Invalid (%) : 0
Name of Report File : NASA98.AVG
Spectrum Files : NASA98_1.SPC NASA98_2.SPC NASA98_3.SPC NASA98_4.SPC NASA98_5.SPC NASA98_6.SPC
Proñle Files : NASA98_1.PRO NASA98_2.PRO NASA98_3.PRO NASA98_4.PRO NASA98_5.PRO NASA98_6.PRO
Third-octave band spectral levels
mm dB mm dB mm dB 500 34.8 80 25.0 10 24.2 400 34.0 63 24.6 8 24.8 315 30.9 50 23.8 6.3 24.9 250 30.7 40 23.1 5 24.5 200 29.8 31.5 23.2 4 24.2 160 28.5 25 23.2 3.1 23.4 125 27.5 20 23.2 2.5 21.6 100 26.6 16 23.8 2 19.9 12.5 24.1 dB dB 60- _- 60 i-l " _ 0 x
g 50_
_50
5' < g ._ .. .ä ?L 40- -405
r
å 30- -3020 ,
f j r T r r i i , , , , 1 r , I i 1
,
20
500 200 100 50 20 10 5 2 Texture wavelength [mm]APPENDIX 2: TEXTURE SPECTRUM FOR EACH INDIVlDUAL SECTION
29
VTI Mobile Laser Proñlometer
Texture measurement protocol
Test Site No.: 91 ( NASA A) Spectrum-derived overall levels:
Road Section No.: Section A, Run l,2,3,4 45.2 dB(Ma) Macrotexture
Other site description: 45.5 dB(Me) Megatexture
34.7 dB(5mm) For noise pred.
Units/mm : 337 40.5 dB(80mm) For noise pred.
Texture depth values in mm: ETD: 0.227 MPD: 0.319 RMS: 0.212 TDMA: 0.218
Date of Measurement : 20 APR 1994
Measured Distance : 40 m
Invalid (%) : 0
Name of Report File : NASA91A.AVG
Spectrum Files : NASA91A1.SPC NASA91A2.SPC NASA91A3.SPC NASA91A4.SPC
Proñle Files : NASA91A1.PRO NASA91A2.PRO NASA91A3.PRO NASA91A4.PRO
Third-octave band spectral levels
mm dB mm dB mm dB 500 38.3 80 35.6 10 32.7 400 38.3 63 36.1 8 31.7 315 36.5 50 36.3 6.3 30.7 250 35.8 40 36.3 5 29.6 200 35.8 31.5 36.5 4 29.4 160 35.0 25 36.1 3.1 27.7 125 35.4 20 35.3 2.5 25.3 100 35.6 16 34.6 2 22.7 12.5 33.8 dB dB 60- - 60 __1 _ __ 0 x
E 50_
_50
5' < a ... ...'å
?i 40_
__ 40
0-A d fr_- '__ F-r__-5
r_
å 30-
7_
- 30
20 l T 7 r T i l * f l l ' j T T T I i l l ' ' ' l 500 200 100 50 20 10 5 2 Texture wavelength [mm]VTI Mobile Laser Profilorneter
Texture measurement protocol
Test Site No.: 91 ( NASA A ) Spectrum-derived overall levels:
Road Section No.: Section B, Run l,2,3,4 47.9 dB(Ma) Macrotexture
Other site description: 46.7 dB(Me) Megatexture
36.1 dB(5mm) For noise pred.
Units/mm : 337 42.1 dB(80mm) For noise pred.
Texture depth values in mm : ETD: 0.223 MPD: 0.317 RMS: 0.259 TDMA: 0.369
Date of Measurement : 20 APR 1994
Measured Distance : 40 m
Invalid (%) : 0
Name of Report File : NASA91B.AVG
Spectrum Files : NASA9 lBl.SPC NASA9IBZ.SPC NASA91B3.SPC NASA91B4.SPC
Proñle Files : NASA91B1.PRO NASA9IBZ.PRO NASA91B3.PRO NASA91B4.PRO
Third-octave band spectral levels
mm dB mm dB mm dB 500 38.5 80 37.1 10 36.1 400 37.9 63 38.0 8 34.0 315 38.8 50 38.2 6.3 31.6 250 38.0 40 38.2 5 31.3 200 37.3 31.5 38.7 4 30.9 160 36.3 25 38.9 3.1 28.1 125 36.9 20 38.7 2.5 26.5 100 36.7 16 38.6 2 23.3 12.5 37.9 dB dB 60- _ 60 ...1 _ 0 <
g 50_
_50
5' < 9;_ ._ ._ ,EE? 40_
_40
2. _FJ_- [_- r_ ;a _ T Tr_- _5
r-3 r-30-
77-_
_- 30
20 I r r , I I I , 1 r , , I 7 I i T f 20 500 200 100 50 20 10 5 2 Texture wavelength [mm]31
VTI Mobile Laser Proñlometer
Texture measurement protocol
Test Site No.: 92 ( NASA B ) Spectrum-derived overall levels:
Road Section No.: Section A, Run 1,2,3,4 66.0 dB(Ma) Macrotexture
Other site description: 45.1 dB(Me) Megatexture
49.2 dB(5mm) For noise pred.
Units/mm : 337 40.8 dB(80mm) For noise pred.
Texture depth values in mm : ETD: 1.63 MPD: 1.67 RMS: 1.97 TDMA: 4.41
Date of Measurement : 20 APR 1994
Measured Distance : 40 m
Invalid (%) : 0
Name of Report File : NASA92A.AVG
Spectrum Files : NASA92A1.SPC NASA92A2.SPC NASA92A3.SPC NASA92A4.SPC
Proñle Files : NASA92A1.PRO NASA92A2.PRO NASA92A3.PRO NASA92A4.PRO
Third-octave band spectral levels
mm dB mm dB mm dB 500 36.4 80 35.6 10 49.7 400 36.9 63 36.7 8 50.6 315 35.4 50 37.4 6.3 41.0 250 36.2 40 38.6 5 46.3 200 36.1 31.5 41.7 4 44.7 160 36.0 25 64.0 3.1 37.9 125 35.8 20 54.1 2.5 35.3 100 35.8 16 40.8 2 29.5 12.5 59.6 dB dB [_ 60-- T_ _ 60
8"]
<-
F_
F
E 50_
[_r-
_- 50
(T < _-9_ .4 ....
l_
Q _-27 40._ T T -40 52. [-g ___TT' [_r-- _ 3 30- _- 30 20 I T 1' 7 Y I I [ T 1 T I 7 T I I I 7 j 7 I 500 200 100 50 20 10 5 2 Texture wavelength [mm]VTI Mobile Laser Profilometer
Texture measurement protocol
Test Site No.: 92 (NASA B ) Spectrum-derived overall levels:
Road Section No.: Section B, Run l,2,3,4 65.3 dB(Ma) Macrotexture
Other site description: 46.6 dB(Me) Megatexture
48.8 dB(5mm) For noise pred.
Units/mm : 337 41.6 dB(80mm) For noise pred.
Texture depth values in mm : ETD: 1.52 MPD: 1.58 RMS: 1.88 TDMA: 4.01
Date of Measurement : 20 APR 1994
Measured Distance 40 m
Invalid (%) : 0
Name of Report File : NASA92B.AVG
Spectrum Files : NASA9ZBI.SPC NASA92B2.SPC NASA92B3.SPC NASA92B4.SPC
Proñle Files : NASA92B1.PRO NASA92B2.PRO NASA9ZB3.PRO NASA9ZB4.PRO
Third-octave band spectral levels
mm dB mm dB mm dB 500 37.4 80 36.4 10 48.7 400 38.5 63 37.3 8 50.2 315 36.9 50 37.8 6.3 41.3 250 37.6 40 38.4 5 45.6 200 37.9 31.5 43.1 4 44.3 160 37.9 25 63.2' 3.1 38.6 125 37.0 20 53.4 2.5 35.4 100 36.8 16 42.2 2 31.1 12.5 58.7 dB dB F_ 60- F_ _ 60 ._1 _ _ 0 _. :z
g 50_-
r-
_- 50
av
V
ä
_
r
_
3 #- FS? 40_
7_
-40
0 F_- F_-:- __ __7- _F___7-g -
r
"- *
3 30- F_- 30 20 I ' l T e r ' T I ' ' ' l * l ' ' I * T T 20 500 200 100 50 20 10 5 2 Texture wavelength [mm]33
VTI Mobile Laser Profilometer
Texture measurement protocol
Test Site No.: 93 (NASA D ) Spectrum-derived overall levels:
Road Section No.: Section A, Run 1,2,3,4 47.1 dB(Ma) Macrotexture
Other site description: 48.9 dB(Me) Megatexture
36.1 dB(Smm) For noise pred.
Units/mm : 337 43.5 dB(80mm) For noise pred.
Texture depth values in mm : ETD: 0.272 MPD: 0.416 RMS: 0.306 TDMA: 0.322
Date of Measurement : 20 APR 1994 Measured Distance : 40m
Invalid (%) : 0
Name of Report File : NASA93A.AVG
Spectrum Files : NASA93A1.SPC NASA93A2.SPC NASA93A3.SPC NASA93A4.SPC
Profile Files : NASA93A1.PRO NASA93A2.PRO NASA93A3.PRO NASA93A4.PRO
Third-octave band spectral levels
mm dB mm dB mm dB 500 41.6 80 38.7 10 33.3 400 40.9 63 38.9 8 33.0 315 40.4 50 38.9 6.3 32.8 250 39.6 40 38.0 5 30.7 200 39.2 31.5 38.3 4 29.9 160 39.1 25 38.3 3.1 28.0 125 39.0 20 37.9 2.5 25.9 100 38.4 16 37.0 2 23.9 12.5 35.4 dB dB 60- -60 '-l " _ 0 ><
g 50_
_50
:T < (i _ _ 'gl _.._ 3 40- 77-1_ _P_- -40:5 -
1_
F;
_
3
TB?"
_.,L 30- -30 20 r r , , . , I I T T . . r 1 , T I 20 500 200 100 50 20 10 5 2 Texture wavelength [mm]VTI Mobile Laser Profilometer
Texture measurement protocol
Test Site No.: 93 (NASA D ) Spectrum-derived overall levels:
Road Section No.: Section B, Run 1,2,3,4 46.7 dB(Ma) Macrotexture
Other site description: 49.2 dBCMe) Megatexture
35.7 dB(5mm) For noise pred.
Units/mm : 337 44.9 dB(80mm) For noise pred.
Texture depth values in mm: ETD: 0.275 MPD: 0.424 RMS: 0.298 TDMA: 0.297
Date ofMeasurement : 20 APR 1994
Measured Distance : 40 m
Invalid (%) : 0
Name of Report File : NASA93B.AVG
Spectmm Files : NASA9BBI.SPC NASA93B2.SPC NASA93B3.SPC NASA93B4.SPC
Profile Files : NASA93B1.PRO NASA93B2.PRO NASA93B3.PRO NASA93B4.PRO
Third-octave band spectral levels
mm dB mm dB mm dB 500 40.2 80 40.0 10 34.4 400 39.9 63 40.0 8 33.4 315 39.4 50 39.3 6.3 31.9 250 40.2 40 37.8 5 30.8 200 40.0 31.5 37.2 4 29.8 160 40.3 25 36.5 3.1 27.7 125 41.1 20 36.4 2.5 24.7 100 40.5 16 36.7 2 22.4 12.5 35.9 dB dB 60- - 60 __l _ _ 0 x
g 50-
_50
5" < 2. .. ...E
3 40 rh_r--T'._..
r__ -- 405
P-*_
_Q_ 30_
F_
__ 30
20 I I 1 1 I I I 7 I I 1 7 I i 1 r I F I 500 200 100 50 20 10 5 2 Texture wavelength [mm]35
VTI Mobile Laser Profilometer
Texture measurement protocol
Test Site No.: _ 94 (NASA E) Spectrum-derived overall levels:
Road Section No.: Section A, Run 1,2,3,4 54.9 dB(Ma) Macrotexture
Other site description: 52.1 dB(Me) Megatexture
43.9 dB(5mm) For noise pred.
Units/mm : 337 48.4 dB(80mm) For noise pred.
Texture depth values in mm : ETD: 0.872 MPD: 1.01 RMS: 0.646 TDMA: 1.07
Date of Measurement : 20 APR 1994
Measured Distance : 80 m
Invalid (V.) : 0
Name of Report File : NASA94A.AVG
Spectrum Files : NASA94A1.SPC NASA94A2.SPC NASA94A3.SPC NASA94A4.SPC
Profile Files : NASA94A1.PRO NASA94A2.PRO NASA94A3.PRO NASA94A4.PRO
Third-octave band spectral levels
mm dB mm dB mm dB 500 44.4 80 43.6 10 43.5 400 43.9 63 44.2 8 42.6 315 43.2 50 44.7 6.3 41.0 250 42.3 40 45.2 5 38.6 200 42.0 31.5 45.8 4 36.7 160 42.3 25 45.9 3.1 33.9 125 42.6 20 45.4 2.5 30.6 100 43.0 16 45.4 2 27.7 12.5 44.7 dB dB 60- - 60 '-1 " _ 0 x
§ 50-
_ 50
'5':s _
F_
_
0-- ..____. I_-
rr
r-TF_
r--r-r*
r
§ 40- TV_ FF -40 0F_-2..
r*
3 30_ - 30 20 I T T T 1 T 1 T T T 1 | I I I *Ii T I' är t I 500 200 100 50 20 10 5 2 Texture wavelength [mm]VTI Mobile Laser Profilometer
Texture measurement protoeol
Test Site No.: 94 (NASA E ) Spectrum-derived overall levels:
Road Section No.: Section B, Run l,2,3,4 55.3 dB(Ma) Macrotexture
Other site description: 52.0 dB(Me) Megatexture
44.4 dB(5mm) For noise pred.
Units/mm : 337 49.3 dB(80mm) For noise pred.
Texturedepthvaluesinmm: ETD: 0.875 MPD: 1.01 RMS: 0.686 TDMA: 1.14
Date of Measurement : 20 APR 1994
Measured Distance : 80 m
Invalid (Yo) : 0
Name of Report File : NASA94B.AVG
Spectrum Files : NASA94B1.SPC NASA94B2.SPC NASA94B3.SPC NASA94B4.SPC
Proñle Files : NASA94B1.PRO NASA94BZ.PRO NASA94B3.PRO NASA94B4.PRO
Third-octave band spectral levels
mm dB mm dB mm dB 500 43.6 80 44.3 10 43.8 400 42.4 63 45.0 8 43.0 315 41.6 50 45.3 6.3 41.4 250 42.6 40 45.7 5 39.1 200 42.6 31.5 46.3 4 37.3 160 43.1 25 46.3 3.1 34.9 125 43.4 20 45.8 2.5 31.9 100 44.3 16 45.8 2 29.5 12.5 45.0 dB 60- -60 ...1 ' _ 0 g 50- _50 '5'
:i
_
Tr-
_.
'a
51 40-
__r_
T
TV?
F_
_40
2. F å 30- T_- 30 20 I ' T T 7 ' ' I ' ' 1 T ' j I ' f l 7 r I 500 200 100 50 20 10 5 2 Texture wavelength [mm]37
VTI Mobile Laser Profilometer
Texture measurement protocol
Test Site No.: 95 ( NASA F) Spectrum-derived overall levels:
Road Section No.: Section A, Run l,2,3,4 63.3 dB(Ma) Macrotexture
Other site description: 53.2 dBCMe) Megatexture
47.8 dB(5mm) For noise pred.
Units/mm : 337 50.7 dB(80mm) For noise pred.
Texture depth values in mm : ETD: 1.76 MPD: 1.77 RMS: 1.51 _ TDMA: 3.18
Date ofMeasurement : 20 APR 1994
Measured Distance : 40 m
Invalid (%) : 0
Name of Report File : NASA95A.AVG
Spectrum Files : NASA95A1.SPC NASA95A2.SPC NASA95A3.SPC NASA95A4.SPC
Profile Files : NASA95A1.PRO NASA95A2.PRO NASA95A3.PRO NASA95A4.PRO
Third-octave band spectral levels
mm dB mm (18 mm dB 500 43.4 80 45.5 10 50.2 400 43.8 63 46.9 8 47.0 315 43.1 50 58.2 6.3 43.5 250 43.7 40 49.5 5 43.0 200 44.0 31.5 48.0 4 42.5 160 44.3 25 57.0 3.1 38.3 125 45.1 20 49.4 2.5 35.4 100 45.1 16 55.3 2 33.1 12.5 52.9 dB dB 60- - 60 7_ r_ ...1 " _
å
Th
2. 50- r__ r_ - - 50g
_
r_
F_
7-
_
'az
__F'F_l_
får
5' 40_
.-40
O'2
i
a
l_
_2_ 30- -30 20 1 f * T ' 1 ä 1 T I 1 T I I 20 500 200 100 50 20 10 5 2 Texture wavelength [mm]VTI Mobile Laser Profilometer
Texture measurement protocol
Test Site No.: 95 (NASA F) Spectrum-derived overall levels:
Road Section No.: Section B, Run 1,2,3,4 64.2 dB(Ma) Macrotexture
Other site description: 51.5 dB(Me) Megatexture
48.1 dB(Smm) For noise pred.
Texture wavelength [mm]
Units/mm : 337 49.1 dB(80mm) For noise pred.
Texture depth values in mm: ETD: 1.62 MPD: 1.65 RMS: 1.63 TDMA: 3.55
Date of Measurement : 20 APR 1994
Measured Distance : 40 m
Invalid (Vu) : 0
Name of Report File : NASA95B.AVG
Spectrum Files : NASA9SBl.SPC NASA95B2.SPC NASA9583.SPC NASA95B4.SPC
Proñle Files : NASA9SBI.PRO NASA95B2.PRO NASA9SB3.PRO NASA95B4.PRO
Third-octave band spectral levels
mm dB mm dB mm dB 500 43.1 80 44.1 10 51.3 400 42.3 63 45.3 8 47.9 315 41.8 50 59.2 6.3 43.2 250 41.5 40 47.7 5 43.7 200 42.0 31.5 46.4 4 43.2 160 42.4 25 58.1 3.1 38.2 125 43.2 20 48.9 2.5 35.5 100 43.4 16 56.6 2 32.8 12.5 54.2 dB dB 60- - 60 F-_' T
.4 A
T_
_
0 :ng 50_
__
F_
- 50
5' F'- 1""<3. -
r-
r-
-'a
_r-___._F-_F' l_
J-23 40-
-40
2. E _ F_ .. _g_ 30- - 30 20 T ' ' j ' r 1 i 1 T I I I 20 500 200 100 50 20 10 5 239
Test Site No.: Road Section No.: Other site description: Units/mm :
VTI Mobile Laser Profilometer
Texture measurement protocol
96 ( NASA K ) Spectrum-derived overall levels:
Section B, Run l,2,3,4,5,6 47.7 dBCMa) Macrotexture
A 56.8 dBCMe) Megatexture
36.5 dB(5mm) For noise pred.
337 43.4 dB(80mm) For noise pred.
Texture depth values inmm: ETD: 0.464 MPD: 0.641 RMS: 0.373 TDMA: 0.359
Date ofMeasurement : 20 APR 1994
Measured Distance : 40 m
Invalid (%) : 0
Name of Report File : NASA96B.AVG
SW Flles 3 NASA9GBI.SPC NASA96BZSPC NASA96B3.SPC NASA9684.SPC NASA9GBS.SPC NASA9686.SPC Pmñle Files 3 NASA9GBI.PRO NASA9632.PRO NASA9683.PRO NASA9GB4.PRO NASA96B5.PRO NASA96B6.PRO
Third-octave band spectral levels
mm dB mm dB mm dB 500 49.8 80 38.2 10 36.3 400 51.1 63 38.3 8 35.1 315 49.0 50 38.4 6.3 33.5 250 49.2 40 38.2 5 31.1 200 46.7 31.5 38.5 4 29.6 160 43.8 25 38.6 3.1 27.8 125 40.8 20 38.2 2.5 25.7 100 39.2 16 37.9 2 24.0 12.5 37.4 dB dB 60- - 60 ._1 _ _ 0
§
50-..- - 5051.
TFT_
0<3. -
l_
-e
3_
40_
7'
Tr-
_
_40
L..
TF"E
å 30-
7_
_30
20 I .
T , . . I . r , , 1 1 , r . , 1 4 7 7 *4 r ,
20
500 200 100 50 20 10 5 2 Texture wavelength [mm]VTI Mobile Laser Profiloømeter
Texture measurement protocol
Texture wavelength [mm]
Test Site No.: 96 ( NASA K) Spectrum-derived overall levels:
Road Section No.: Section Il, Run 1,2,3,4,5,6 47.5 dB(Ma) Macrotexture
Other site description: 13 56.1 dB(Me) Megatexture
35.7 dB(Smm) For noise pred.
Units/mm : 337 43.6 dB(80mm) For noise pred.
Texture depth values in mm : ETD: 0.426 MPD: 0.604 RMS: 0.364 TDMA: 0.347
Date of Measurement : 20 APR 1994
Measured Distance : 40 m
Invalid (%) : 0
Name of Report File : NASA96A.AVG
Spectrum Files : NASA96A1.SPC NASA96A2.SPC NASA96A3.SPC NASA96A4.SPC
Proñle Files : NASA96A1.PRO NASA96A2.PRO NASA96A3.PRO NASA96A4.PRO
Third-octave band spectral levels
mm dB mm ([8 mm dB 500 49.8 80 38.4 10 35.5 400 49.3 63 38.9 8 34.3 315 48.6 50 38.6 6.3 32.7 250 48.1 40 38.6 5 30.4 200 46.4 31.5 38.7 4 28.9 160 43.2 25 38.4 3.1 27.4 125 40.7 20 37.9 2.5 25.6 100 39.2 16 37.7 2 24.1 12.5 36.8 dB dB 60- - 60 '-1 ' _ 0
E*
50-___ - 50 0 r_-F F'__[__ < 7---2 .. _'§5'
H 40-h
? -- 40 2. hm'- r_' ,--__s
r_
á 30- - 30 20 I ' T ' l ' m 1 v ' I l m I T '. I I 20 500 200 100 50 20 10 5 241
VTI Mobile Laser Profilometer
Texture measurement protocol
Test Site No.: 97 (NASA L ) Spectmm-derived overall levels:
Road Section No.: Section 2, Run l,2,3,4,5,6 52.8 dB(Ma) Macrotexture
Other site description: 47.2 dBCMe) Megatexture
43.1 dB(5mm) For noise pred.
Unitslmm : 337 45.3 dB(80mm) For noise pred.
Texture depth valnesinmm: ETD: 0.728 MPD: 0.887 RMS: 0.486 TDMA: 0.803
Date of Measurement : 20 APR 1994
Measured Distance : 40 m
Invalid (%) : 0
Name ofReport File : NASA97B.AVG
SW Files 1 NASA97BI.SPC NAsmnzspc NASA97B3.SPC NASA97B4.SPC NASA97BS.SPC NASA9786.SPC Pmñle Fdes 3 NASA97BI.PRO NASA97BZPRO NASA97B3.PRO NASA97B4.PRO NASA97BS.PRO NASA9786PRO
Third-octave band Spectral levels
mm dB mm dB mm dB 500 39.2 80 40.3 10 42.5 400 37.3 63 41.4 8 41.9 315 36.2 50 41.8 6.3 40.3 250 37.1 40 42.2 5 37.9 200 37.1 31.5 42.7 4 35.6 160 38.1 25 43.3 3.1 32.3 125 38.9 20 43.0 2.5 28.5 100 39.9 16 43.3 2 25.2 12.5 43.2 dB dB 60-- - 60 '-1 d _. 0
g 50_
_50
5' < a .. .. g 40-_- r Fr_ -409.
_Fr
r_-r_å 30-
- 30
20 , T . . 1 . 1 r r , , . , . , s 1 , . r. , v 7 r ,
20
500 200 100 50 20 10 5 2 Texture wavelength [mm]VTI Mobile Laser Profilometer
Texture measurement protocol
Test Site No.: 97 (NASA L ) Spectrum-derived overall levels:
Road Section No.: Section al, Run l,2,3,4,5,6 53.1 dB(Ma) Macrotexture
Other site description:
5
47.2
dB(Me)
Megatexture
43.6 dB(Smm) For noise pred.
Units/mm : 337 45.5 dB(SOmm) For noise pred.
Texture depth values in mm: ETD: 0.798 MPD: 0.947 RMS; 0.498 TDMA: 0.845
Date of Measurement : 20 APR 1994
Measured Distance : 40 m
Invalid ('70) : 0
Name of Report File : NASA97A.AVG
sm 135 1 NASA97A1.SPC NASA97A2.SPC NASA97A3.SPC NASA97A4.SPC NASA97A5.SPC NASA97A6.SPC Pmñle F11 3 NASA97A1.PRO NASA97A2.PRO NASA97A3.PRO NASA97A4.PRO NASA97A5.PRO NASA97A6.PRO
Third-octave band spectral levels
mm dB mm dB mm dB 500 38.5 80 40.6 10 42.8 400 37.8 63 41.4 8 42.3 315 36.1 50 42.0 6.3 40.7 250 37.2 40 42.4 5 38.4 200 37.8 31.5 43.1 4 36.2 160 37.6 25 43.5 3.1 33.1 125 39.0 20 43.4 2.5 29.5 100 40.1 16 43.8 2 26.3 12.5 43.6 dB dB 60- - 60 '-1 " _ 0 x
§3' 50_
_ 50
5' < :L _. ..E 40-
_--F
F_
F*-
_40
2 _F_ 7-_ r_'s' - I'
*
-å 30-
- 30
20 , .
. 1 r T T T
, . . , I
,
,
20
500 200 100 50 20 10 5 2 Texture wavelength [mm]43
APPENDIX 3: CALIBRATlON AND BACKGROUND NOISE
EE H ..v. 4 .uvwåw ...m 0 o a »r m . ;0 . .0 .on 0.0000 00 . 4 ..40 00no. 05. . av. ..? 4.. . .3 6? I. 0 ..av.. o 00 000c. o 004 % . ...xus .... uownn vuö .83 304 ... .a .000 J. .0. 0.. .4.0 .0. .. . 0 0o 000 .J
0. 0 nu 600 0O 0O .An nvvua v". ... .. .C . 01..a.000 ..06 ..5. to'v...ä.. ..MW. .nu...5 a.. a.. bc 00 'to 0... 3.3 .3. 0 00 % 6 .co..0
6xxuäv ..okva ...
.nu
.O OO O0
O0o?.. a.v. ..u% . . . .04 .39
...oou.5...ncoa.. ouåvoo..atM nW.0 xJa64 ". 4.3
K. . ... (09 00 OA. ..J . .
0 i? 4 -20a. 'LS...yO 0 O 3 . o o o 4 0 4 o .o
.4; o! '0:0 000. .14 t 40am 0%
'0 o1 0 ' O 0 0 2010:»0 0 v 0 "3 4% 0 O 0 o 0 344 0. 0 0.50 0 .a 0 o 4; F .$ 5 .... . C 'O :0 33 % o o o v0 .u 009 090 000 0. scáo 0.0 .th 4of0 00. .8: a: SE LE RU <m <z EE hv uG E.: nav "G E EE 3% "E n EE una "P H
u.
3
en
2.
8:3
"o EP E. ..5 234 8: 82 ._E_ 05 uåE "o E2 .E n to as ?E aug _" mnám EE vua Ec
3» <Z <m <U NH m. OM . . a.. .. o o0. oaux ... .. ... vad. . ... .. 454 ... n... .. o.. vo . ... ... ..c . 00 .00 c.. 0 a.. coc
00fol Aüüo .. 4.n.. ofva 4.» .0.Jo 34...0.0
000 . JJ. 4 0 044 : anv. .. . 00 voâo0.. oo000 000 000§§ 00. vJo00. 0 ... o V..0) 59 .. ..
.. . . . o... ... . +tvvu. u.aá. ... .n. ..n 0. . .AM ... .. w??vá. . o.. ... .
.. ...33.Law. 0.7.at. 4ann.o
I. ... .. 53% ... . ..0i 0 lås ,.. . .. .. .uwâwxå auf Oo... .3. 5.3 .00 09. 44 00 00 00 .O 60 60 O .A . §33. O . .wuu ... ...tvvvva 43.0
O. 00 00 . ... dawn .o. .. .. . ... ..u. o. ... oo
.n u... ut. u..." am. . .. a.. ,. 4. man 9.2 2_ :S EL EE U< m< z EE av. .. 9: 2 :: 23. e" <0 EE amd "m å :B www" EE H
45
VTI Mobile Laser Profilometer
Texture measurement protocol
Test Site No.: NASA Calibration after Spectrum-derived overall levels:
Road Section No.: 69.5 dB(Ma) Macrotexture
Other site description: 39.7 dB(Me) Megatexture
46.6 dB(5mm) For noise pred.
Units/mm : 337 29.4 dB(80mm) For noise pred.
Texture depth values in mm : ETD: 5.26 MPD: 4.76 RMS: 2.91. 'I'DMAz 6.7
Date of Measurement : 05 MAY 1993
Measured Distance : 40 m
Invalid ('70) : 0
Name of Report File : NASACAL2.REP
Spectrum Files : NASACAL2.SPC
Proñle Files : NASACAL2.PRO
Third-octave band spectral levels
mm dB mm dB mm dB 500 34.3 80 26.9 10 44.3 400 21.3 63 22.9 8 31.1 315 29.3 50 23.9 6.3 45.6 250 35.1 40 24.1 5 38.5 200 25.1 31.5 27.4 4 33.0 160 22.5 25 44.7 3.1 28.6 125 32.2 20 69.4 2.5 24.6 100 22.7 16 52.5 2 21.0 12.5 31.2 dB dB 60- - 60 -] " _ 0 X
g 50_-
- 50
8' < 2. - '- _'te
ä 40-T
F_ - 40a
T_
F
7_
a 30-
T'
F_
- 30
20 T . , 1 r 1 I 7 1 , , , . 1 . , j 4 , 20 500 200 100 50 20 10 5 2 Texture wavelength [mm]VTI Mobile Laser Profilometer
Texture measurement protocol
Test Site No.: NASA background noise Spectrum-derived overall levels:
Road Section No.: 36.8 dB(Ma) Macrotexture
Other site description: note that 10 dB is added 29.0 dB(Me) Megatexture
to spectmm 32.1 dB(5mm) For noise pred.
Units/mm : 337 25.1 dB(80mm) For noise pred.
Texture depth values in mm : E'I'D: 0.2 MPD: 0.0666 RMS: 0.0274 TDMA: -0.04l4
Texture wavelength [mm] Date of Measurement : 05 MAY 1993
Measured Distance : 80m
Invalid (V.) : 0
Name of Report File : NASABKGKREP
Spectrum Files : NASABKGRSPC
Proñle Files : NASABKGKPRO
mamve bandspectmllevels All bands are increased by 10 dB!
mm dB mm dB mm dB 500 20.0 80 20.0 10 25.1 400 20.0 63 21.0 8 26.0 315 20.0 50 20.0 6.3 26.7 250 20.0 40 20.0 5 27.2 200 20.0 31.5 21.8 4 28.1 160 20.0 25 22.4 3.1 28.1 .125 20.0 20 22.4 2.5 27.2 100 20.0 16 24.0 2 26.0 12.5 24.4 dB dB 60- -60 '-l " _ 0 a
§ 50-
_50
5' < 2 ._ ..'a Please note that this spectrum has been
E, 40- increased by 10 dB in order to have most -40
_52.. of the bars within the vertical scale.
å 30-
_30
20 ,.r 1..,.73-1' ,[,i,[j. ,av_, 20
APPENDlX 4: PROFILE CURVES
VTI NOTAT 52-94