PyNestGUI
Manual
Nicklas Haglund
SCHOOL OF INNOVATION, DESIGN AND ENGINEERING
Västerås, Sweden
Introduction
This manual will give the user the basics on how to use the PyNestGUI and what results the program will provide. The reason why PyNestGUI was created in the first place was to help users use the NEST neuron simulator. The program will make it easy to simulate a network of neurons connected as they are in a biological inspired minicolumn.
Minicolumns can be found in the visual cortex of a mammals.
Starting the PyNestGUI
There is two ways to start the program. The user can either use the terminal to go to the directory where the files to the PyNestGUI program is located and run application from there by typing:
$ python PyNestGUI.py
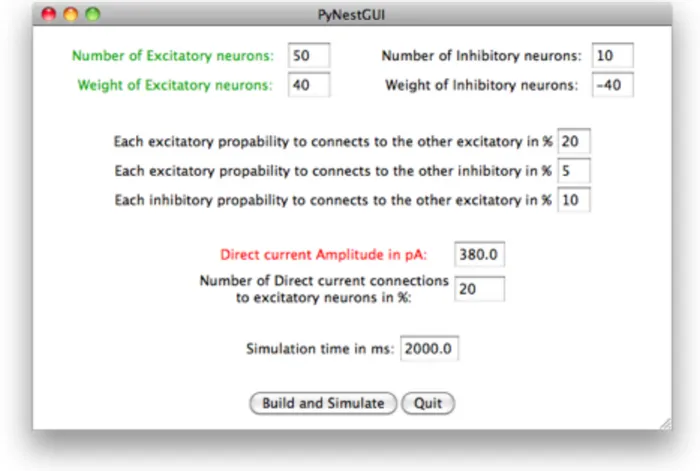
The other way the program can be started on a Mac OS X computer is to go to the same map with Finder and start the application with the Python Launcher. This can be done by control click on the PyNestGUI.py file and select ʻOpen Withʼ and then ʼPython Launcherʼ. Python should now create the main window of the program that is called PyNestGUI. See figure 1.
Preferences
The user can change how the neurons at the simulation should behave by changing the values of the entries in the main window. The entries at the top of the window tells the simulator how many of each type of neuron to create. There are two types of neurons that can be created. One of these is the excitatory neuron which will send out a positively
charged spike to its connected neurons when it spikes. The reason why the text next to the excitatory neurons entries are green is because green will represent excitatory neurons in text, images and animation when the user will view the results. The other type of neuron is inhibitory which will send out a negative spike to its connected neurons when it spikes. The color of the inhibitory neuron is black and white. The peak amplitude value in pA of a spike can be changed by the entries under the numbers of neurons.
Under this section of the main window will you find the connection probability of the
neurons. The user change how many each type of neuron will connect to other neurons in a percent value. Under this section is the direct current section in the simulation. This sets the current the dc generators will give to randomly selected excitatory neurons. How many of the excitatory neurons that will be stimulated with the dc generator can also be
changed. The color of the excitatory neurons with dc generator is red when viewing the results.
The last entry in the main window is the simulation time, setting how long the simulation will run in milliseconds. The user can press the ʻBuild and Simulateʼ button when all the entries has been changed to satisfactory. The NEST simulation will load after the button has been pressed and the neuron network will be created and simulated in NEST. After that will the program create the Network window that holds the results from the simulation.
Results
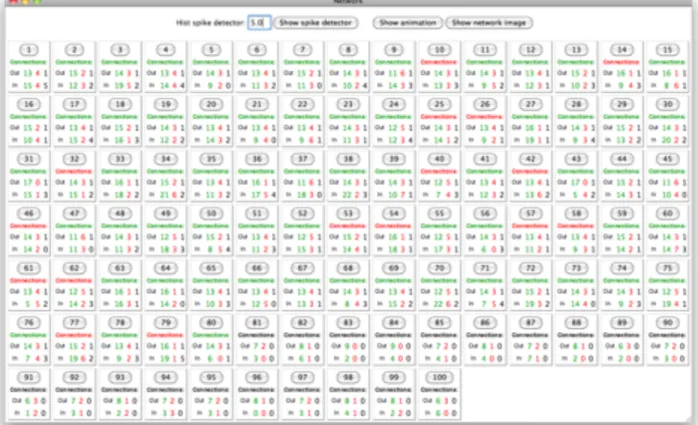
Network window
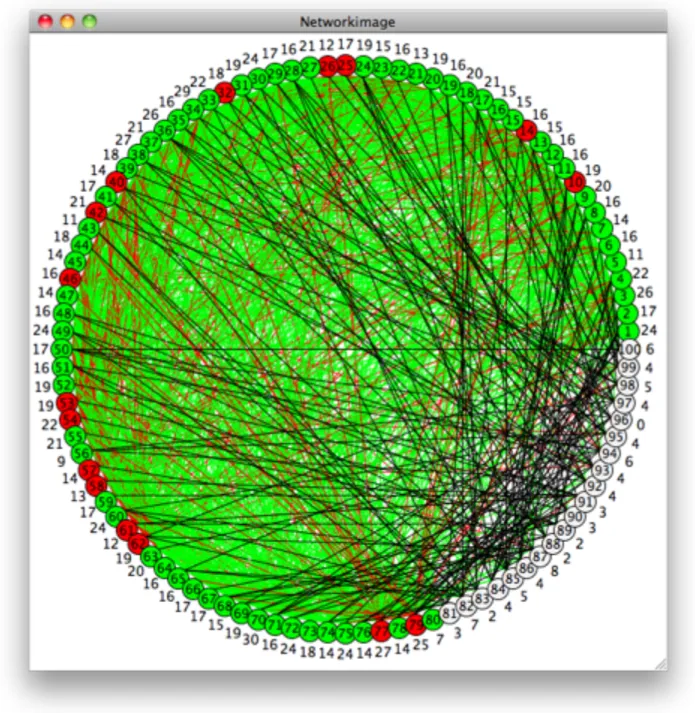
At top of the window there are buttons that will show a spike detector plot, an animation of the spiking during the simulation and a button that will show an image over how the
neurons are connected. Under these buttons are boxes that contain a button and a connection information. Each of this boxes represents a neuron in the simulation. When the user presses one of these buttons a new window with result from the voltmeter will be shown. Under the button is a ʼconnectionsʼ label and information about the neurons connections. The reason why the text is in different colors is because they represent different types of neurons.
• Green color represent excitatory neurons.
• Red color represent neurons that are connected to a dc generator. • Black color represent inhibitory neurons.
Figure 3. Network window. Here are the results from the simulation.
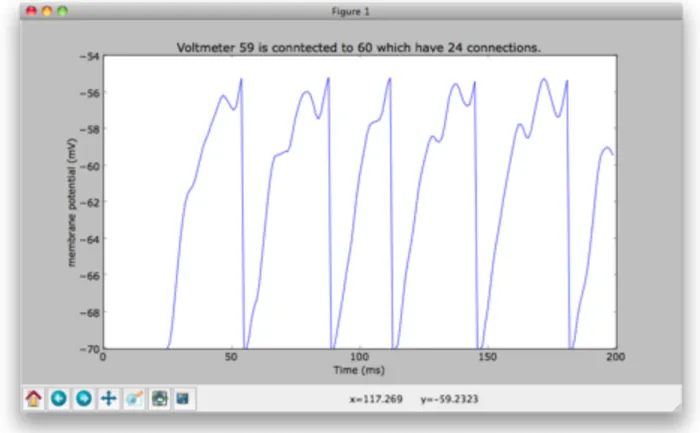
Results from voltmeter
This window shows the result from the voltmeter connected to the neuron. The voltmeter has been recording the membrane potential of the connected neuron during the
simulation. The user can zoom in at the plot and save the plot as an image when pressing the buttons at the bottom of the window.
Note: The program can only show one voltmeter or the spike detector plot at a time.
Figure 5. Result from voltmeter 59 that where connected to neuron 60 that had 24 connections during simulation.
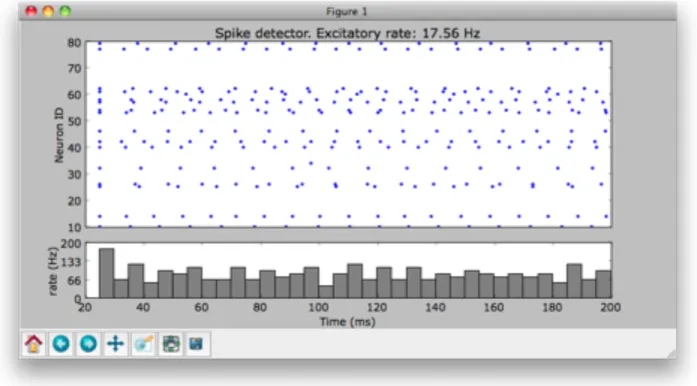
Results from spike detector
The spike detector records spikes from all connected neurons during the simulation. The spike detector plot window show two plots. The plot at the top shows when the neurons spikes and the plot at the bottom shows what frequency the neurons are spiking with during the simulation. There is an entry at the Network window where the user can change the fixed time intervals that the plot uses tocalculate the frequency with. The user can save the plot as an image and zoom in and out using the buttons at the bottom of the window. Note: The program can only show one voltmeter or the spike detector plot at a time.
Figure 7. This plot shows when and which neurons spiked during simulation and the frequency the network spiked in.
Animation window
This window will show an animation of the simulation when the neurons spiked. The user can change the speed of the animation with the slider. The slider change how long time the computer will wait between each frame of the animation.
The neurons are represented by a circle in the animation. The different colors tell what type of neuron that is shown. The colors represent the same thing in the animation as they do at the Network window. The neurons are placed in a circle because it is an easier way to show all the connections in the simulation. This has to do with how to visualize the network of neurons and the connections between them and nothing with how the neurons are placed in the simulation.
The circle that represents a neuron will turn black and the connections from that neuron will be shown when the neuron send out a spike. The color of the neuron will fade back and the connection will fade away as the animation goes on. It is easier for the user to get a chance to see all the spikes if there is a smooth transition.
Network picture
The network picture window will display an image of the neuron network as in the
animation window. The neurons are placed and look the same as in the animation. The difference is that the user will see all the connections between the neurons in the network picture.