THE IMPACT OF PERCEPTUAL COUNTERMEASURES ON DRIVING
BEHAVIOUR IN RURAL-URBAN TRANSITION: A DRIVING
SIMULATOR STUDY
Qinaat Hussain
Hasselt University – Transportation Research Institute (IMOB) Agoralaan, 3590 Diepenbeek, Belgium
E-mail: qinaat.hussain@student.uhasselt.be
Co-authors: Ali Pirdavani*, Hasselt University – Faculty of Engineering Technology & Transportation Research Institute (IMOB);
Caroline Ariën, Hasselt University – Transportation Research Institute (IMOB); Tom Brijs, Hasselt University – Transportation Research Institute (IMOB);
Wael K. M. Alhajyaseen, Qatar University – Qatar Transportation and Traffic Safety Center, College of Engineering.
* Corresponding author: Ali Pirdavani, Phone: +32 11 29 21 83, E-mail: ali.pirdavani@uhasselt.be
1.
INTRODUCTION
Many journeys include transitions from a road stretch where the speed limit drops from higher values to lower values. These transition road segments (i.e. rural to urban) are more complex for drivers because of changes in the road environment combined with sudden speed changes (i.e. 70 kph to 50 kph in Flanders) (Ariën et al., 2013; Galante et al., 2010) which often yield to an inadequate adaption to the speed limits (Hallmark et al., 2007). As speed influences both the probability of a crash and its severity (Elvik, 2009; Heydari et al., 2014; Alhajyaseen, 2015), these transitions could be considered as higher accidents prone zones. Furthermore, logistic models describing the relationship between impact speed and pedestrian fatality risk show that the risk increases very rapidly for any small increase in the impact speed after 50 kph (Davis, 2001; Oh, Kang, & Kim, 2008). Therefore, appropriate speed management at rural to urban transitions between 70 kph and 50 kph is essential.
Different types of approaches have been used to manage driving speed on roads. Allpress & Leland (2010) argued that perceptual countermeasures shape the roadside environment designs to increase drivers’ estimation or feeling of speed. This increased perceptual speed might result in an actual speed decrease. Furthermore, as previously tested by researchers, perceptual countermeasures were one of the acceptable possible solutions to adequately reduce driving speed and increase road safety at transitions. In this study, we focus more specifically on optical pavement markings of which various types exist. Optical speed bars (OSB) with reduced spacing in travelling direction (Galante et al., 2010; Gates et al., 2008; Godley et al., 2000; Montella et al., 2011) were used to increase drivers’ perceptual speed; while dragon teeth markings (Montella et al., 2015; Montella et al., 2011), peripheral transverse bars (Galante et al., 2010; Montella et al., 2011) and herringbone pattern (Arien et al., 2016; Charlton, 2007) were used for producing road narrowing effect. To achieve combined perceptual effects of increasing drivers’ attention, increasing perceptual speed and creating road narrowing effect, researchers tested combinations of different treatments.
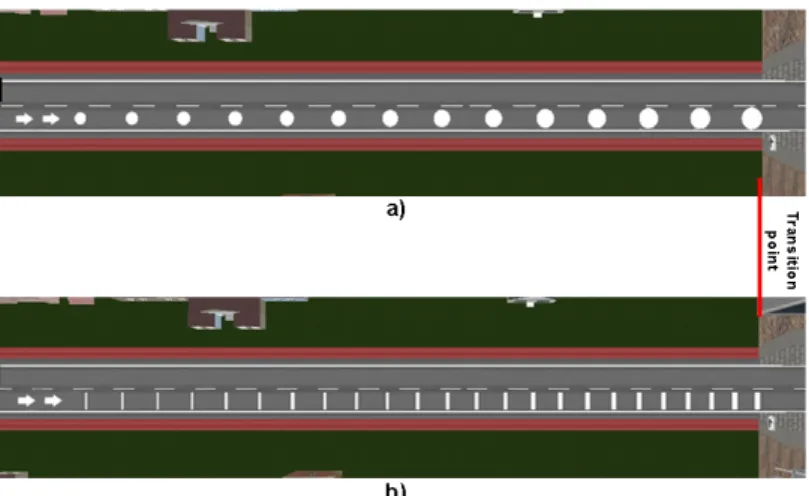
In the current study, we aim to achieve combined perceptual effects (i.e. increase drivers’ attention, perceptual speed and perceptual road narrowing effect) by implementing a single treatment using a driving simulator. To achieve combined perceptual effects, we introduced Optical Circles ‘OC’ with increasing diameters (Figure 1a) based on the concept of forced perspective illusion and compared with a modified form of the commonly used speed bars (i.e. Optical Bars ‘OB’ with increasing widths and
decreasing spacing as illustrated in Figure 1b). To the best of our knowledge, circle markings have never used for this purpose while speed bars are commonly used with fixed width and decreasing spacing.
Figure 1: Top view of the treatments’ segments: a) Optical circles; b) Optical bars
2.
OBJECTIVES AND RESEARCH QUESTIONS
This driving simulator study investigates the impact of perceptual countermeasures on driving behavior (i.e. speed, acceleration/deceleration and lateral position) by creating combined perceptual effects by means of pavement markings at road transitions between rural and urban areas whereof the speed limit reduces from 70 kph to 50 kph.
3.
METHODOLOGY
3.1. Subjects and apparatus
Fifty subjects with a full driving license participated in the study. Six participants were excluded: two were affected by simulation sickness and four participants were identified as outliers. Thus, 44 participants (30 men vs. 14 female) remained in the sample (mean age: 28.06 years, SD age: 8.09 years, mean driving experience: 6.65 years, and SD driving experience: 8.16 years).
The experiment was conducted using the driving simulator at Transportation Research Institute (IMOB) of Hasselt University. The simulator consisted of two main components: (a) the driving unit – a real car (fixed-base) equipped with speedometer, force-feedback steering wheel, pedals, indicators, gearbox and (b) a large 180° seamless curved screen with three projectors. The components are interfaced with STISIM Driver 3 which offers high speed graphics and sound processing.
3.2. Scenarios design
Three different rural (70 kph) to urban (50 kph) transition sections were designed using STISIM Drive interface. The reference transition section was an untreated control condition, while the other two transition sections (i.e. OC scenario and OB scenario) were designed with the proposed countermeasures. The transition sections were alternated with rural filler pieces which were meant to create some variation while driving. To provide drivers with an appropriate time within the painted marking segment, the length of marking segments (i.e. 100 m) was calculated for 6 seconds of driving time. This is the approximate space and time drivers require to decrease their speed from 70 kph to 50 kph. The three scenarios (i.e. reference, OC and OB) were combined randomly to form a single driving run with the length of 16.5 km. Each participant drives each run two times, implying that (s)he confronted each scenario two times randomly. Weather conditions were sunny and dry and there was only traffic present in the opposite direction.
3.3. Data collection and analysis
Data was collected for longitudinal (speed and acceleration) and lateral control (lateral position) using STISIM Drive® Software. Data was converted into every tenth of the meter to achieve high accuracy results.
The entire analysis section is 900 m (500 m before and 400 m after the transition point) long and is divided into 9 equal zones of 100 m. For each zone the mean speed, the standard deviation of acceleration/deceleration (SDAD) and the standard deviation of lateral position (SDLP) were calculated. Standard deviations were chosen for acceleration/deceleration and lateral position in each zone to estimate variations in our dataset. By doing so, we can estimate whether the drivers decelerate and evade vehicles in a safely manner or not.
Within-subject design was chosen for experimental method of the current study, as each participant was tested for each scenario twice. According to Huberty & Morris (1989) the typical analysis approach used in the behavioral sciences for multiple outcome variables is either to conduct multiple ANOVA tests or to conduct a multivariate analyses of variance (MANOVA) followed by multiple ANOVAS. For this study MANOVA followed by individual ANOVA tests were conducted on the variables of interest (i.e. mean speed, SDAD and SDLP) for the factors, i.e. 9 zones x 3 scenarios (reference, OC, OB) x 2 driving runs. Post-hoc analyses were performed where the interaction effect was significant, and p-value was set as 0.05 for all the analyses tests to determine statistical significance.
4.
RESULTS
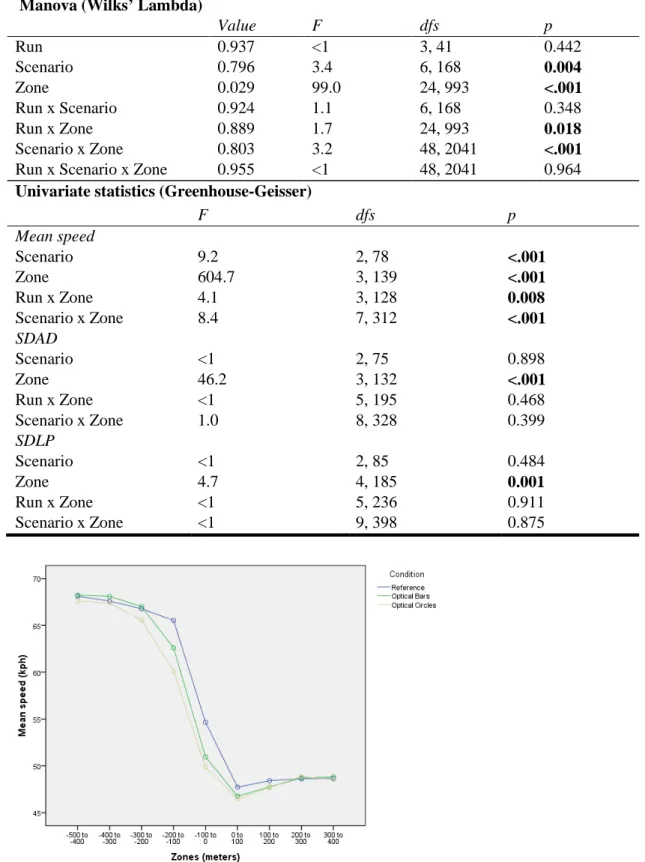
Table 1 presents the results from the multivariate and univariate analyses. The MANOVA shows significant main effects of the factors Condition and Zone. Furthermore, the interaction effects of Run x Zone and Condition x Zone are also significant. This shows that markings as a main effect and two-way interaction effect with Zone were helpful to influence driving behavior. However, to understand the respective effects, we examine the univariate statistics for each dependent variable separately. SDAD and SDLP are significantly changing between the different analysis zones. However, the three different conditions show no significant difference in SDAD and SDLP.
Figure 2 shows the mean speed values of both driving runs together along each zone and for each scenario separately. It can be seen from the figure, that drivers started to reduce their speed from 400 m before the rural-urban transition point in the OC scenario and after 300 m in the OB scenario. The speed reduction started later in the reference scenario as compared with treated scenarios. Mean speed remains lower for both OB and OC scenarios as compared with the reference scenario up to more than 200 meters after the transition point.
The separate test for each zone for the interaction effect Scenario x Zone showed that speed was changed significantly due to the implemented treatments on the last 300 m before the transition point (i.e. zone [-300 to -200]: F(2,77) = 2.7, p = 0.080, partial eta squared 𝜂𝜂𝑝𝑝2 = 0.059; zone [-200 to -100]: F(2,80) = 23.2, p < .001, 𝜂𝜂𝑝𝑝2 = 0.351; zone [-100 to 0]: F(2,81) = 28.7, p < .001, 𝜂𝜂𝑝𝑝2 = 0.39). Post-hoc pairwise comparisons showed that mean speed was reduced maximally for OC design in zone [-200 to -100] (Δ 5.43 kph, p < .001) and zone [-100 to 0] (Δ 4.81 kph, p < .001) compared to the reference scenario. Furthermore, the OB design also resulted in a significant speed reduction in comparison with the reference scenario during the last 200m before the transition point (zone [-200 to -100], p < .001, Δ 2.93 kph; zone [-100 to 0], p < .001, Δ 3.70 kph). Between 300m and 100m before the transition point, there was also a significant lower speed in the OC design compared to the OB design (zone [-300 to -200], p = 0.041, Δ 1.41 kph; zone [-200 to -100], p < .001, Δ 2.50 kph).
Table 1: Multivariate and univariate statistics (significant p-values are indicated in bold) Manova (Wilks’ Lambda)
Value F dfs p Run 0.937 <1 3, 41 0.442 Scenario 0.796 3.4 6, 168 0.004 Zone 0.029 99.0 24, 993 <.001 Run x Scenario 0.924 1.1 6, 168 0.348 Run x Zone 0.889 1.7 24, 993 0.018 Scenario x Zone 0.803 3.2 48, 2041 <.001
Run x Scenario x Zone 0.955 <1 48, 2041 0.964
Univariate statistics (Greenhouse-Geisser)
F dfs p Mean speed Scenario 9.2 2, 78 <.001 Zone 604.7 3, 139 <.001 Run x Zone 4.1 3, 128 0.008 Scenario x Zone 8.4 7, 312 <.001 SDAD Scenario <1 2, 75 0.898 Zone 46.2 3, 132 <.001 Run x Zone <1 5, 195 0.468 Scenario x Zone 1.0 8, 328 0.399 SDLP Scenario <1 2, 85 0.484 Zone 4.7 4, 185 0.001 Run x Zone <1 5, 236 0.911 Scenario x Zone <1 9, 398 0.875
Figure 2: Mean speed profiles for condition by separate lines
5.
CONCLUSION
The study results clearly showed that the speed was reduced significantly for the both road marking treatments. The OC scenario, in which circle marking with increasing size were implemented, was the most effective solution because it influenced driving behavior by reducing their speed (up to 5.76 kph)
and keeping it lower compared to the two other conditions over the entire course of 500 m (300 m before and 200 m after the transition). The speed reduction profile clearly shows that the driving speed can be decreased more effectively by producing forced perspective illusion with greater size of solid (i.e. filled color) objects. Based on the results it is assumed that combined perceptual effects (i.e. perceptual speed, drivers’ attention and road narrowing illusion) can be achieved using Optical Circles instead of using combined expensive countermeasures such as, combination of markings, roadside fence and gantries. In conclusion, the OC scenario is recommended for policy makers as a low-cost speed management tool. Real world implementation of OC will allow practitioners to see the long-term effect by conducting before-after studies.
6.
ACKNOWLEDGEMENTS
This publication was made possible by the NPRP award [NPRP 9-360-2-150] from the Qatar National Research Fund (a member of The Qatar Foundation). The statements made herein are solely the responsibility of the author[s].
REFERENCE
Arien, C., Brijs, K., Vanroelen, G., Ceulemans, W., Jongen, E. M. M., Daniels, S., . . . Wets, G. (2016). The effect of pavement markings on driving behaviour in curves: a simulator study. 1-13. doi:10.1080/00140139.2016.1200749
Ariën, C., Jongen, E. M. M., Brijs, K., Brijs, T., Daniels, S., & Wets, G. (2013). A simulator study on the impact of traffic calming measures in urban areas on driving behavior and workload. Accident Analysis & Prevention, 61, 43-53. doi:https://doi.org/10.1016/j.aap.2012.12.044
Charlton, S. G. (2007). The role of attention in horizontal curves: A comparison of advance warning, delineation, and road marking treatments. Accident Analysis & Prevention, 39(5), 873-885. doi:http://doi.org/10.1016/j.aap.2006.12.007
Davis, G. A. (2001). Relating severity of pedestrian injury to impact speed in vehicle-pedestrian crashes: Simple threshold model. Transportation Research Record(1773), 108-113.
Elvik, R. (2009). The power model of the relationship between speed and road safety : update and new analyses. Oslo: Transportøkonomisk institutt.
Galante, F., Mauriello, F., Montella, A., Pernetti, M., Aria, M., & D’Ambrosio, A. (2010). Traffic calming along rural highways crossing small urban communities: Driving simulator experiment. Accident Analysis & Prevention, 42(6), 1585-1594. doi:https://doi.org/10.1016/j.aap.2010.03.017
Gates, T., Qin, X., & Noyce, D. (2008). Effectiveness of Experimental Transverse-Bar Pavement Marking as Speed-Reduction Treatment on Freeway Curves. Transportation Research Record: Journal of the Transportation Research Board, 2056, 95-103. doi:10.3141/2056-12
Godley, S. T., Triggs, T. J., & Fildes, B. N. (2000). Speed Reduction Mechanisms of Transverse Lines. Transportation Human Factors, 2(4), 297-312. doi:10.1207/STHF2-4_1
Heydari, S., Miranda-Moreno, L. F., & Liping, F. (2014). Speed limit reduction in urban areas: a before-after study using Bayesian generalized mixed linear models. Accident; analysis and prevention, 73, 252-261. doi:http://dx.doi.org/10.1016/j.aap.2014.09.013
Montella, A., Aria, M., D’Ambrosio, A., Galante, F., Mauriello, F., & Pernetti, M. (2011). Simulator evaluation of drivers’ speed, deceleration and lateral position at rural intersections in relation to different perceptual cues. Accident Analysis & Prevention, 43(6), 2072-2084. doi:https://doi.org/10.1016/j.aap.2011.05.030
Montella, A., Galante, F., Mauriello, F., & Pariota, L. (2015). Effects of traffic control devices on rural curve driving behavior. In Transportation Research Record (Vol. 2492, pp. 10-22): National Research Council.
Oh, C., Kang, Y. S., & Kim, W. (2008). Assessing the safety benefits of an advanced vehicular technology for protecting pedestrians. Accident Analysis & Prevention, 40(3), 935-942. doi:https://dx.doi.org/10.1016/j.aap.2007.10.010