Closing nutrient cycles
Linköping Studies in Science and TechnologyDissertation No. 2061
Usman Akram
Us
m
an A
kra
m
C
los
ing n
utri
en
t c
yc
les
20
20
FACULTY OF SCIENCE AND ENGINEERING
Linköping Studies in Science and Technology, Dissertation No. 2061, 2020 Department of Physics, Chemistry, and Biology
Linköping University SE-581 83 Linköping, Sweden
Linköping Studies in Science and Technology Dissertation, No. 2061
Closing nutrient cycles
Usman Akram
Theoretical Biology (TEOBI)
Linköping University, SE-581 83 Linköping, Sweden Linköping 2020
Closing nutrient cycles
Linköping Studies in Science and Technology Dissertation, No. 2061
ISBN: 978-91-7929-875-3 ISSN 0345–7524
Copyright©2020 Usman Akram unless otherwise noted Printed by LiU-Tryck, Linköping 2020
To my Father and Mother!
It is all because of you!
Contents
Abstract ... i
Sluta cykeln av näringsämnen ... iii
List of Publications ... v
My Contributions ... vi
1 Introduction ... 1
1.1 Importance of plant nutrition ... 1
1.2 Scientific understanding of plant nutrition mechanisms ... 2
1.3 Challenges to sustaining nutrient supply to an increasing food demand ... 4
1.3.1 Soil degradation ... 5
1.3.2 Eutrophication ... 5
1.3.3 Limited resources ... 6
1.4 Need for nutrient recycling and increasing distances between supply and demand ... 6
1.4.1 Previous work on the spatial separation of excreta supply and crop demand ... 7
1.4.2 Previous work on redistribution of excreta ... 8
1.5 Goals for effective nutrient recycling ... 8
1.5.1 Estimating excreta resources compared to crop nutrient need ... 8
1.5.2 Adjusting the recycling strategies at local scales ... 9
1.5.3 Finding ways to minimize the costs of complete excreta recycling in a country ... 9
1.6 Objectives ... 11
2 Methods ... 12
2.1 Overview ... 12
2.2 Spatial resolution ... 12
2.3 Excreta nutrient supply ... 12
2.3.1 Losses from excreta ... 14
2.4 Crop nutrient need ... 16
2.5 Nutrient balance ... 17
2.6 Redistribution of excreta ... 17
2.7 Economic benefit of the nutrients reuse ... 18
3 Results ... 20 3.1 Paper-I ... 20 3.2 Paper-II ... 20 3.3 Paper-III... 21 3.4 Paper-IV ... 21 4 Discussion ... 24
4.1 Global dilemma of reducing nutrient flows vs. meeting human food needs ... 24
4.1.1 Reducing nutrient need by changing dietary habits ... 25
4.1.2 Redistribution of the use of nutrients - a global challenge ... 25
4.2 Spatial separation -adjusting recycling strategies at local scales... 26
4.2.1 Substitution of synthetic fertilizers ... 27
4.3 Importance of input data resolution ... 29
4.4 Concluding remarks ... 31
Acknowledgments ... 33
i
Abstract
Adequate and balanced crop nutrition – with nitrogen (N), phosphorus (P), and potassium (K) – is vital for sustainable crop production. Inadequate and imbalanced crop nutrition contributes to the crop yield gaps – a difference in actual and potential crop yield. Yield gap is one of the many causes of insufficient food production, thus aggravating hunger and malnourishment across the globe. On the other hand, an oversupply of nutrients is highly unsustainable, in terms of both resource conservation and global environmental health. A decreasing excreta recycling in crop production is one of the many reasons for nutrient imbalances in agriculture. Previous studies show that increasing agricultural specialization leads to spatial separation of crop and animal production. Increasing distance between excreta production and crop needs is one of the leading factors that cause reduced excreta recycling. Studies focusing on excreta recycling show that a substantial barrier to a more efficient excreta nutrient reuse is the expensive transportation of bulky volumes of excreta over long distances. In order to overcome that barrier, more detailed spatial estimates of distances between excreta production and crop nutrient needs, and the associated costs for complete excreta transport in an entire country are needed. Hence, the overall aim of this thesis was to quantify the amount of nutrients in the excreta resources compared to the crop nutrient needs at multiple scales (global, national, subnational, and local), and to analyze the need for excreta transports, total distances and costs, to meet the crop nutrient needs in a country.
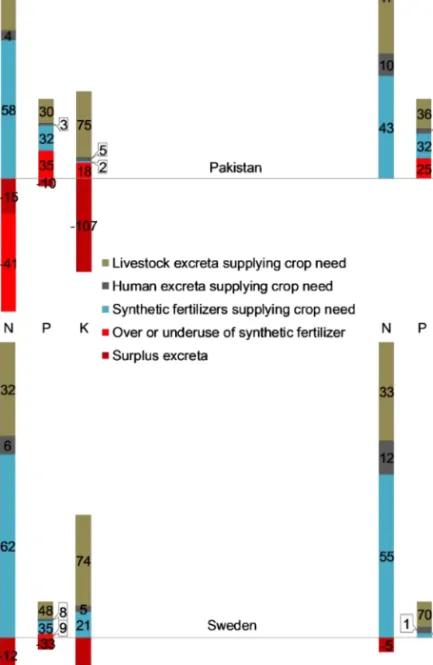
On the global scale, annual (2000-2016) excreta supply (livestock and human) could provide at least 48% of N, 57% of P, and 81% of K crop needs. Although excreta supply was not enough to cover the annual crop nutrient needs at the global scale, at least 29 countries for N, 41 for P, and 71 for K had an excreta nutrient surplus. When including the annual use of synthetic fertilizers, at least 42 additional countries had a N surplus, with the equivalent figures for P being 17 countries, whereas 8 additional countries attained a K surplus. At the same time, when accounting for the use of synthetic fertilizers, each year, at least 57 countries had an N deficit, 70 a P deficit, and 51 countries a K deficit, in total equivalent to 14% of global N and 16% of each P and K crop needs. The total surplus in other countries during the period was always higher than the deficit in the countries with net nutrient deficits, except for P for some years. Unfortunately, both the deficits of the deficit countries and surpluses of the surplus countries were increasing substantially during the 17 years. Such global divergence in nutrient deficits and surpluses have clear implications for global food security and environmental health. A district-scale investigation of Pakistan showed that the country had a national deficit of 0.62 million tons of P and 0.59 million tons of K, but an oversupply of N. The spatial separation was not significant at this resolution; only 6% of the excreta N supply needed to be transported between districts. Recycling all excreta, within and between districts, could cut the use of synthetic N to 43% of its current use and eliminate the need for synthetic K, but there would be an additional need of 0.28 million tons of synthetic P to meet the crop nutrient needs in the entire country. The need for synthetic fertilizers to supplement the recycled excreta nutrients would cost USD 2.77 billion. However, it might not be prohibitively expensive to correct for P deficiencies because of the savings on the costs of synthetic N, and K. Excreta recycling could
ii
promote balanced crop nutrition at the national scale in Pakistan, which in turn could eliminate the nutrient-related crop yield gaps in the country.
The municipal-scale investigation using Swedish data showed that the country had a national oversupply of 110,000 tons of N, 6,000 tons of P, and 76,000 tons of K. Excreta could provide up to 75% of N and 81% of P, and more than 100% of the K crop needs in the country. The spatial separation was pronounced at the municipal scale in the country. Just 40% of the municipalities produced over 50% of the excreta N and P. Nutrient balance calculations showed that excreta recycling within municipalities could provide 63% of the P crop needs. Another 18% of the P crop needs must be transported from surplus municipalities to deficit municipalities. Nationally, an optimized reallocation of surplus excreta P towards the P deficit municipalities would cost USD 192 million for a total of 24,079 km truck transports. The cost was 3.7 times more than the total NPK fertilizer value transported, and that met the crop nutrient needs. It was concluded that Sweden could potentially reduce its dependence on synthetic fertilizers, but to cover the costs of an improved excreta reuse would require valuing the additional benefits of recycling.
An investigation was also done to understand the effect of the input data resolution on the results (transport needs and distances) from a model to optimize excreta redistribution. The results showed that the need for excreta transports, distances, and spatial patterns of the excreta transports changed. Increasing resolution of the spatial data, from political boundaries in Sweden and Pakistan to 0.083 decimal grids (approximately 10 km by 10 km at the equator), showed that transport needs for excreta-N increased by 12% in Pakistan, and the transport needs for excreta-P increased by 14% in Sweden. The effect of the increased resolution on transport analysis showed inconsistency in terms of the excreta total nutrient transportation distance; the average distance decreased by 67% (to 44 km) in Pakistan but increased by 1 km in Sweden. A further increase in the data resolution to 5 km by 5 km grids for Sweden showed that the average transportation distance decreased by 9 km. In both countries, increasing input data resolution resulted in a more favorable cost to fertilizer value ratios. In Pakistan, the cost of transport was only 13% of the NPK fertilizer value transported at a higher resolution. In Sweden, the costs decreased from 3.7 (at the political resolution) to slightly higher than three times of the fertilizer value transported in excreta at the higher data resolution.
This Ph.D. thesis shows that we could potentially reduce the total use of synthetic fertilizers in the world and still reduce the yield gaps if we can create a more efficient recycling of nutrients both within and between countries, and a more demand adapted use of synthetic fertilizers.
iii
Sluta cykeln av näringsämnen
Livsmedelsproduktion är grunden för vårt samhälle idag och för den utveckling som skett det senaste århundrandet. Idag är vi åtta miljarder människor i världen med en produktion och handel med livsmedel, där knappt en miljard lever under hunger och svält. Inom de närmaste decennierna förväntas världens befolkning fortsätta växa och stanna av på omkring 11 till 12 miljarder människor under senare hälften av 2000-talet. För att klara livsmedelsförsörjningen bättre idag, och ännu mer så i framtiden, krävs att vi hittar former för att återföra skördade näringsämnen, som fosfor, kväve och kalium, tillbaka till åkermarken. Många av dessa näringsämnen är ändliga resurser som dessutom bidrar till övergödning om de läcker ut till andra habitat. I dag återfinns det mesta av dessa näringsämnen i gödsel, mänsklig exkreta och rötslam från avloppsreningsverk. Avhandlingen har studerat förutsättningarna för att sluta en större del av näringsämnens cykler i Sverige och Pakistan genom återföring av gödsel och mänsklig exkreta till jordbruksmark, samt utifrån detta även dragit slutsatser om de globala förutsättningar och effekterna av att sluta kretslopp för näringsämnen.
Effekterna av att förbättra återförsel av näringsämnen till åkermark innefattar en minskad belastning i miljön som resultat av minskad användning av handelsgödsel, minskad användning av energi för produktion av handelsgödsel, samt framför allt ökade möjligheter för en långsiktigt hållbar hög skörd på åkerarealen. Det finns dock energikostnader vid återförsel av näringsämnen till följd av många och tunga transporter. Avhandlingen har därför analyserat transportkostnader för effektiv återvinning av näringsämnen från djurhållning och mänsklig exkreta och hur stor del av gödselbehovet som kan täckas av dessa återförda näringsämnen. Speciellt har avhandlingen också studerat hur viktigt det är att ta hänsyn till i vilken skala man skall studera problemet, dvs om det är data på gödselbehov och tillgång som är lokala - ända ner på enskilda fält och gårdar - regionala eller nationella som man skall utgå från när man söker efter effektiva lösningar för att sluta näringsämnes cykler.
Resultaten visar att större delen av gödselbehovet i både Pakistan och Sverige kan täckas genom återvinning av stallgödsel och mänsklig exkreta. I Sverige kan 81% av fosforbehovet täckas på det viset. Transporterna sker i första hand inom kommuner, 63% av behovet, medan de resterande 18% av behovet som kan täckas kräver transporter som är längre och sker mellan kommuner. Kostnaden för transporterna är däremot höga och motsvarar mer än tre gånger kostnaden för motsvarande handelsgödsel. I Pakistan är kostnadsbilden annorlunda, bl.a. eftersom lönekostnaderna är lägre och handelsgödsel är dyrare än i Sverige. Avhandlingen visar att kostnaden för transporter av gödsel i Pakistan skulle motsvara enbart 13% av kostnaden för motsvarande mängd handelsgödsel. Det mesta av återförandet av näringsämnen sker inom distrikt, till exempel är det bara 6% av kvävebehovet som behöver täckas av transporter utanför distrikten. Pakistans handelsgödselanvändning, och därmed kostnad för detta, skulle vid en effektiv återvinning av näringsämnen kunna reduceras ned till 43% av dagens kostnader för kvävegödsel, för fosfor behövs det 0.28 miljoner ton och behovet av kaliumgödsling skulle helt försvinna. Det krävs därmed handelsgödsel motsvarande 2.77 miljarder USD, vilket till del skulle kunna kompenseras av minskade totala kostnader för kväve- och kaliumgödsel. En sådan återföring av näringsämnen i Pakistan skulle också medföra en högre gödseltillförsel till jordbruket och därmed en möjlighet att reducera skördegapet i landet. Skördegapet i Pakistan
iv
är betydande med veteskördar kring 25–30% av de möjliga, och dessa skördegap anses bero just på för små gödselgivor. Pakistan har också tydliga problem med livsmedelsförsörjning på grund av dagens skördegap med 20% av en befolkning på 200 miljoner som är undernärda. För Sveriges del är produktionen och avkastningen per areal till följd av gödsling redan hög. En mer effektiv återförsel av näringsämnen i Sverige skulle därför i första hand bidra till att minska användning av handelsgödsel och därmed begränsa användning av ändliga resurser som fosfor. Analyserna i avhandlingen visar till exempel att i Sverige skulle användning av fosfor som handelsgödsel kunna minska med 67% om återförsel av stallgödsel och mänsklig exkreta effektiviserades.
Analyser av globala data för år 2000 – 2016 visar att den årliga tillgången på näring i gödsel (från djur och människor) motsvarar minst 48% av grödornas N behov, 57% av P behovet och 81% av K behovet. Även om den total mängden näring i stallgödsel och mänsklig exkreta inte räcker för att täcka det årliga globala behovet av näring, så visar data på ett överskott på N i minst 29 länder, ett överskott på P i minst 41 länder och 71 länder har ett K-överskott i stallgödsel och exkreta. Om man dessutom räknar in användningen av handelsgödsel blir det ytterligare 42 länder som har överskott på N, 17 länder till med P-överskott och 8 ytterligare med K- överskott. En stor del av resterande länder har ett underskott av näringsämnen (när man summerar gödsel, mänsklig exkreta och handelsgödsel), 57 länder har brist på N, 70 länder behöver mer P och 51 har brist på K i sitt jordbruk, och har därmed lägre skördar än möjligt. Det totala överskottet av näringsämnen i de andra länderna under denna period motsvarar dock rätt väl den brist som länder med underskott uppvisar. Tyvärr är trenden den att de länder som visade på överskott av näringsämnen år 2000 har sammantaget tydligt ökat på överskottet till 2016, medan även underskotten har ökat i flera av länderna med bristande tillförsel av N, P eller K. Sådana globala obalanser har tydliga implikationer för den framtida matförsörjningen och för miljön.
Avhandlingen visar att vi idag skulle kunna använda mindre handelsgödsel totalt i världen, och ändå reducera de skördegap som finns, om vi skapar en effektiv återförsel av näringsämnen såväl inom som mellan länder och ett mer behovsanpassat användande av handelsgödsel.
v
List of Publications
I. Akram, U., Metson, G. S., & Wennergren, U., 2020. Towards closing global yield gaps through excreta recycling. Manuscript
II. Akram, U., Metson, G. S., Quttineh, N. & Wennergren, U., 2018. Closing Pakistan’s Yield Gaps Through Nutrient Recycling. Front. Sustain. Food Syst.2, 1–14. III. Akram, U., Quttineh, N-H., Wennergren, U., Tonderski, K., and Metson, G. S.,
2019. Enhancing nutrient recycling from excreta to meet crop nutrient needs in Sweden—a spatial analysis. Sci. Rep.
IV. Akram, U., Quttineh, N.-H., Wennergren, U., Tonderski, K., Metson, G.S., 2019. Optimizing Nutrient Recycling From Excreta in Sweden and Pakistan: Higher Spatial Resolution Makes Transportation More Attractive. Front. Sustain. Food Syst. 3:50
vi
My Contributions
I. UA collected and analyzed data, was responsible for formulating questions and aim of the manuscript, and for drafting the manuscript.
II. UA collected and analyzed data, formulated questions, and made a major contribution in producing and interpreting the results and writing the manuscript
III. UA collected and analyzed data, participated in formulating the aim of the paper, and made a major contribution in producing and interpreting the results and writing the manuscript
IV. UA collected and analyzed data, participated in formulating the questions, and made a major contribution in producing and interpreting the results, and writing the manuscript
1
1 Introduction
1.1 Importance of plant nutritionPlants need seventeen essential nutrients to complete their life cycle (Mahler, 2004). Depending on the quantity of a nutrient needed, these are categorized into macronutrients and micronutrients. Macronutrients are needed in relatively larger amounts, compared to micronutrients. Each nutrient has a vital role in plant growth.
• Nitrogen (N) is an integral part of the plant cells. It constitutes plant proteins, hormones, and chlorophyll.
• Phosphorus (P) plays a vital role in transferring energy from the sunlight to the plant tissues. Specifically, electrons in the molecules of chlorophyll are activated by the sunlight (red and blue light). The excited electrons transfer energy to ADP and NADP (P-containing molecules), which then convert into ATP and NADPH. ATP and NADPH drive many processes in living cells. P also accelerates early root growth and stimulates maturity in plants.
• Potassium (K) stimulates the process of the formation of starches, sugars, and oil in plants. It improves fruit quality. Further, it helps the movements of these elements within the plants. It increases the vigor of plants and helps increase disease resistance. N, P, and K three of the six macronutrients are mainly obtained from the soil. The main source of these nutrients in soils is the parent material that is the sedimentary rocks from which the soils are formed (Singh and Schulze, 2005). N could also be supplied from the atmosphere through symbiotic N fixation (plants harbor a special kind of bacteria (rhizobia), which could fix the atmospheric N2 into plant-available ammonia (NH3-N) form in a mutualistic relationship
with plants (James, 2016; Mylona et al., 1995)). Plant growth largely depends on the nutrients available in soils. Soil nutrients deficiency can have a large impact on plant growth: in agriculture, it can result in reduced crop yield (Morgan, 2013). Crop yield is defined as is the weight of harvested crop products at the standard moisture content (e.g., grains) per unit of the harvested area for a crop (Fischer, 2015). Crop yield is usually represented as metric tons per hectare (abbreviated as tons per ha). Lower crop yields than expected per unit of a land area are defined as crop yield gaps. More specifically, a yield gap is a difference between potential yield and actual yield in some specific environment (Fischer, 2015). Potential yield of a region is a measure of yield of the best cultivar under the best agronomic management in the absence of manageable biotic and abiotic stresses (Fischer, 2015). Soil nutrient deficiency is one of the many causes of crop yield gaps (Van Ittersum et al., 2013). In many regions across the globe, the nutrient supply to agriculture needs to increase (in addition to water), because it is crucial to close the crop yield gaps (Mueller et al., 2013; Pradhan et al., 2015).
Crop nutrition is increasingly important in feeding the human population. One way is to provide nutrients from external sources, but that has some serious negative impacts. For example, continued mining of limited P resources (Cordell et al., 2009) and fossil energy resources required for industrial N fixation (Chen et al., 2019) is threatening the future availability of these resources. Moreover, if soils are oversupplied with nutrients, the resulting nutrient emissions cause environmental pollution (Mccrackin et al., 2018). Another way is to increase
2
nutrient use efficiency in agriculture (Hawkesford, 2012). A third way is to enhance nutrient recycling through more efficient use of nutrients resources in excreta (Mccrackin et al., 2018). It has become increasingly important to increase nutrient use efficiency in order to reduce resource depletion and control nutrient emissions for the benefit of the environment. Therefore, in order to sustain food security and environmental integrity, there is a need to enhance our understanding of quantitative estimates of crop nutrient need and nutrient supplies (excreta and synthetic) at different scales. Results from such research are needed to enhance the knowledge about possibilities to increase nutrient recycling between the areas of crop nutrient need and those with excreta nutrient production. This thesis analyzes the potential to correct regional nutrient imbalances through excreta transports at different spatial scales. More specifically, the Papers in the thesis investigate the potential of excreta recycling to facilitate resource use efficiency, reduce nutrient emissions, and remove the crop yield gaps at different scales.
1.2 Scientific understanding of plant nutrition mechanisms
Humans began their history as hunter-gatherers, meaning there was no agriculture or animal husbandry. Food needs were met by wild plants and hunting wild animals (Price and Gebauer, 1995). The Neolithic Revolution in 7,000 BC introduced the widespread use of metal tools to manipulate the soils. This ability to manipulate the soils enabled the hunters to become farmers; they began to harness the earth by cultivating plants and domesticating animals (Weisdorf, 2005). These ancient farmers had the idea that in order to grow, plants need food. They were interested in understanding the phenomena of plant growth. Homer, the legendary author of the
Iliad and the Odyssey, in the 8th century BC, wrote that plant growth could be improved by
applying excreta (Antonkiewicz, 2016). It was also common knowledge among the Ancient Greeks that excreta and compost improve plant growth, meaning they had a basic understanding of soil fertility (Montgomery, 2007). Aristotle, in the 4th century BC, believed that soil prepares
food for plants in the form of organic matter, and plants take up the organic matter from the soil through roots in the form of substances that are present in the plant tissue (Lieth, 1975). During the 1st century BC, agriculture expanded to large acreages, and excreta, ashes, lime, marl, bones,
and gypsum were conventional fertilizers to improve plant growth (Antonkiewicz, 2016). Even the ‘specialization’ in agriculture began, as early as the 1st century BC, leading primarily to
extensive scale cultivation of grapevines, olives, and cereals to meet the food need of the army in the Roman Empire (Mikołajczyk, 2009).
Aristotle’s concept of the soil-plant relationship was correct, but the idea of plant nutrition was wrongly interpreted, and the idea was held almost for 1800 years (Lieth, 1975). In 1450, Nicolai de Cusa replaced Aristotle’s concept of ‘organic matter’ with ‘water,’ that is, “the water thickens within the soil, sucks off soil substances which are then, by the action of the sun, condensed to plant biomass” (Lieth, 1975). Nicolai’s view, for the first time, emphasized that there is a connection between water and plant. This view, after about 150 years, provided the basis for the design of van Helmont’s experiment (Lieth, 1975). Like many other scientists, van Helmont was curious to know what can be used as food for plant growth. He designed an experiment on a willow tree and concluded that the water condensed to form plant biomass. About 100 years after van Helmont’s experiment, Joseph Priestley (an English minister) conducted an experiment, which for the first time gave the insight that there is interaction
3
between plants and air (Lieth, 1975). Later, the Dutch scientist Jan Ingenhousz showed that the interaction between plants and air only occurs in the presence of light (Starck, 2014). The research conducted by van Helmont, Priestley, and Ingenhousz guided the work by De Saussure (Spoehr, 1919), who studied the gas exchange of plants and gave the equation of photosynthesis, which still applies.
6CO2 + 6H2O = C6H12O6 + 6O2
Carbon dioxide + water = sugars + oxygen
According to Métioui et al. (2016), De Saussure introduced the concept of plant nutrition as he explained that the primary source of carbon in a plant is the atmosphere, while the ash components and water come from the soil. In other words, De Saussure, in addition to justifying the role of oxygen and carbon dioxide in the plant processes, also emphasized the role of nutrients taken up by plants from the soil.
The 18th and 19th centuries saw advances in our understanding of the processes of plant
nutrition. According to Antonkiewicz (2016), two theories of plant nutrition emerged. (1) The humus theory of plant nutrition (Albrecht Daniel von Thaer (1752-1828)); (2) the theory of mineral plant nutrition (Justus von Liebig (1803-1873)). Von Thaer believed that humus and water have the primary role in plant nutrition and that minerals do not have a direct role in plant nutrition (PAULI, 1933). He believed that minerals play only a supporting role in forming the humic compounds. Therefore, he believed that the amount of humus is the main factor that defines soil fertility. Justus von Liebig did not agree with the humus theory as he believed that not humus but mineral salts are taken up with water by roots from the soil, and carbon dioxide assimilated from the air in the photosynthesis process are the direct food for plants (Sparks, 2006).
Von Liebig wrongly believed that the ash component defines the value of excreta and that N is not essential in plant nutrition. French chemist and agronomist Jean Baptiste Boussingault (1802-1887) criticized von Liebig’s conviction regarding N (Aulie, 1970). Boussingault, through his research, showed that plant yield is lower in soils deficient in N. Therefore, he believed that N is vital to harvesting higher crop yields. Apart from showing the role of N in plant growth, Boussingault was the first scientist who paid attention to the recycling of nutrients in nature (Aulie, 1970). It is important to note that Boussingault formulated the theory of mineral plant nutrition before Justus von Liebig (before 1840), but unfortunately, it was not published (Antonkiewicz, 2016). It took many years of research before Boussingault’s views on the importance of N were coupled with Liebig’s view on the importance of ash components in plant nutrition, which then formed the basis of today’s mineral plant nutrition.
Liebig and Boussingault are the founders of modern agricultural chemistry. Liebig explained the importance of mineral fertilization in a lecture: “Rome has thrown the entire fertility of Sicily into the gutter” (Antonkiewicz, 2016). In other words, he wanted to say that Rome imported minerals contained in the grains from Sicily, and those minerals, instead of returning to the soil through excreta recycling, ended up into municipal waste. Therefore, the Sicilian soils became the nutrient deficient, and the region became the poorest in the world. Initially, as discussed above, Justus von Liebig did not agree with the humus theory, but later he began to
4
appreciate the role of humus to increase fertility (Wilson, 2014). Today it is common knowledge that natural and organic fertilizers are essential in addition to synthetic fertilizers to maintain and increase soil fertility.
In 1842, German scientist Carl Sprengel (1787-1859) devised the ‘theory of minimum’ in agricultural chemistry (Antonkiewicz, 2016). This theory is now known as ‘Liebig’s law of the minimum.’ According to this, plant growth is limited by the essential nutrient at the lowest concentration. It is important to note that Liebig, as a known researcher, popularized this theory, although the theory was formulated by Sprengel (van der Ploeg et al., 1999). Liebig’s theory of mineral plant nutrition was a critical discovery in agricultural sciences. The discovery of the ‘Law of mineral plant nutrition’ and the ‘Law of the minimum’ laid the foundation for the manufacturing of synthetic fertilizers (Antonkiewicz, 2016). In 1848, the first superphosphate factory was founded in Liverpool, and about a half-century later, the phenomenon of the catalytic production of NH3 from atmospheric N was revealed (by Fritz Haber (1868-1934) and
Carl Bosch (1874-1940)), which led to the production of N fertilizers (Chen et al., 2019).
1.3 Challenges to sustaining nutrient supply to an increasing food demand
The real benefits of understanding the plant nutrition processes and being able to manufacture synthetic fertilizers could only be fully realized in the presence of high-yielding varieties (Hazell, 2010). Rapidly increasing population in the world and the need to supply food gave rise to a challenge in the field of plant breeding and genetics, to develop the plant varieties that were more responsive to plant nutrients (Hazell, 2010). Between the 1960s and 1970s, the period referred to as the green revolution, agricultural production with the use of synthetic fertilizers and pesticides along with improved irrigation techniques and the cultivation of high-yielding varieties of wheat, maize, potatoes and rice with high protein content gave the technological capacity to feed the earth’s population. Only in developing countries, between 1960 and 2000, the yield for wheat increased by 208%, for rice by 109%, for maize by 157%, and for potatoes by 78% (FAO, 2004a). Although most of these achievements are attributed to the improvement in crop germplasm, the best germplasm is of no use without the appropriate agricultural technologies. For example, the development of wheat germplasm in Kenya involved a trait selection based on nutrient and water use efficiency (Dubin and Brennan, 2010). In other words, the achievements of the Green Revolution would not have been possible without proper and adequate access to fertilizers and water, as well as improved agronomic practices. As such, the significant achievements of increased food production correspond to increased use of synthetic fertilizers. For example, in Asia, the use of synthetic fertilizers per hectare was increased by 616% between 1970 and 1995 (Rosegrant and Hazell, 2000).
Although knowledge of plant nutrition and manufacturing synthetic have made a considerable contribution to global food supplies, more than 800 million people lack adequate access to food even today (SOFI, 2005; UN, 2006). The global human population is increasing, and by 2050 there will be an estimated 2 to 2.5 billion new mouths to feed (FAO, 2009a). Future food supplies are now considered a global priority (UN, 2000; IFPRI, 2002b). As such, the rise in the global demand for food will increase the fertilizer need by 1.5% for N, 2.2% for P, and 2.4% for K in the coming five years (FAO, 2017). Limited use of fertilizers in crop production could cause declining crop yields and is already a major cause of food insecurity in poor regions. For
5
example, in Sub-Saharan Africa, 30% of the population is undernourished. The region has one of the lowest fertilizer application rates, and soil nutrient deficiency is widespread over 75% of the agricultural land, causing a substantial decline in crop yields (Smaling et al., 2006). Increased nutrients supply in lower soil fertility regions is essential to be able to harvest high crop yields. However, such increased nutrient supply from synthetic fertilizers is challenging, mainly because they are manufactured from limited fossil resources and are usually expensive. Although nutrient deficit threatening food security is a problem in some countries, nutrient surplus mostly triggered from reduced excreta recycling is a major problem in some other countries (Bateman et al., 2011; Hanserud et al., 2015; Leinonen et al., 2019; Parchomenko and Borsky, 2018; Senthilkumar et al., 2012; van Dijk et al., 2016). Today, only a small proportion of global excreta is recycled back to crops (Cordell et al., 2009; Mihelcic et al., 2011; Sheldrick et al., 2003; van Puijenbroek et al., 2019). As it challenges the sustainability of food production, excessive nutrient input indirectly is a major threat to the future of global food security. The following are some common challenges related to excessive nutrient input in crop production. 1.3.1 Soil degradation
The detrimental impacts of an increased use of synthetic fertilizers were already noticed in the 20th century (Antonkiewicz, 2016). Farmers realized a yield reduction per unit of increased fertilizer application during that time. It is important to note that the buffering and filtering capacity of soils play an important role in providing nutrients for plant growth. An over-application, together with soil acidification,1 can affect the buffering and filtering capacity of
soils and thus the soil's ability to provide nutrients to plants. In addition to the yield reduction, some studies highlighted that unbalanced and excessive fertilization is damaging the harvested crop quality2. Two new fertilizer laws in the 1960s in the field of plant nutrition were discovered
by Andre Voisin (1903-1964), a French scientist (Antonkiewicz, 2016). First, the Law of the Maximum states that an excessive amount of available substance in soil limits the effectiveness of other substances, and thus causes a decrease in the crop yields. Second, the Law of the priority of biological quality states that the main goal of fertilizer use should be to improve the biological quality of the crop product, which is of higher importance than the yield. Antonkiewicz (2016) argues that in present-day agriculture, both those laws are as important as the law of plant nutrition and the law of the minimum.
1.3.2 Eutrophication
The increased use of synthetic fertilizers combined with nutrients in excreta and other wastes resulted in nutrient input being greater than crop nutrient needs in different parts of the world. The resultant surplus increased the nutrient losses to water bodies, causing water pollution, that is commonly known as eutrophication. Most of the scientific developments on eutrophication are quite recent, but the earliest date back to the 1950s (Lemley and Adams, 2019). During the 1970s and 1980s, a large amount of research was conducted into the causes and mechanisms underlying the process of eutrophication in the lakes in the northern hemisphere (Dillon and
1 Soil acidification mainly caused by the atmospheric precipitation of acidifying gases or particles for example
SO2, NH3 and HNO₃, and due to the use of synthetic fertilizers containing these elements (Goulding, 2016). 2 According to Andre Voisin, biological quality is defined as the amount of plant nutrients important for normal
6
Rigler, 1974; Hecky and Kilham, 1988; Schindler, 1974; Vollenweider, 1968). Although it is a slow and natural process (Lampert & Sommer, 1997), the rates of such enrichment have been accelerated mainly because of an increased application of synthetic fertilizers, intensified livestock farming and the subsequent nutrient losses (Svanbäck et al., 2019). The water bodies have limits to assimilate or buffer the nutrient input. Limnological models have been developed to assess nutrient flows at different scales, for example, P in wetlands, rivers, lakes, and marine systems (Robson, 2014). As a result, scientists have developed safety limits for nutrient input at relevant scales. In this context, planetary boundaries define maximum safe nutrient flows at the global scales (Carpenter and Bennett, 2011; De Vries et al., 2013; Rockström et al., 2009; Steffen et al., 2015).
1.3.3 Limited resources
It is a fact that synthetic fertilizers are manufactured directly or indirectly from limited fossil resources; for example, P from phosphate rock and synthesis of N depends heavily on the use of natural gas. It is a common belief among scientists and the general public that P reserves are scarce. P has an essential role in today’s agricultural system, and any scarcity could result in a collapse of global food production and food security (Cordell et al., 2009). There is a continuous debate on the future availability of the phosphate rock. Some say that the P will reach its peak availability in a few years and others say the peak is yet come centuries ahead (Chowdhury et al., 2017; Edixhoven et al., 2014; Geissler et al., 2018). However, there is large consent in its future unavailability being a non-renewable resource, with fluctuating prices, and the total reserves located in a hand-full of countries. Similarly, for manufacturing of synthetic N, natural gas (that is also a limited fossil resource) is an essential component of the Haber-Bosch process (Chen et al., 2019).
1.4 Need for nutrient recycling and increasing distances between supply and demand
In natural terrestrial ecosystems, recycling is a natural phenomenon; an estimate shows that, in the case of P, an atom recycles about 47 times in the ecosystem before it is lost to aquatic bodies (Leopold, 1943). In contrast, in the managed systems of food production, a larger proportion of current global nutrient surpluses come from unrecycled excreta resources (Cordell et al., 2009; Mihelcic et al., 2011; Sheldrick et al., 2003; van Puijenbroek et al., 2019). As such, the challenges discussed above suggest that there is a need to improve the use of nutrients to reduce both nutrient surpluses and deficits in today’s agricultural system. In this context, an increased recycling of excreta nutrients (leading to reduced need for synthetic fertilizers) is an option to reduce the nutrient surplus and thus to solve some of these challenges (Withers et al., 2015a). However, increasing distances between areas of excreta production and crop nutrient need are unfavorable in terms of recycling of the excreta nutrients (Keplinger and Hauck, 2006; Nicholson et al., 2012; Westerman and Bicudo, 2005).
Historians believe that the spread of agriculture (Neolithic Revolution) had resulted in human settlements near the area of agricultural production (Lumen, 2020). In this respect, the introduction of agriculture is said to be the reason for the creation of cities. Evidently, in modern times, technical progress in the form of industrial production of synthetic fertilizers, improved crop varieties, and construction of irrigation canals facilitated the transformation of sparsely populated semi-arid areas into densely populated and intensified agricultural areas, for example,
7
as in Punjab in India (Federico, 2009). Simultaneously, trading of agricultural commodities is as old as the agriculture itself. A recent study suggests a trade of wheat between Mesolithic people of Northern Europe with the Neolithic inhabitants of farther South (Smith et al., 2015). Trading might have transformed the subsistence farmers into market-oriented farmers. Commercialization of agriculture has probably given rise to specialized farming, i.e., farms became specialized either in crop or animal production. Cities and specialized animal farms are dependent on the inflow of food and fodder, respectively. Until the late nineteenth century, most of the food needs of the cities were provided from the nearby agricultural areas (Federico, 2009). In this context, probably the fodder need of farm animals was met from the nearby cultivated lands. Later, the invention of the refrigerator and improvement in transportation infrastructure enabled the transportation of food and feed materials over thousands of kilometers. The concentration of human populations in the form of significant urban settlements and the concentration of livestock production in the form of large factory farms resulted in larger amounts of excreta nutrients produced in the cities and at the farms. Excreta has high water content and lower nutrient concentrations compared to the synthetic fertilizers. Returning of large volumes of excreta is challenged, and these nutrients rarely reach the areas where they are needed.
1.4.1 Previous work on the spatial separation of excreta supply and crop demand
As it is vital to highlight the problem of reduced nutrient recycling, increased use of synthetic fertilizers, and increased nutrient losses, several studies have focused on analyzing the effect of spatial separation of crop nutrient need and excreta nutrient supply in different countries. These studies used both subnational boundaries, for example, using geographic borders of counties, municipalities, or parishes as well as self-defined local boundaries, for example, grids of a specific size in a country. More specifically, Hanserud et al. (2015) estimated spatial separation of crop P need and excreta P supply at the county scale in Norway (the average area of the counties is 29,437 km2). They found that the excreta P balance (excreta P supply minus crop P
need) ranges between -7.0 kg P per ha (in Østfold county) to 11.2 kg P per ha (in Rogaland country) in the country. Senthilkumar et al. (2012) P flows and soil P budgets in agricultural production system at the scale of administrative regions in France (the average area of the regions is 35,172 km2). They showed that P use efficiency in the Brittany region is only half
compared to the P use efficiency in Lorraine regions. They argued that the former region has heavy livestock excreta applications compared to the crop need. In contrast, the latter region has more mixed crop and livestock farming. Bateman et al. (2011) estimated the spatial separation of housed livestock excreta P supply and crop P need in eight regions of England (the average size of the regions is 16,302 km2). They found that the excreta P balance ranges
between -14.4 kg per ha to (in the eastern region) to 2.9 kg per ha (in the northwest region). Parchomenko and Borsky, (2018) investigated the livestock excreta P balance on the parish scale in Denmark (an average area of the parishes is 13 km2). They showed the P balance ranges
between less than 10 kg per ha to more than 50 kg per ha. Leinonen et al., (2019) investigated the hotpots of livestock excreta N and P imbalances at the grid-scale (4 km2) in Scotland. They
found that central and eastern regions have higher crop nutrient needs, while the higher livestock excreta production is located in the southern and northeastern regions of the country.
8
Although these studies investigate spatial balance in a country at subnational and local scales, they did not include the estimates of total distances and costs of excreta transport to even-out the local surpluses and deficits of excreta. Instead, these studies suggest the need for an effective logistic system for excreta transports among the surplus and deficit regions of a country to enhance effective recycling (Bateman et al., 2011; Hanserud et al., 2015; Leinonen et al., 2019). 1.4.2 Previous work on redistribution of excreta
Many studies have investigated the economically viable distance for excreta transports in different countries. In the United States, the economically viable transport distances for excreta have been estimated to be 40 km for swine excreta (Keplinger and Hauck, 2006), 15 to 30 km for excreta from beef cattle (Paudel et al., 2009), 60 km for excreta from dairy production (Keplinger and Hauck, 2006), and 400 km for poultry excreta which is less bulky (Sharpley et al., 2016) and biosolids recovered from wastewater treatment plants may be transported over 2,000 km (Bergendahl et al., 2018). In Canada, this distance for excreta from beef cattle varies in terms of the intended reason of the excreta transports, i.e., 15 to 18 km in terms of meeting crop nutrient need (Freeze and Sommerfeldt, 1985), while this distance is only 12 km from an energy perspective (Pimentel and Pimentel, 2008). In Ireland, Fealy and Schröder, (2008) suggest 50 to 100 km as maximum hauling distance for swine excreta. Shigaki et al. (2006) report 15 km as the commonly economically acceptable radius for livestock excreta transports in Brazil. Some other studies have estimated the redistribution of excreta through optimization modeling. Transport optimization of surplus livestock excreta has been modeled at different spatial scales in different studies – for example, at county scale in the region of Chesapeake Bay Watershed in the United States, (Ribaudo et al., 2011), at district scale in the federal state of Lower Saxony, Germany (Biberacher et al., 2009; Warnecke et al., 2010), and the farm-scale in the state of Louisiana in the United States (Paudel et al., 2009).
Although these studies investigate excreta transports, they did not include the detailed spatial estimates of available excreta resources, crop nutrient need, need for excreta transports, and associated costs at a national scale in a country. However, based on excreta transport analysis made, these studies suggest that the pricing of the transports of excreta largely depends on the excreta characteristics (e.g., dry matter content) and other local factors, for example, regulations regarding excreta treatment and soil application rates, fuel prices, and transport infrastructure (Bloem et al., 2017; Flotats et al., 2009; Sharpley et al., 2016).
1.5 Goals for effective nutrient recycling
1.5.1 Estimating excreta resources compared to crop nutrient need
Global food demand will rise, which in turn increases the need for nutrients to produce more food (FAO, 2017). Increasing food production by closing crop yield gaps has to rely on increased nutrient input for many regions (Mueller et al., 2012; Pradhan et al., 2015). However, the nutrient supply in the form of synthetic fertilizers is constrained due to expensive, limited nutrient resources (Cordell et al., 2009; Schröder et al., 2010). Simultaneously, a nutrient surplus is a major environmental threat in many other parts of the globe (Granstedt, 2000; Mccrackin et al., 2018). What is the potential of available nutrient resources (excreta + synthetic) to help solve the global challenges of reducing nutrient deficits and nutrient
9
surpluses? Note, the current global estimates of global crop nutrient need are based on today’s yield estimates (Bruinsma, 2011; Tenkorang and Lowenberg-Deboer, 2009; Tilman et al., 2011). These estimates generally do not consider the additional crop nutrient needs that are required to close the crop yield gaps on the lower fertility soils (Sanchez, 2002). Moreover, the current estimates do not consider the contribution of soil nutrients of fertile soils in meeting the crop nutrient need (Hanserud et al., 2015). More work is needed to estimate the potential of excreta to close crop yield gaps, and to minimize the nutrient surpluses by reducing the unnecessary use of synthetic fertilizers.
1.5.2 Adjusting the recycling strategies at local scales
Nutrient recycling goals could be different for different nations. The goal could be to improve nutrient supply in order to improve food production or to reduce the nutrient surplus in order to mitigate the problem of nutrient emissions and environmental pollution. For example, in Pakistan, 22% of the population is undernourished, and the country ranks 77th on the global
food security index (EIU, 2014). Crop yields are lower than expected, given the climatic conditions: the current wheat yields in the country are less than half of the expected (Prikhodko and Zrilyi, 2013). Inadequate supply of essential crop nutrients, i.e., N, P, and K, is the leading cause of these yield gaps (Solaiman and Ahmed, 2006). A minor proportion of the livestock and the human excreta are reused in crop production, meaning most of the excreta nutrients are unutilized in the country (FAO, 2004b). For Pakistan, the recycling goal is to find ways to increase the recycling of excreta nutrients to meet the crop nutrient need. In contrast, in Sweden, an increased input of nutrients have been identified as a major source of anthropogenic nutrient load to the Swedish water bodies, and broadly speaking, to the Baltic Sea (Granstedt, 2000; Mccrackin et al., 2018). The recycling goal for Sweden is to eliminate the nutrient surpluses for the sake of environmental health. In summary, spatial nutrient imbalances are highly variable between countries and are linked to different issues. It is important to compare different parts of the world, considering specific recycling objectives in terms of geographic and cultural aspects.
As such, for meeting the global targets of recycling, it is vital to adjust the recycling strategies at national, subnational, and local scales (Häyhä et al., 2016; Kahiluoto et al., 2015). To understand the complete picture of recycling needs, it is necessary to provide quantitative estimates of excreta supply and crop nutrient need at different spatial scales – global, national, subnational, and at local scales. Moreover, it is important to consider the ecological and social facets of nutrient need and supply at the relevant scales. The ecological and social facets of nutrient use at the relevant scales are important to achieve the global targets of sustainable nutrient use (Häyhä et al., 2016).
1.5.3 Finding ways to minimize the costs of complete excreta recycling in a country
In order to reuse excreta in crop production, transports over longer distances are often cited as an economically expensive endeavor (Keplinger and Hauck, 2006; Nicholson et al., 2012; Westerman and Bicudo, 2005). Analyzing cost-optimized transports of surplus excreta to the areas of nutrient need is one way to estimate transport distances and associated costs for increased reuse of excreta (Biberacher et al., 2009; Paudel et al., 2009; Ribaudo et al., 2011; Warnecke et al., 2010). However, the nature of the data inputs to the optimization modeling
10
could affect the results (Harrison et al., 2010; Horritt and Bates, 2001; Metson et al., 2017). As such, estimating transport needs is a difficult issue, and the previous studies have done very coarse estimates without proper spatial analysis. The method for analyzing need and supply may be scale-dependent so that data input may be a sensitive issue. More detailed modeling of the spatial transport needs is needed to give more realistic estimates of the costs involved in an entire country.
11
1.6 Objectives
The overall objectives of this thesis were: i) to investigate the potential of excreta to meet the crop nutrient needs at different spatial scales (global to local), and ii) to analyze the need for excreta transports, total distances and costs, to meet the crop nutrient need in a country.
• What is the quantitative potential of global excreta resources to meet the crop nutrient needs to close the crop yield gaps and to decrease the dependency on synthetic fertilizers?
• What is the quantitative potential of excreta to meet crop nutrient need at subnational and national scales in Pakistan and Sweden? What are the transport needs for complete excreta recycling in a country?
• What is the effect of the input data resolution on the results (transport needs and distances) from a model to optimize excreta redistribution in different geographical and cultural contexts?
12
2 Methods
2.1 Overview
In this study, using spatial data on excreta nutrient supply (excreta refer to both human excreta and livestock manure) 3 and crop nutrient need, we calculated the mass balance4 of N, P, and K
at the national scale across the globe (Paper-I ), at district-scale across Pakistan (Paper-II), at municipal-scale across Sweden (Paper-III), and at 0.083-degree grids across both Sweden and Pakistan, and 5 km by 5 km grids across Sweden (Paper-IV). After calculating the nutrient mass balance, we estimated the transports of surplus excreta from surplus areas to the deficit areas to even out the differences between nutrient surplus and deficits, and to meet the crop nutrient need (Papers II, III, and IV). We analyzed the impact of data resolution in calculating the nutrient surpluses and deficits and compared the distances and costs for transporting surplus excreta at these resolutions in Sweden and Pakistan. Finally, we compared the transport costs and possible savings on synthetic nutrients by reusing all excreta in each of the two countries. 2.2 Spatial resolution
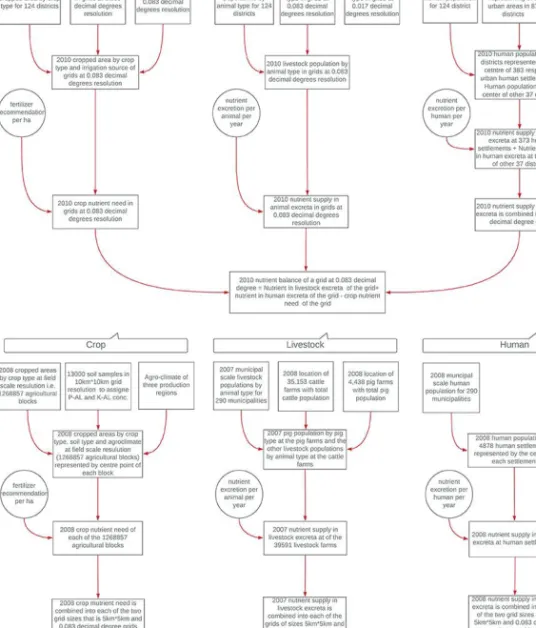
Most of the data was available at multiple resolutions in Sweden but had to be prepared for a higher resolution for some data in Sweden and all data for Pakistan, especially for Paper-IV (Figure 1). The latter was an essential methodological input of this study because mostly high-resolution spatial data was not readily available in developing countries. To prepare the higher-resolution data in Pakistan, we combined the lower-higher-resolution spatial data on crops, livestock, and humans given at the district scale with the higher-resolution data given at a grid-scale. Using transformed gridded data (crop, livestock, and humans), we calculated the gridded nutrient balance. More specifically, in Pakistan, the district scale (political resolution) data (crops, livestock, and humans) transformed to decimal degree resolution (0.083 grids). In Sweden, the information of soil nutrient concentration of P and K, and agroecological regions were combined with the higher resolution crop data. Municipal-scale (political) data for number of livestock and humans were transformed to farm-scale data on number of livestock, and humans at human settlements. Figure (1) gives an overview of the transformation procedure from lower to higher resolution of different types of data in Sweden and Pakistan.
2.3 Excreta nutrient supply
Excreta contains large amounts of plant nutrients, which could be used in crop production. For example, N excretion in livestock excreta was 55 to 80% of the intake, and P excretion was 55 to 90% of the intake, in fodder and feed (Šebek et al., 2014). Almost 100% of the dietary P intake by a human was excreted (Jonsson et al., 2004). Based on the diet and the body type, nutrient excretion rates per individual were highly variable among different regions and countries. For example, P excretion rate by a person in China was almost double than the P excretion rate of a person in Haiti (Jonsson et al., 2004). Similarly, the average excretion rate of cattle, for example, N, in the EU were almost double than the average excretion rates of cattle in Africa (Sheldrick et al., 2003). These excretion rates also differed between different
3 In paper-II we used the term biosupply to refer to both human excreta and livestock manure.
4 In this thesis, the term nutrient balance is defined as nutrient input minus crop need at a specific scale. Inputs
13
categories of livestock species. For example, N excretion rates for dairy cows were more than double the rates for young dairy stocks and more than triple the rates for other cattle in Asia (Gerber et al., 2005).
Figure 1. Data transformations from lower to higher resolution used to calculate nutrient balances in grids in
Sweden and Pakistan. In Pakistan, the political scale (district) data for crops, livestock, and humans were converted to 0.083 decimal degree grids. In Sweden, the higher resolution crop data were transformed to include information of soil type and production region, and political scale (municipal) data for livestock and human were converted to farm livestock type and numbers, and human population to human settlement locations. All these datasets were then converted into crop nutrient needs and excreta nutrient supply and then into the gridded nutrient balances in each country. The figure is adapted from (Akram et al., 2019)
14
In order to calculate the amount of nutrients in excreta, we combined (multiplied) the information of number of individuals of livestock type and human populations (at the respective scales/resolutions) with their respective excretion rates. We excluded the amount of excreta nutrients lost as gas during storage and field application (Paper-I to IV) and amount of the excreta of rangeland livestock populations from the total supply (Paper-I). In this respect, we combined several data sets. For more details of the scales/resolutions and sources of data used to quantify the amount of nutrients (and losses) in excreta, see Table (1).
2.3.1 Losses from excreta
Ammonia (NH3-N) losses could occur during the storage and handling of excreta. NH4+ ions
could form by the microbial hydrolysis of urea and uric acid, and the action of enzyme urease present in the excreta. The NH4+ ions could easily convert to NH3-N gas and thus lead to the
loss of NH3-N from excreta. An increase in excreta pH and temperature could increase the ratio
of dissolved NH3-N to total ammoniacal-N (NH3+NH4) in excreta. The dissolved NH3-N could
be lost from the stored excreta to the environment through volatilization because NH3-N has
lower partial pressure in the air than in the excreta.
The excreta from different animal species could have different pH values (Dai and Karring, 2014). Moreover, there are substantial regional differences in temperature. Thus NH3-N loss
from excreta could be different for different regions and animal species (Bouwman et al., 1997). Most of the recent studies that included NH3-N emission from excreta used the loss factors
developed by Bouwman et al., (1997), for example, in Bouwman et al., (2013) and Liu et al., (2010). These factors were given by regions, i.e., different countries were grouped into different regions with their specific emission factor. In contrast, we used country-specific factors of total volatile losses of N during storage of excreta, which we obtained from FAOSTAT (2019a). Upon spreading, excreta supply both organic-N and inorganic-N to the soil. Plants could readily take up the inorganic form. However, organic-N first needs to be transformed in the soil to ammonium through mineralization before the plants could utilize it. Urease is usually active in the soil and breaks the residual urea and other N compounds. As discussed above, NH4+ could
readily transform to NH3 at higher pH and thus subject to volatilization losses. It is, therefore,
needed to be immediately incorporated into the soil. Nitrate (NO3-) is another inorganic form
of N in excreta. It is readily available to plants. However, it is usually only found in negligible amounts in excreta. Other than gaseous, and field application losses, there are considerable recovery losses in excreta. For example, only 17 to 19% of the global N produced in the livestock excreta was applied to the cropland (Zhang et al., 2017). Most of the non-gaseous losses came from uncollected excreta and excreta used as fuel or building material (Bouwman et al., 2013; Sheldrick et al., 2003). It is important to note that the excreta spread during animals were grazing might be reused in the regrowth of the grass and herbs in the grasslands. However, the amount of excreta dropped during grazing might not match the nutrient need of the grasslands. The excreta could supply more, or even fewer nutrients compared to the actual nutrient need of the grazing lands. There are also nutrient losses from human excreta. A recent estimate suggested that only a minor proportion, i.e., 11% of the N and P in the wastewater, was recovered during the wastewater treatment process at the global scale (van Puijenbroek et
15
al., 2019). Most of the nutrients in the wastewater were lost either to the atmosphere or the global waters. Notably, the differences in nutrient recovery for different nations were massive. Table 1. Primary data sources used to estimate the crop nutrient need and excreta nutrient supply in different Papers.
Paper Excreta nutrient Crop need calculation I Country scale data on the total number of livestock by livestock type were obtained from
the FAOSTAT database (FAOSTAT, 2019b)
In order to calculate nutrient excretion rate by animal type and country we combined three data sets:
1. Country scale data on the N excretion rates per unit of animal mass by livestock type (FAOSTAT, 2019c)
2. Country scale data on the typical animal mass by animal type (FAOSTAT, 2019d) 3. The ratio of P and K over N excretion by livestock type (Sheldrick et al., 2003) We estimated the unavoidable nutrient losses during storage of excreta using gaseous loss emission factor by animal excreta type and country (FAOSTAT, 2019a).
We estimated uncollectable nutrient excretions of the rangelands by country and animal type using three data sets (FAOSTAT, 2019b; Gilbert et al., 2018b, 2018c, 2018d, 2018e, 2018f, 2018g, 2018a; Robinson et al., 2018).
Country scale data on the human population were obtained from (FAOSTAT, 2019e). In order to calculate human excretion rate by a country we used the procedure described by Jonsson et al., (2004) and the data on total protein supply per person per day in a country (obtained from FAOSTAT, (2019f)).
We estimated storage losses of nutrient from human excreta using the loss factors given by Eklind and Kirchmann (2000), Jönsson et al. (2003) and (2000), and Trémolières et al. (1961).
Country scale data on harvested crop areas were obtained from FAO/IIASA (2010), and FAOSTAT (2019g)
We compiled the fertilizer recommendation for the countries, which contributed to the top 70% of the global harvested area each of each crop. There were 91 countries, which contributed to at least the top 70% or more of the global harvested area of each crop. See the complete list of fertilizer recommendation by crop and country in SI material for Paper-I.
II District-scale data on livestock population were obtained from PBS (2012) and (2006). Data on livestock excretion rates were obtained from Gerber et al. (2005)
District-scale data on the human population was obtained from BOS (2014, 2013, 2011, 2010)
Data on human excretion rates were obtained from Jönsson and Vinnerås, (2004) We estimated the gaseous loss of excreta nutrients during storage using the gaseous loss factor obtained from Bouwman et al. (1997).
Data on total district cropped area by crop type were obtained from PBS (2012). Data on fertilizer recommendation by region were obtained from Ashiq (2010) and FAO (2004b).
III Municipal-scale data on livestock populations were obtained from Statistics Sweden (2008).
Data on livestock excretion rates were obtained from Albertsson, (2007) and CBS (2012). Municipal-scale data on human populations were obtained from Statistics Sweden (2017).
Data on human excretion rates were obtained from Jönsson and Vinnerås (2004). We estimated the gaseous loss of excreta nutrients during storage using the gaseous loss factor obtained from Jakobsson and Steineck (2012).
Municipal-scale data on crop areas by crop type were obtained from Statistics Sweden (2011).
Data on soil nutrient concentration were obtained from Swedish Board of Agriculture (2017).
Data on the agroclimatic region were obtained from Ericsson (1988). Data on fertilizer recommendation by soil type and the agroclimatic region were obtained from Albertsson (2007). IV For Sweden, we converted low-resolution municipal-scale livestock population data
(used in Paper-III) to farm level livestock population (JBV, 2018a).
For Sweden, we converted low-resolution municipal scale human population data (used in Paper-III) to high-resolution human population at human settlement data (SCB, 2010). For Pakistan, we converted low-resolution district-scale data (used in Paper-II) to high resolution gridded (Robinson and Conchedda, 2011; Robinson et al., 2014). For Pakistan, we converted low-resolution district human population data (used in Paper-II) to high-resolution human population at human settlements data (Robinson and Conchedda, 2011).
We estimated the gaseous loss of excreta nutrients during storage using the gaseous loss factor obtained from Bouwman et al. (1997) for both countries.
The data on the excretions rates were obtained from the same sources as in Paper-II and Paper-III for the respective countries.
We obtained the Swedish high-resolution data on crop area by crop type in the agricultural blocks from JBV, (2018b). We used the same data source of the agroclimatic region and soil nutrient concentration as in Paper-III.
For Pakistan, we converted low-resolution district data (used in Paper-II) to high-resolution gridded data using (FAO/IIASA, 2010).
The data on the fertilizer recommendations were obtained from the same sources as in Paper-II and Paper-III for the respective countries.
Most of the studies today accounted for the total amount of nutrients in excreta when estimating the excreta potential for reuse in crop production and in calculating nutrient balance (OECD & Eurostat, 2007). However, the method of excreta collection and storage processes might have a considerable impact on nutrient losses. Moreover, a considerable amount of nutrients was not
16
readily available to crops during the first year of application. That was mostly because the nutrients shift forms into different compounds in the soil over time, and plants were only able to use some of these nutrients (Wilson, 2018). In other words, in the mineralization process, microbes transform organic nutrients into inorganic forms, and this process could take several years, depending on soil and excreta characteristics. In this respect, the method of excreta application might also affect the plant availability of nutrients for a given time. For example, in Sweden, it was required by law to incorporate the excreta into the soil within 12 hours of field application (Nilsson, 2013). In this respect, in Sweden, over 55% N in excreta, 80% of excreta P, and 90% of excreta K (depending on the excreta type) could become crop available in the first year of its application (Wilson 2018).
2.4 Crop nutrient need
Most of the current global estimates of crop nutrient need were based either on food consumption (Bruinsma, 2011), known relationships between crop nutrient use and gross domestic product (Tilman et al., 2011), or relationships between application rates and the crop output (Tenkorang and Lowenberg-Deboer, 2009). However, such approaches seem inaccurate, considering the need to close nutrient-related crop yield gaps. Because they were based on statistics and might contain data that belongs to crop fields that had have not received enough fertilizers. Estimating crop nutrient need at the current yields discounted the chances of improving the crop yield. Sanchez (2002) argued that in areas losing fertility, the crop nutrient needs assessments should include the fertilizers needed to bring the agricultural land back to fertility levels. Moreover, the existing approaches ignored the nutrient reserves of the soils that were overapplied in the past. These soil nutrients could contribute to improving crop yields. For example, in Sweden, there were seven types of soil based on the P concentration and five types of soil based on the K concentration (Swedish Board of Agriculture and JBV, 2017). Fertilizer recommendations for different soils were profoundly different. For example, for winter wheat, for the soils with the highest P concentration, the recommendation for P was zero, while for the soils with the lowest P concentration in the country it was 38 kg per ha (Albertsson, 2007).
We believed that the existing approaches were not appropriate for estimating the crop nutrient need to harvest higher crop yields. Those approaches did not reflect the efficient use of the available soil nutrients. For example, we might need to apply less nutrients than what was expected in the crop harvest from fertile soils or soils which were heavily fertilized in the past. More recent studies had started to estimate the crop nutrient need based on fertilizer recommendation, for example, Trimmer and Guest, (2018). Trimmer and Guest, (2018), used a median value of fertilizer recommendations for a crop grown in different countries and estimated the global crop nutrient need. Considering the effect of substantial regional differences in climate and soils, we decided to use more specific fertilizer recommendations. More specifically, we used country-specific fertilizer recommendations at the global scale (Paper-I) and region-specific in Sweden and Pakistan (Papers II, III, and IV). We assumed that the fertilizer recommendation values were prepared according to local climatic and soil conditions in order to harvest the highest possible yields.