J
Ö N K Ö P I N GI
N T E R N A T I O N A LB
U S I N E S SS
C H O O L JÖNKÖPI NG UNIVER SITYI n v e s t m e n t P e r f o r m a n c e o f
S w e d i s h F a m i l y F i r m s
A s t u d y o f h o w m a n a g e m e n t , c o n t r o l a n d
o w n e r s h i p i m p a c t S w e d i s h f a m i l y f i r m s i n v e s t m e n t
p e r f o r m a n c e
Master Thesis in Economics Author: Ibteesam Hossain
Tutor: Professor Per-Olof Bjuggren PhD Candidate Johan Eklund
Master Thesis in E Master Thesis in E Master Thesis in E
Master Thesis in Economicsconomicsconomics conomics Title:
Title: Title:
Title: Investment Performance of Investment Performance of Investment Performance of Investment Performance of Swedish family firms. A studSwedish family firms. A studSwedish family firms. A study of how Swedish family firms. A study of how y of how y of how management, control and
management, control and management, control and
management, control and ownership ownership ownership impact Swedish family firms ownership impact Swedish family firms impact Swedish family firms impact Swedish family firms investment
investment investment
investment performance. performance. performance. performance. Author:
Author: Author:
Author: Ibteesam HossainIbteesam HossainIbteesam HossainIbteesam Hossain Tutors:
Tutors: Tutors:
Tutors: Professor PerProfessor PerProfessor Per----Olof BjuProfessor Per Olof BjuOlof Bjuggren, PhDOlof Bjuggren, PhDggren, PhDggren, PhD Candidate Candidate H Candidate Candidate H Helena Bohman and Helena Bohman and elena Bohman and elena Bohman and PhD
PhD PhD
PhD Candidate Candidate Candidate Candidate Johan EklundJohan EklundJohan EklundJohan Eklund Date:
Date: Date:
Date: OcOcOcOctober 2007tober 2007tober 2007 tober 2007 Subject:
Subject: Subject:
Subject: Swedish family firms, management, control, ownership, Swedish family firms, management, control, ownership, Swedish family firms, management, control, ownership, Swedish family firms, management, control, ownership, mmmmarginal arginal arginal qqqq arginal
Abstract Abstract Abstract Abstract
This thesis investigates how Swedish family firms’ investment performances are affected by their management, control and ownership structures. This has been done by analyzing 90 Swedish firms over a 15 year time period (1990-2005).
Three management structures have been estimated for the management area. The results for the first structure founder management showed that Swedish family firms’ investment performance is positively affected if the founder is either the Chief Executive Officer (CEO), Chief Executive Board member (COB) or both in the firm. An explanation given for this is that founders hold an entrepreneurial spirit and know-how that other managers do not have. For the second structure descendant management, regression results showed that if a descendant served as the CEO, COB or both in the firm it had a negative impact on the firms’ investment performance. This is explained by descendants being selected as managers due to their family relation to the founder and not their know-how and
experience in the area. The results for the third management structure, external managers hired into family firms, showed no significant impact on the investment performance. Analyzing for control and ownership (estimated by vote-rights and cash-flow rights) a distinction was made between family firms with and without vote differentiation. The results showed that if a founder served as the CEO, COB or both in firms without vote differentiation there were a positive affect on the firms’ investment performance by founders reducing the agency cost and minority expropriation. The same findings were made for external mangers managing firms with vote differentiation.
Magi Magi Magi
Magister Uster Uster Uster Uppsats inom ppsats inom ppsats inom Nationalekonomippsats inom NationalekonomiNationalekonomiNationalekonomi Titel
Titel Titel
Titel: : : : Svenska familjeSvenska familjeSvenska familjeSvenska familjeföretag. En studie om hur ledarskap, kontroll och företag. En studie om hur ledarskap, kontroll och företag. En studie om hur ledarskap, kontroll och företag. En studie om hur ledarskap, kontroll och ägarskap p
ägarskap p ägarskap p
ägarskap pååååverkar svenska familjeverkar svenska familjeverkar svenska familjeföretags verkar svenska familjeföretags företags investeringsföretags investeringsinvesteringsinvesterings prestation. prestation. prestation. prestation. Författare
Författare Författare
Författare: : : : Ibteesam Ibteesam Ibteesam Ibteesam HossainHossainHossainHossain H
H H
Handledareandledareandledare: andledare: : : Professor PerProfessor PerProfessor PerProfessor Per----Olof Bjuggren, Helena Olof Bjuggren, Helena Bohman och Olof Bjuggren, Helena Olof Bjuggren, Helena Bohman och Bohman och Bohman och JJJJoooohan Eklundhan Eklundhan Eklund han Eklund Datum
Datum Datum
Datum: : : : Oktober 2007Oktober 2007Oktober 2007Oktober 2007 Ämnesord:
Ämnesord: Ämnesord:
Ämnesord: Svenska familjeSvenska familjeSvenska familjeSvenska familjefffföretag, ledarskap, kontroll, öretag, ledarskap, kontroll, öretag, ledarskap, kontroll, öretag, ledarskap, kontroll, ägarskap, ägarskap, ägarskap, mägarskap, mmmarginella arginella arginella qqqq arginella
Sammanfattning Sammanfattning Sammanfattning Sammanfattning
Denna magister uppsats undersöker huruvida ledarskap, ägarstruktur och kontroll påverkar svenska familjeföretags investerings prestation på marknaden. I undersökningen har 90 svenska företag analyserats inom en 15 års period (1990-2005).
Ledarskap har delats upp i tre olika strukturer, den första strukturen står för grundar ledarskap. Regressionsanalysen i denna uppsats visade att en grundare har en positiv påverkan på företagets investerings prestation då grundaren agerade som Verkställande Direktör (VD), Styrelseordförande (SO) eller båda. Detta kan förklaras utifrån teorier som gör tydligt att en grundare äger entreprenörskaps anda och utmärkande kunskaper inom området ifråga. Resultatet för den andra strukturen, ättlings ledarskap visade att då ättlingar till grunderaren verkade som antingen VD, SO eller båda i företaget förekom en negativ påverkan på företagets finansiella prestation. Detta kan förklaras utifrån teorier som menar att en ättling inte har samma kunskap eller ambitioner som grundaren till företaget. Ättlingar har oftast ärvt högre poster inom företagen på grund av sina familjerelationer till grundaren snarare än på grund av sina kunskaper inom området. Den tredje ledarskapsstrukturen är externa ledare. Externa ledare är antingen en VD, SO eller båda som har blivit inhyrda till företaget av ägarfamiljen. Regressionsanalysen visade ett insignifikant resultat.
När resultaten för ägarstruktur och andel röster av ägare analyserades i både företag med röstdifferensiering och utan röstdifferensiering visade det sig att när grundaren agerade som VD, SO eller båda i företag utan röstdifferensiering förekom ingen minoritets expropriation eller principal-agent konflikter inom företaget, vilket betyder att företagets finansiella prestation påverkades positivt. Liknande resultat hittades även för företag med röstdifferensiering som hade externa ledare i sin ledning.
Table of Contents
1 Introduction ... 1
1.1 Background ...1
1.2 Presentation of the research problems...1
1.3 Earlier Research...2 1.3.1 Management ...2 1.3.2 Control...2 1.3.3 Ownerahip ...3 1.5 Outline of Thesis...3
2 Theoretical Framework ... 4
2.1 Family Firm Definition...4
2.2 Family Firm Sub-groups ...4
2.3 The Ownership Model of Sweden ...6
2.4 Management ...7
2.4.1 The Management by a Founder ...7
2.4.2 The Management by a Descendant ...8
2.4.3 The Management by an External manager ...8
2.5 Control...9
2.5.1 Agency theory and Minority Expropriation ...9
2.6 Ownership ...10
2.6.1 The Principal-Agency Conflict and Minority Expropriation ...10
3 Regression Model ... 11
3.1 Sample and Data collection...11
3.2 Marginal q model ...12
3.3 Definition of Regression variables ...14
3.4 Descriptive data ...16
4 Regression analysis... 20
4.1 Panel regression...20 4.2 Hypothesis...21 4.3 Regression Results ...225 Conclusion... 26
6 Suggestions to Further Research ... 28
Figures
2.1 Family Firm Tree ...5
Tables
3.1 Variable definition…. ...14 3.2 Non-family firms…. ...16 3.3 Family firms…. ...17 3.4 Correlation matrix …...19 4.1 Hypothesis table…. ...21 4.2 Regression results …. ...22 4.3 Comparison Table…...25Appendix
Appendix 1…...31 Appendix 2…...34 Appendix 3…...351 Introduction
This chapter gives an introduction of the thesis to the reader. The research problem, including the purpose is defined as well as the outline of the thesis is presented.
1.1 Background
In today’s economy family firms and their performance around the world is a highly discussed topic. New interesting studies have been published during the last years and Jönköping International Business School is one of the leading research centres for their type of studies. (ESBRI, 2003)
Family firms have been described as the backbone of the Swedish economy (ibid). According to Emling (2000) Swedish family firms are estimated to account for half of the annual GDP growth in the private sector. Not only in Sweden but all over the world family firms are seen as leading economic developers.
In U.S 2003, 80 per cent of all firms were family controlled or family owned (when following the definition of Anderson and Reeb, 2003a). On the stock exchange and in the Standard & Poors 500 Industrial list from 2003 more than 35 per cent were listed as family owned firms however, the number has been decreasing over the years (ibid). In Sweden 2006, 34 per cent of the enlisted firms on the OMX Large Cap index were family firms (Affärsdata, 2006). What is exceptional for Swedish family firms unlike family firms in other parts of the world are dual-class shares. These are shares structured with different voting power from diverse share classes, a thorough explanation of this can be found in chapter two under The Ownership Model of Sweden.
1.2 Presentation of the research problems
The purpose of this thesis is to study three governance aspects of the family firm. How family management, ownership and control affect the family firm’s investment performance.
1. Management:Management:Management:Management: Study if there is a difference in the firm’s investment performance if the firm’s founder is serving as the CEO and/or COB, compared to if the firm is run by a descendant to the founder or an external manager in the same position. 2. Control:Control:Control:Control: Study how founder and descendants and external managers affect family
firms’ investment performance by looking at the voting right of the largest owner in both vote differentiated firms and non-vote differentiated firms.
3. Ownership:Ownership:Ownership:Ownership: Study how founders and descendants and external managers affect family firms’ investment performance by looking at the cash-flow rights of the largest owner in both vote differentiated firms and non-vote differentiated firms.
To be able to examine the three purposes Mueller’s and Reardon’s (1993) and Mueller (2003) marginal q model is used. To limit the study the focus will be on 90 Swedish firms during a time period between 1990 and 2005. By using marginal q this thesis stands out from previous researches. Researches published in Sweden within this area have estimated firm value by using Tobin’s Q and thereby estimated for the firms’ financial performance. In this paper firm value will be estimated by looking at firms’ investment performance (another performance measure), this is done by using marginal q. The differences between Tobin’s Q and marginal q are discussed further in the third chapter.
1.3 Earlier Research
There are several different studies done in this particular subject both on an international and national level. In order to give the reader a more in-depth knowledge of the subject previous studies dealing with the three governance aspects will be presented.
1.3.1 Management
During recent years there have been many studies done investigating family firms and the relationship between management and firms’ performances. In 2003(a) Anderson and Reeb established that when a family member (founder or descendant) served as the CEO the firm’s performance were significantly enhanced compared to when an external manager served as the CEO. The financial market performance of a family firm with the founder as the CEO appeared however to be higher than when a descendant served as the CEO. Villalonga and Amit (2006) have also done a similar research where Fortune 500 firms were analyzed. Their results showed that family control in a firm increased the financial performance but only when the founder was serving as the CEO and/or COB and given that a descendent did not serve as the CEO.
Furthermore, a study by Perez Gonzalez in 2002 showed that family descendants that had a CEO position damaged the firm’s financial performance. The firms return on assets, decreased by 18 per cent within three years compared to when an external manager took over as the CEO.
From a Swedish perspective, Andersson and Nyberg (2005) were the first to present a comprehensive study of ownership, control and management in Swedish family firms. They established that there was no significant evidence to support a positive founder management performance compared to having external managers in the firm.
1.3.2 Control
Andersson and Nyberg (2005) also investigated if family control had an impact on Swedish family firms’ financial performance, their results showed a negative impact. The voting power of the controlling family had a negative correlation with the firms’ financial performance, the negative effect of this was higher for founder family firms than non founder family firms.
Anderson and Reeb (2003b) showed a positive relation between founder family ownership and financial performance. They could also conclude that founder family firms had a better market performance compared to non-family firms. Two explanations were given for this. The first explanation stated that family control in the firm alleviated the agency differences between managers and owners of the firm and secondly founder families left firms that performed poorly. A study by Villalonga and Amit (2006), found that family control had a higher impact on family firms than in non-family firms.
1.3.3 Ownership
There are several studies of how ownership affects a firm’s financial performance. One of the more interesting studies, done by Anderson and Reeb (2003a) showed that there was no considerable effect on the financial performance of a firm when the family had the majority of the ownership (cash-flow). However, they stated that family ownership was a beneficial organizational structure from which both management and shareholders were benefited. Villalonga and Amit (2006) showed that there was a positive effect of family ownership and firm financial performance. In their paper it was concluded that minority shareholders in family firms were better off than in non family firms. On the contrary, Andersson and Nyberg (2005) found that family ownership was unrelated to the financial performance of the family firms.
1.4 Outline of thesis
To be able to study management, control and ownership affects on family firms’ investment performance the rest of the thesis is organized as follows.
The second chapter of the thesis presents the theoretical framework where the term family firm is clearly described, followed by an introduction to the ownership model of Sweden. This is done to give a clear view of how family firms in Sweden function and also later in the paper be able to discuss the ownership effect on firms’ investment performances. Theories of family firm management, control and ownership are also presented. The third chapter is devoted to the regression model that is used for the analytical part of the thesis. The reader will also be introduced to the variables that are used in the regression model and also a section devoted to the descriptive statistics. In the fourth chapter the regression analysis is presented. In chapter five a conclusion of the three governance aspects of the thesis is presented. In the final chapter, suggestions to further research are presented.
2 Theoretical Framework
In this chapter the definition of family firm will be clearly stated, a family firm tree figure is presented to give the reader a visual description of different types of family firms. A section describing the Swedish ownership model is also included followed by theories explaining the three main governance aspects management, control and ownership.
2.1 Family Firm Definition
There are several different ways to define a family firm, however there is none that are cut in stone. Villalonga and Amit (2006) have defined a family firm as a firm that has the founder of the firm, a blood related or a relative that is married into the firm working as a manager or a block holder. Cronqvist and Nilsson (2003) stated that when a family member to the founder has at least 25 per cent of the firms’ votes they have the main influence of the firm implying that the firm is a family firm. Andersson and Nyberg (2005) define family firms as those where a person from the family (founder or descendant) is a controlling shareholder using a 25 per cent threshold for the largest controlling owner. Astrachan and Shanker (2003), have set up several criteria’s which are commonly used when defining family firms. The first criterion is how much percentage of ownership the founder family has in the firm, the second criterion is if the family has strategic control over the firm and the third takes the family’s involvement and intention to keep the firm within the family into account.
The definition used for this thesis has two criteria’s that are taken into account. If one of these two criteria’s or both is achieved by the firm in question the firm is regarded as a family firm. The first criterion is management structure, if the founder or descendant serves as the CEO and/or COB the firm it is labelled as a family firm. The second criterion is controlling shares, if the largest controlling shareholder is the founder or from the founder family and holds 20 per cent or more of the controlling shares in the firm the firm in question is then labelled as a family firm.
2.2 Family Firm Sub-groups
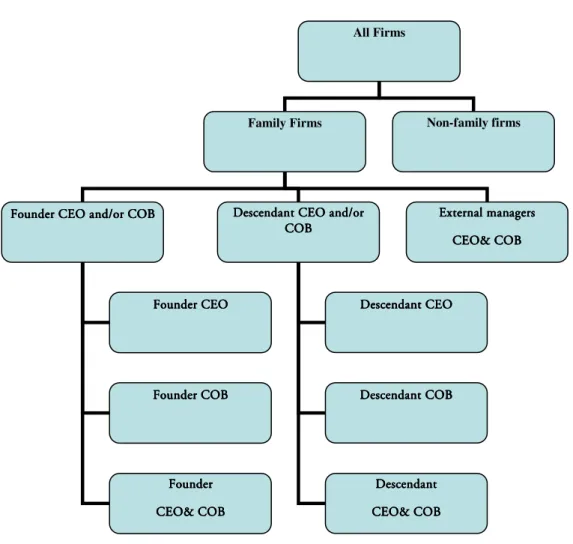
To be able to give the reader a clear understanding of the forthcoming study of family firms and their management structure a family firm tree figure (figure 2.1 on page 5) inspired by Andersson and Nyberg (2005) is given. This figure breaks down family firms into several sub-groups and will give the reader a visual description of the firm structures.
First First First
First, the top group in the tree is All Firms which is then divided in to Family Firms and Non-Family Firms.
Second Second Second
Second, Family Firms are split into three different categories depending on the management structure.
1. Founder CEO and/or COB 2. Descendant CEO and/or COB
3. Hired CEO and/or COB Third
Third Third
Third, The Founder CEO and/or COB sub groups and Descendant CEO and/or COB are then divided in to three other sub-groups. These groups show if the founder or a
descendant manager is the CEO, COB or both.
Figure 2 Figure 2 Figure 2
Figure 2.1.1.1.1 Family Firm Tree Family Firm Tree Family Firm Tree Family Firm Tree
Source: Anderson and Nyberg (2005) (Modified version)
All Firms
Family Firms Non-family firms
Founder CEO and/or COB Founder CEO and/or COB Founder CEO and/or COB
Founder CEO and/or COB Descendant CEO and/or Descendant CEO and/or Descendant CEO and/or Descendant CEO and/or COB
COB COB COB
External managers External managers External managers External managers CEO& COB CEO& COB CEO& COB CEO& COB Founder CEO Founder CEO Founder CEO Founder CEO Founder COB Founder COB Founder COB Founder COB Founder Founder Founder Founder CEO& COB CEO& COB CEO& COB CEO& COB Descendant CEO Descendant CEO Descendant CEO Descendant CEO Descendant COB Descendant COB Descendant COB Descendant COB Descenda Descenda Descenda Descendant nt nt nt CEO& COB CEO& COB CEO& COB CEO& COB
2.3 The Ownership Model of Sweden
The Swedish ownership model follows the Continental European pattern where the owners have a very concentrated ownership. In the majority of the European countries the companies are dominated by one controlling owner often a family who recruits management and influences the election of board members (Andersson and Nyberg, 2005). Unlike other countries Sweden is an interesting case because of their frequent use of different control and ownership methods. These methods are:
1. Differential voting rights = rights to dividend and/or voting differentiation 2. Cross shareholdings = Two companies mutually holds each others shares 3. Pyramid structure = separates control from ownership via a hierarchical chain. (Bjuggren and Palmberg, 2007)
The Swedish ownership model is often mentioned when discussing controlling minority shareholders, which are owners that are in control in terms of company votes while owning a share of the cash-flow rights (Högfeldt, 2004). According to Söderström et al., (2003) over 90 per cent of the companies in the Stockholm Stock Exchange have a distinct owner/s that control/s at least 25 per cent of company votes. The larger companies in the stock market are controlled by bank spheres and financially established families in their 3rd
-5th
generation, one example of these families is the Wallenberg family.
In the 1980s many firms started to implement dual class shares as a response to the expectations of joining the European Union. When comparing to other firm structures the family firms have proven to show a tendency to implement further control devices which is one of the reasons for why the same family can be in control for several generations (Cronqvist and Nilsson, 2003).
The legal system of corporate governance is very different from country to country this includes what dividend, voting and control rights a shareholder have and how these are protected. The Scandinavian civil law provides better shareholder protection than other countries holding a civil law system (La Porta et al., 1998). According to Andersson and Nyberg (2005), Swedish corporations are transparent where the information of shareholders and owners are publicly available from for example The Swedish Company Registration Office. By making the company information publicly available it is assumed by the authors that immoral behaviour as personal benefits and corruption within companies and shareholders are prevented. The Swedish law has always promoted strong private ownership. The belief is that a strong set of owners are more profitable and controlling shareholders are loyal to the firm which makes these implemented strategies maximize long term firm performance. (ibid)
Another reason to promote private ownership is to keep the control of Swedish firms out of reach from foreign investors. Hence the Swedish legal system encourages firms to apply control enhancing mechanisms as corporate pyramids and dual class shares. This separates ownership and control and allows financially restricted entrepreneurs to turn to the external market and lend money without loosing their control within the firm. Pyramidal structure is such a device that separates the control level in the firm with the capital invested in the firm. A combination of dual class shares and corporate pyramids creates an even larger difference between voting power and the invested capital.(ibid)
The critique that exists against the Swedish ownership model is that strong controlling owners can take advantage of minority shareholders by controlling a large amount of vote power while and at the same time only acquire a small portion of equity shares. This is can be accomplished by dual classes of shares and pyramid ownership. (Andersson and Nyberg, 2005)
2.4 Management
To examine if there is a difference in how a firm performs financially when looking at the management structures, diverse theories of what different types of management can bring to the firm are presented.
There are three different ways a family firm can be managed, they are: 1. Managed by the founder of the firm
2. Managed by the founders descendant’s (defined as anyone with a family bond to the founder)
3. Managed by external managers
2.4.1 Management by a Founder
According to Grebel, Pyka and Hanusch (2003), a founder is an entrepreneur that has three significant basic endowments that helps a firm to be able to grow and succeed. These are:
• Entrepreneurial spirit: a founder is assumed to having an entrepreneurial spirit which enhance the growth of the firm
• Human capital: is the unique know-how and skills that the founder brings to the firm
• Venture capital: is the sum of the entrepreneur’s personal funds and the amount of capital that can be raised by the founder.
A founder is assumed to have a unique characteristic that positively affects firm’s investment performance. The founders have expertise and entrepreneurial abilities to apply to the firm which is required for a successful growing firm. (Villalonga and Amit, 2006) Therefore hypothesis one for this thesis will be:
Hypothesis 1: A family firm with the founder functioning as the CEO and/or COB have a positive impact of a firms’ investment performance.
2.4.2 Management by a Descendant
According to Burkat, Panunzi, and Shleifer (2003), a resigning founder has three options of handing over the firm when there are no buyers: (i) S/he can sell the firm on the capital market, (ii) s/he can hire an external manager to run the firm, (iii) or finally the founder can appoint a family member to take the managerial position.
It is assumed in the model by Burkat, Panunzi, and Shleifer, (2003) that founders increase their own welfare when selling to outside investors if the family keeps the control. It is also said that by handing the firm over to the founder’s successors a firm will be able to reduce their agency cost. Agency cost in a firm is an internal cost that arises due to conflicts of interest between a firm’s shareholders and management. Issues as shareholders wanting the share value to be maximized clashes with managers rather wanting to increase firm value by maximizing their personal wealth.
When a founder hands over the firm to a relative it is said that it is easier for the new manager to comprehend what the firm’s beliefs and future prospect are, it is also easier for the new manager to understand the management shareholder relationship, and hence it reduces the agency cost. However if the elected manager from the family has no experience in the area and is only elected due to his/hers family bond to the firm it is clear that the firm will be financially affected. (Andersson and Nyberg, 2005)
The second hypothesis for the paper will be stated as:
Hypothesis 2: A family firm with a descendant functioning as the CEO and/or COB have a negative impact on the firms’ investment performance than a family firm with the founder functioning as the CEO and/or COB.
2.4.3 Management by an External manager
As mentioned, appointing a family member a managerial position can be costly if the family member does not have the right skills and there by makes inferior decisions. The cost is then borne by the minority investors. Therefore in many cases an external manager with the proper knowledge and business know-how, should have the ability to manage the family firm with a more positive investment result than family descendants of the founder. (Perez-Gonzalez, 2002)
However, as early as 1776 Adam Smith argued in his book Wealth of Nations that it should not be expected that external managers that supervise the money of a private firm will have the same willingness and caution to watch over it as the owners of the firm watching over their own money (Cannan, 1937).
The third hypothesis for this paper is then:
Hypothesis 3: A family firm with an external manager functioning as the CEO and/or COB have a negative impact on the firms’ investment performance than a family firm with the founder functioning as the CEO and/or COB.
2.5 Control
Family control can have two different counteracting effects; the first is the principal agent problem which is the conflict between managers and shareholders concerning contradictory incentives for value maximization. The second effect is the minority expropriation which is the controlling shareholder’s withdrawal of personal benefits from the firm. The cost of the withdrawal is borne by the minority shareholders (Andersson and Nyberg, 2005). These two effects will be explained in more detail in the following part.
2.5.1 Agency theory and Minority Expropriation
The agency theory was founded by Jensen and Meckling in 1976, and is now a central part of economic theory of corporate governance (Bertilsson and Nosratlu, 2004). According to Jensen and Meckling (1976), agency relationship is a type of contract where the principal appoint the agent, to perform a certain task on their behalf. In this case the principal is the shareholders and the agent is the managers. The managers are delegated responsibility; the problem that can arise is managers attempting to maximize their personal wealth and utility which creates a principal-agent conflict. (Jensen and Meckler ,1976)
According to Andersson and Nyberg (2005), if the owner of the firm is present and controlling the management, s/he will serve in the best interest of the shareholders. If a firm is based on a scattered management pattern rational ignorance will take place leading to shareholders not monitoring their investments due to the disorganized structure. This is what is called the free-rider problem (Bade and Parkin, 2004) and it affects all shareholders based on how large their cash-flow rights are in the firm. However, Sweden is dominated by a system where strong ownership is promoted which is supposed to solve the free rider issue and diminishes the principal agent conflict cost (Andersson and Nyberg, 2005). According to Hagelin et al.,(2004), Swedish family firm owners’ decreases their personal portfolio risk when issuing low voting stock and allocating the family to preserve the control. The monitoring cost is assumed to be low.
The second effect is the minority expropriation. As mentioned above the minority shareholders bare the cost of expropriation. By private benefits of control, the controlling shareholders can increase their utility and private wealth. Hence, controlling owners can get personal financial benefits and non-financial personal benefits from the company. (Erhardt and Nowak, 2003)
Combining the control theories with the three management structures hypothesis 4-6 is states as:
Hypothesis 4: A founders voting power (control) in his/hers firm has a positive effect on the
firms’ investment performance.
Hypothesis 5: A descendants voting power (control) in the firm s/he is managing has a negative effect on the firms’ investment performance.
Hypothesis 6: An external manager voting power (control) in the firm s/he is managing has a
2.6 Ownership
Family ownership is assumed to decrease the principal agent conflict. It is also believed that family ownership reduces minority expropriation. (Andersson and Nyberg, 2005)
2.6.1 The Principal Agent Conflict and Minority Expropriation
Controlling owners in a firm will base their motivation for management efficiency on their proportion of the firm’s cash-flow rights. According to Andersson and Nyberg (2005), the more cash-flow rights held by a share holder the stronger incentive they have for monitoring the firm’s management. If the owner and managers are aligned in how to run the firm, the controlling owner may protect the incompetent managers at a low cost if there is a low level of cash-flow rights combined with control. A controlling owner will only protect the more inefficient manager when the cost of choosing the inefficient manager outweighs the cost of reduced cash-flow in the future.
This kind of situation could appear when the controlling shareholder has a family connection to the manager. If a firm is family owned it is assumed that they can serve as better monitor when they hold a higher portion of total cash-flow rights and this applies when the firm is run by external managers and not family members. (ibid)
Hypothesis 7-8 is based on the family and ownership correlation and is stated as:
Hypothesis 7: The founders’ level of cash-flow rights (ownership) in the firm that s/he is
managing has a positive effect on the firms’ investment performance.
Hypothesis 8: The descendants’ level of cash-flow rights (ownership) in the firm that s/he is
managing has a positive effect on the firms’ investment performance.
La Porta et al., (2002) stated that controlling shareholders with low portion of cash-flow rights have larger incentives for expropriating if the legal minority protection is weak and the expected costs are low.
External managers are also studied when taking ownership into account. The final hypothesis is stated as.
Hypothesis 9: The external manager’s level of cash-flow rights (ownership) in the firm that s/he
3 Regression Model
This chapter is devoted to explain the regression model for this thesis which is Mueller and Reardon’s (1993) and Mueller (2003) Marginal q model. In this chapter the data collection process is first described. A section describing the variables for the panel regression used in the thesis is also presented. The last part of the chapter is devoted to explain the descriptive statistics.
3.1 Sample and Data collection
The sample for this regression contains of 90 Swedish firms during the time period of 1990-2005. The selected firms are shown in appendix 1. All firms are traded on the A-list and O-list.
There were three main phases of the data collection:
1. The first phase was dedicated to collect start-year and founder data. The start-year and founder data was collected from the firm’s websites. In the cases where the information was not available I personally contacted the firms by either phone or e-mail to get hold of the information.
2. The second phase was to collect the financial data; this was done from Standard & Poor’s Compustat Global Database. The data collected was first divided with the CPI index (base year 1989) to include market effects and then lagged (explained further in the model explanation) to be able to calculate the change in market value. Outliers above 1.5 and -1.5 were removed in order to exclude inaccuracy in the data.
3. The third phase was mainly focused on the management, ownership and control data. Firstly, the names of the CEO’s and COB’s were collected for each year and firm, for the management data. Secondly, the names and percentage shares (vote rights and cash-flow) of the largest owner were collected for the ownership and control data. The data for all these three variables for the time period 1990-2005 was gathered from “Owners and Power in Sweden’s Listed Companies” (1990-2005) written by Sundin and Sundqvist.
3.2 Marginal q model
To be able to analyze the three areas of this paper the marginal q model will be used, which is also used by Eklund (2007) in his paper Corporate Governance and Investments in Scandinavia. The marginal q methodology was developed by Mueller and Reardon (1993), and is essentially the marginal version of Tobin’s Q. The model methodology is shown below to give the readers an insight of how the empirical analysis has been performed. The marginal q model shows the marginal change in the market value of a firm due to an investment and is a more suitable measure of performance than Tobin’s average q because average q includes infra- marginal returns (Eklund, 2007).The market value (MV) of a firm is affected by the market estimates and expectations regarding the firm’s future profits. In this case, the present value (PV) of the investments are primary in the calculation of return on investment and is the base of marginal q. (Bjuggren and Palmberg, 2007)
In Mueller and Reardon (1993), it is said that marginal q is derived with the insight that investments are evaluated beforehand against discounted present value of the future cash-flows that the investments of a firm creates. The net present value (NPV), which is the difference between PV and investments are used as a standard estimate when evaluating future investments of firms. Investments with a positive NPV are expected to be carried out.
To be able to evaluate future investments for each venture, a comparison have to be made between the negative cash-flow (CF) of investments (I) and the present value (PV) of future cash-flows (CFt) giving:
t n t t r CF PV ) 1 ( 1 1 + =
∑
= (equation 1)This equation can also be expressed as:
t t t t i r I PV = (equation 2) it= discount rate
rt= is the quasi-permanent rate of return
The investments that are measured must produce future cash-flows that are discounted to present value and equals or exceeds the investment cost, from the shareholders perspective. In Mueller (2003) it is explained that r/i measures the return on a marginal investment and is the marginal version of Tobin’s q. This is expressed in the second equation as:
t m t t t t q i r I PV . / = = (equation 3)
If qm =1 the ventures indicates a profitable investment level
If qm > 1 = firm is not investing sufficiently
If qm < 1 = overinvestment and a managerial failure has been made
MV of a firm may decrease when period t ends, therefore changes in MV of old capital stock (δt), error term for market inaccuracy and the PV of an investment in period t (PVt)
is included in the equation to be able to evaluate the firm in question.
t t t t t t M PV M M ≡ −1+ −δ −1 +µ (equation 4)
By replacing Mt-1 in equation 4, in each subsequent period the following equation is given:
∑
∑
∑
= + = − = + + − + = + − + n i i t n i n i t i t t n t M PV M 0 0 1 0 1 1δ
µ
(equation 5)qm and δ are both constant across all firms and time period. For this, equation 4 can estimate qm and δ directly by subtracting Mt-1 with both sides this will give the equation:
t t m t t t M M q I M − −1 =−
δ
−1+ +µ
(equation 6)By diving with Mt-1 the equation can be normalized giving:
1 1 1 1 − − − − =− + + − t t t t m t t t M M I q M M M
µ
δ
(equation 7)To be able to study the effects of management, ownership and control several interaction terms will be added such as founder, descendant external manager and excess vote. This will be done by adding the interaction terms with
1 − t t M I
from equation seven.
When the interaction variables are added the functional form will be:
Z X
Y =
α
+β
1 +β
2 , this method has been used by both Eklund (2007), and Bjuggren and Palmberg (2007). The estimated equation will be:i t t i i t t t t t t t M I Z M I Z M I M M M
ε
β
β
β
δ
+ + + + + − = − − + − − − − 1 1 1 1 2 1 1 1 1 ... (equation 8) Z = explanatory variablesTo be able to calculate the investment variable the following equation is made:
ADV D R Debt Equity on Depreciati Dividends ofit Aftertaxpr I = − + +∆ +∆ + & +
∆Equity= the change in equity R&D= Research and Development ADV= Advertising Expenditures
However for the regression used in this paper Selling, General and Administrative Expenses (SG&AExp) variable is used in the estimation of investment due to Compustat lacking numbers for the ADV variable1
. The calculation of investment will then be:
AExp SG D R Debt Equity on Depreciati Dividends ofit Aftertaxpr I & & + + ∆ + ∆ + + − =
3.3 Definition of Regression variables
In this section the variables for the forthcoming regression are given and described. Table 3.1
Table 3.1 Table 3.1
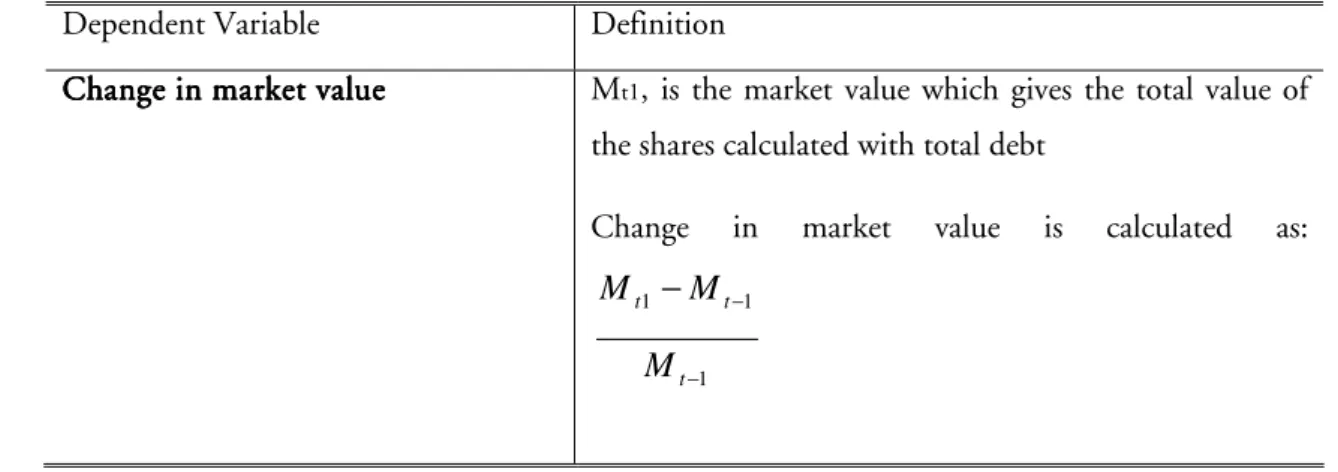
Table 3.1 Variable definition Variable definition Variable definition Variable definition
Dependent Variable Definition
Change in market value Change in market value Change in market value
Change in market value Mt1, is the market value which gives the total value of
the shares calculated with total debt
Change in market value is calculated as:
1 1 1 − − − t t t M M M 1
Following variables have been collected from Compustat (mnemonics in brackets): after tax profits (IB), depreciation (DP),dividends (DVT), total debt(DT), research and development (XRD),market price (MKVAL), advertising and marketing expenditure (XSGA), ∆equity (SSTK minus PRSTKC)
Independent Variables Definition Investment, I
Investment, I Investment, I
Investment, Itttt It, , , , is calculated as:
AExp SG D R Equity Debt Dividends on Depreciati ofits AfterTaxpr I & & + + ∆ + ∆ + − + = Investment/ Investment/ Investment/ Investment/MVMVMVMVtttt----1111, IM, IM, IM, IMtttt 1 − t t M I Excess vote Excess vote Excess vote
Excess vote Excess vote is the largest owner’s excess votes i.e. shares of voting rights minus the share of cash-flow rights.
Dummy Variables Definition
IM IM IM
IMtttt****FounderFounderFounder Founder If the founder is the CEO and/or COB then the firm is
given 1, or 0 otherwise. This variable is then multiplied with IMt
IM IM IM
IMtttt****DescendantDescendantDescendant Descendant If a firm is managed by a family member (other than
the founder) as the CEO and/or COB then the firm is given 1, and 0 otherwise. This variable is then multiplied with IMt
IM IM IM
IMtttt*External*External *External*External If a firm is managed by an external manager as CEO
and/or COB then the firm is given a 1, and 0 otherwise this variable is then multiplied with IMt.
Vote Vote Vote
Vote differentiation differentiation differentiation differentiation If a firm has vote differentiation the firm is given 1, and 0 otherwise this variable is then multiplied with IMt.
3.4 Descriptive data
In this section the descriptive statistics collected from the variables that will later be used in the regression is presented to give the reader a preview of the difference between family firms and non-family firms. The whole sample contains of 717 observations from 90 firms over a 15 year time period. This sample size is then between into family firms and non-family firms.
The first group that is analyzed is non-family firms this sample size contains of 493 observations. In table 3.2, the average firm in the sample size shows that the largest owner control 34.5 per cent of the outstanding votes and 22 per cent of the cash-flow rights in non-family firms, approximately 79 per cent of the firms in the sample applies vote differentiation.
The mean firm in the sample has a market value of 10053 million SKR, an investment rate at 1977 million SKR and an investment ratio of 0.32 per cent.
Table Table Table
Table 3.2 3.2 3.2 3.2 NonNonNonNon----family firmsfamily firmsfamily firmsfamily firms
Variables Mean Median Std Min Max Obs
VdiffD 0.7808989 1 0.0179166 0 1 493 Vexcess 11.43451 8.9 0.6917181 -36 49.1 493 Ownership 24.7113 22 0.6278866 1.4 81.6 493 Control 36.14588 34.5 19.36159 89.9 0 493 MVT 10053.96 1860.343 1293.566 13.71434 429901.9 493 dMV 0.1028977 0.0732589 0.0173221 -0.85504 1.955769 493 I 1977.318 243.7807 4986.614 45604.77 -2202.89 493 IMt 0.3239281 0.2749063 0.0171057 -1.41219 1.972942 493 INC 349.8324 74.70189 49.7568 -7961.06 12484.31 493 RD 346.1418 0 70.86987 0 17461.63 493 SALES 8630.79 1894.982 667.4502 0.440489 104936.3 493 2
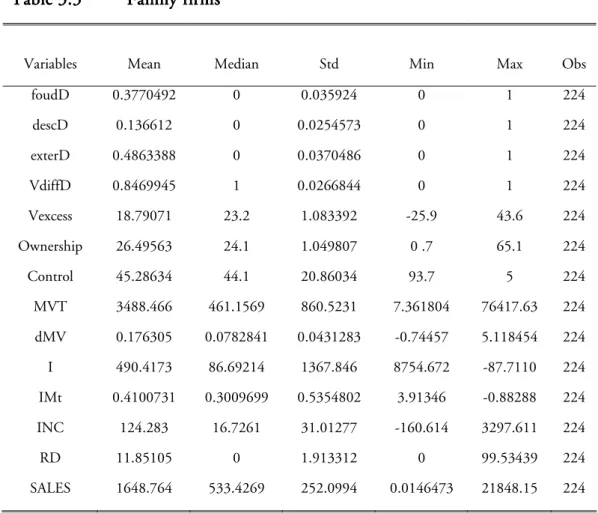
The second group that is analyzed is family firms. This sample size consists of 224 observations. Table 3.3 shows that in the average firm in the sample the largest owner controls 44.1 per cent of the outstanding votes in the firm and 24.1 per cent of the cash-flow. Over 84 per cent of the family firms use vote differentiation.
2
VdiffD =vote differentiation dummy, Vexcess= excess vote dummy, Ownership= cash-flow share, Control= vote right share, MVT=total market value, dMV= change in market value, I= investment, IMt=investment*MVt-1, INC=Income, RD= Research and development, SALES=sales
The mean firm in the sample has a total market value of 3488 million SKR an investment rate of 490 million SKR and an investment ratio of 0.41 per cent.
Table 3.3 Family Table 3.3 Family Table 3.3 Family Table 3.3 Family firmsfirmsfirmsfirms
3
When comparing the two groups interesting features can be seen from the sample sizes. Looking at ownership and control, the largest owner of vote shares and cash-flow rights in family firms has a substantially higher percentage share than in non-family firms. In family firms the largest owner controls on average 44.1 per cent compared to non-family firm where the largest owner controls 34.5 per cent of the vote rights. In family firms the largest owner has an average of 24.1 per cent of the cash-flow rights in the firm and in non-family firms the largest owner has only 22 per cent. The explanation for this is that family firms has a more concentrated ownership structure, therefore the largest owners in the family firms’ have a larger percentage share of vote and cash-flow. These finding are consistent with previous studies done by Andersson and Nyberg (2005) and Bjuggren and Palmberg (2007). In both the family firm and non-family firms’ case we can see that the largest
3
FoudD=Founder dummy, descD= descendant dummy, exterD=external manager dummy, VdiffD=vote differentiation dummy, Vexcess= excess vote dummy, Ownership= cash-flow share, Control= vote right share, MVT= total market value, dMV= change in market value, I= investment, IMt=investment*MVt-1, INC=Income, RD= Research and development, SALES=sales
Variables Mean Median Std Min Max Obs
foudD 0.3770492 0 0.035924 0 1 224 descD 0.136612 0 0.0254573 0 1 224 exterD 0.4863388 0 0.0370486 0 1 224 VdiffD 0.8469945 1 0.0266844 0 1 224 Vexcess 18.79071 23.2 1.083392 -25.9 43.6 224 Ownership 26.49563 24.1 1.049807 0 .7 65.1 224 Control 45.28634 44.1 20.86034 93.7 5 224 MVT 3488.466 461.1569 860.5231 7.361804 76417.63 224 dMV 0.176305 0.0782841 0.0431283 -0.74457 5.118454 224 I 490.4173 86.69214 1367.846 8754.672 -87.7110 224 IMt 0.4100731 0.3009699 0.5354802 3.91346 -0.88288 224 INC 124.283 16.7261 31.01277 -160.614 3297.611 224 RD 11.85105 0 1.913312 0 99.53439 224 SALES 1648.764 533.4269 252.0994 0.0146473 21848.15 224
owners have a higher vote right than cash-flow this is also in accordance with the Bjuggren and Palmberg (2007) study.
The market value for the data where all firms are included together (see appendix 2), shows a market value of 8378 million SKR and the average firm invest around 1597 million SKR a year where as the investment ratio is 0.34.
Comparing the market values, non-family firms have a significantly higher market value than family firms. This is also seen from the investment rate. Non-family firms’ average investments rate is 1977 million SKR whereas family firms’ investment rate is 490 million SKR. This can be explained by the fact that family firms are usually smaller in terms of the market value which is also established by looking at this data set.
In the next page a correlation matrix is presented (table 3.4). In the matrix we can see that research and development (RD) is negatively correlated with family firms this can be explained by family firms being smaller in size leading to RD not being as large as the RD of non-family firms. This is coherent with the descriptive statistics from tables 3.2 and 3.3 where market value is analyzed.
Table 3.4 CTable 3.4 CTable 3.4 CTable 3.4 Coooorrelation matrixrrelation matrixrrelation matrixrrelation matrix
Variables FamfD FoudD DescD ExterD Vexcess MVT dMV INC RD Sales IMt IM*F
ound IM*D esc IM*E x FamfD 1 FoudD 0.565* 1 DescD 0.346* -0.088* 1 ExterD 0.583* -0.149* -0.097* 1 Vexcess 0.1835* 0.090 0.118* 0.164* 1 MVT -0.136* -0.112* 0.0512 -0.108* 0.122* 1 dMV 0.0709 0.0301 0.083* 0.0129 0.0135 0.099* 1 INC (income) -0.1202* -0.1003* 0.0475 -0.096* -0.018 0.501* 0.08* 1 RD -0.119* -0.0680 -0.0405 -0.0692 0.138* 0.840* 0.035 0.23* 1 Sales -0.246* -0.1656* -0.0381 -0.173* 0.101* 0.738* 0.0004 0.48* 0.65* 1 IMt 0.062 0.0364 0.027 0.0307 0.067 -0.03 0.04* 0.003 -0.004 0.001 1 IM*Found 0.268* 0.4745* -0.0422 -0.0711 0.0437 -0.0484 0.33* -0.04 -0.03 -0.07 0.45* 1 IM*Descd 0.1796* -0.0462 0.406* 0.0259 0.083* -0.008 0.073 -0.0003 -0.02 -0.03 0.12* -0.02 1 IM*Ex 0.3601* -0.0926* -0.0566 0.617* 0.129* -0.066 0.16* -0.06 -0.04 -0.10* 0.27* -0.04 -0.02 1
4 Regression Analysis
This chapter is devoted to explain the regression process and also present the different regression results retrieved from the regressions. The hypotheses of the thesis are summarized to revive the reader’s memory. 4.1 Panel regression
A panel data have been used in this thesis to be able to estimate for the three different governance aspects. Although knowing that panel data is a very complex method to estimate data and by that the results obtained from panel data regressions can be distorted (Gujarati, 2003) panel regressions are still used due to the large number of observations. The observations are collected from 90 firms over a 15 year time span. Panel data can better detect and measure minimum effects as that can not be observed in pure cross-section or pure time series data .(ibid)
The period covered by the data is 1990-2005, however the time period in the regression is 1991-2005, due to the first difference in the dependent variable. In order to study the same individual firms for several periods, all firms had to provide data for at least four consecutive years. This has also been done in previous studies as Bjuggren et al., 2007. The regressions done for this paper has been estimated with White’s Hetroscedasticity-consistent variance and standard error which is also known as robust standard errors. This is usually performed in order to retrieve an asymptotically valid statistical inference which can be made for the parameter values. The hetroscedasticity-corrected standard errors are usually larger than the OLS standard error and by this the values are smaller than the t-values obtained from OLS regressions. (ibid)
As mentioned above the panel regression has also been estimated with time and firm effects as well as with fixed effect, this helps when the model intercept differ across individuals, each individual intercept are stopped from varying over time (ibid). In table 4.2 all regression results are presented. For a further in-depth look at the different regression results all separate regression are shown in appendix 3.
4.2 Hypothesis
This thesis contains of 9 different hypotheses, these have been presented in the theoretical framework. However, the hypotheses are once again repeated in the table below to revive the reader’s memory.
Table 4.1 Table 4.1 Table 4.1
Table 4.1 Hypothesis tableHypothesis tableHypothesis tableHypothesis table
Hypothesis Hypothesis Hypothesis
Hypothesis Expected outcomeExpected outcomeExpected outcomeExpected outcome Management: Founder
Management: Founder Management: Founder
Management: Founder Positive Positive Positive Positive impact on firm performance Management: Descendant
Management: Descendant Management: Descendant
Management: Descendant Negative Negative impact on firm Negative Negative performance Management: External
Management: External Management: External Management: External Manager Manager Manager Manager Negative Negative Negative
Negative impact on firm performance Control: Founder
Control: FounderControl: Founder
Control: Founder Positive Positive Positive Positive impact on firm performance Control: Descendant
Control: DescendantControl: Descendant
Control: Descendant Negative Negative impact on firm Negative Negative performance Control: External Manager
Control: External Manager Control: External Manager
Control: External Manager PositivePositivePositivePositive impact on firm performance Ownership: Founder
Ownership: Founder Ownership: Founder
Ownership: Founder Positive Positive Positive Positive impact on firm performance Ownership: Descendant
Ownership: Descendant Ownership: Descendant
Ownership: Descendant Negative Negative impact on firm Negative Negative performance Ownership: External Ownership: External Ownership: External Ownership: External Manager Manager Manager
Manager PositivePositivePositivePositive impact on firm performance
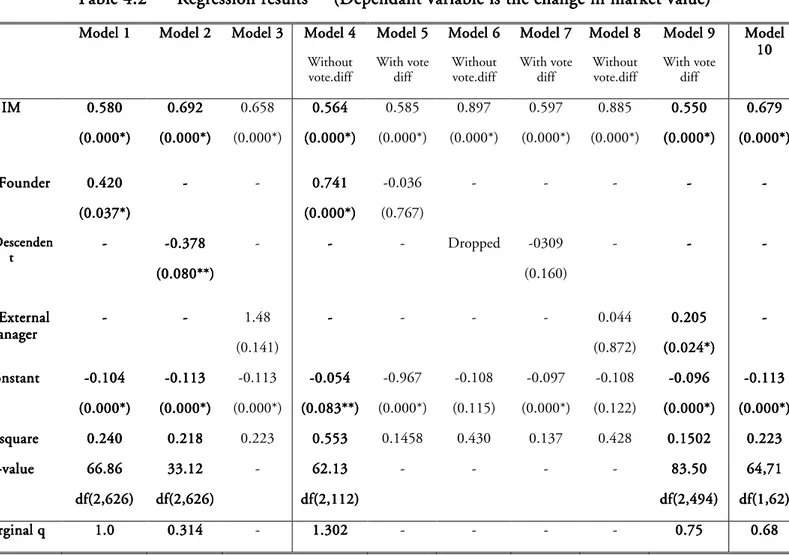
4.3 Regression Results
The regression results are provided in table 4.2 for all nice models. In model 10 the marginal 9 of the sample size is also estimated.
Table Table Table
Table 4.4.4.4.2222 Regression r Regression r Regression r Regression results esults (Dependant variable is the esults esults (Dependant variable is the (Dependant variable is the cccchange in market value(Dependant variable is the hange in market valuehange in market valuehange in market value) ) ) ) Model 1
Model 1 Model 1
Model 1 Model 2Model 2 Model 3Model 2Model 2 Model 3Model 3Model 3 Model 4Model 4Model 4Model 4
Without vote.diff Model 5 Model 5 Model 5 Model 5 With vote diff Model 6 Model 6Model 6 Model 6 Without vote.diff Model 7 Model 7 Model 7 Model 7 With vote diff Mode ModeMode Model 8l 8l 8 l 8 Without vote.diff Model 9 Model 9 Model 9 Model 9 With vote diff Model Model Model Model 10 10 10 10 IM IM IM IM 0.5800.5800.5800.580 (0.000*) (0.000*) (0.000*) (0.000*) 0.692 0.6920.692 0.692 (0.000*) (0.000*) (0.000*) (0.000*) 0.658 (0.000*) 0.564 0.5640.564 0.564 (0.000*) (0.000*) (0.000*) (0.000*) 0.585 (0.000*) 0.897 (0.000*) 0.597 (0.000*) 0.885 (0.000*) 0.550 0.550 0.550 0.550 (0.00 (0.00(0.00 (0.000*)0*)0*) 0*) 0.679 0.679 0.679 0.679 (0.000*) (0.000*) (0.000*) (0.000*) IM*Founder IM*FounderIM*Founder IM*Founder 0.4200.4200.4200.420 (0.037*) (0.037*) (0.037*) (0.037*) ---- - 0.7410.741 0.7410.741 (0.000*) (0.000*) (0.000*) (0.000*) -0.036 (0.767) - - - ---- ---- IM* IM*IM*
IM*DescendenDescendenDescendenDescenden tttt ---- ----0.3780.3780.3780.378 (0.080**) (0.080**) (0.080**) (0.080**) - ---- - Dropped -0309 (0.160) - ---- ----
IIIIM*External M*External M*External M*External manager manager manager manager ---- ---- 1.48 (0.141) ---- - - - 0.044 (0.872) 0.205 0.205 0.205 0.205 (0.024*) (0.024*)(0.024*) (0.024*) ---- Constant Constant Constant Constant ----0.1040.1040.1040.104 (0. (0. (0. (0.000*)000*)000*)000*) ----0.1130.1130.1130.113 (0.000*) (0.000*) (0.000*) (0.000*) -0.113 (0.000*) ----0.0540.0540.0540.054 (0.083**) (0.083**) (0.083**) (0.083**) -0.967 (0.000*) -0.108 (0.115) -0.097 (0.000*) -0.108 (0.122) ----0.0960.0960.096 0.096 (0.000*) (0.000*)(0.000*) (0.000*) ----0.1130.1130.1130.113 (0.000*) (0.000*) (0.000*) (0.000*) R R R
R----squaresquaresquare square 0.2400.2400.2400.240 0.2180.218 0.2180.218 0.223 0.553 0.5530.5530.553 0.1458 0.430 0.137 0.428 0.15020.15020.15020.1502 0.2230.2230.2230.223 F
FF
F----valuevaluevalue value 66.8666.8666.8666.86 df(2,626) df(2,626)df(2,626) df(2,626) 33.12 33.1233.12 33.12 df df df df(2,626)(2,626)(2,626)(2,626) - 62.1362.13 62.1362.13 df(2,112) df(2,112) df(2,112) df(2,112) - - - - 83.5083.5083.5083.50 df(2,494) df(2,494) df(2,494) df(2,494) 64,71 64,71 64,71 64,71 df(1,62 df(1,62 df(1,62 df(1,62)))) Marginal q Marginal qMarginal q Marginal q 1.01.01.01.0 0.3140.314 0.3140.314 - 1.302 1.3021.3021.302 - - - - 0.750.750.750.75 0.680.680.680.68 *Significant at 5% level, ** Significant at 10% level (The P-values are presented in parentheses)
Model 1: Model 1: Model 1:
Model 1: The first regression is done to see if the null hypothesis for hypothesis 1 can be rejected or not. The results can be seen in table 4.2 under Model 1. The regression showed that all variables were significant at a 5 per cent significance level leading to estimate that founders managing a family firm have a positive effect on the firms’ investment performance. The value was (2,626) = 66.86 and since it is higher than the critical F-value the null-hypothesis is rejected. The R-square shows a 24 per cent F-value and marginal q for the firm when a founder is managing is calculated at 0.580+0.420= 1.0 per cent which indicates that the firm has a profitable investment level.
Model 2: Model 2: Model 2:
Model 2: The second regression indicates that all variables except the IMt*Descendant
variable is significant at a 5 per cent significance level. However, IMt*Descendant is
managing a family firm has a negative effect on the firms investment performance. The F-value is (2,626) = 33.12 which is higher than the critical F-value therefore the null-hypothesis is rejected. The R-square in the second regression is showing a value of 21.8 per cent and the calculated marginal q for firms with a descendant managing is 0.692+(-0.378)=0.314 which is lower than 1, indicating that the firms are not investing sufficiently. Model 3:
Model 3: Model 3:
Model 3: In the third regression, all except the external manager variable is significant at the 5 per cent significance level. This means that no clear statement can be made to explain if external managers have a positive effect on the investment performance level of a firm. To be able to analyze the ownership and control purpose, the control and ownership regression was combined. This was done by calculating the excess votes, and then setting a vote difference dummy for the firms with or without vote difference. The basic IMt variable
was then multiplied with the three different management structure dummies.
To calculate how founders, descendants and external managers affect firm investment performance by looking at vote shares and cash-flows rights a regression was first made with the firms without vote differentiation and then with firms with vote differentiation. This was done in three separate rounds to see the different affect of the management structures. Model 4:
Model 4: Model 4:
Model 4: Was done to see how a founder affects the firms’ investment performance when looking at vote rights and cash-flow rights in firms without vote difference present. In table 4.1 we can see that IMt and IMt*Founder variable is significant at a 5 per cent significance
level. The regression result shows that a founders control and ownership in a family firm without vote differentiation has a positive affect on the firms’ investment performance. The F-value is (2,112) = 62.13 which in this case is higher than the critical value, leading to rejecting both null-hypothesis for ownership and control (hypothesis 4 and 7). The R-square has a value of 55.3 per cent and the marginal q is 0.561+0.741=1.302 indicating a rather high investment level.
Model 5: Model 5: Model 5:
Model 5: Doing the same regression but for firms with vote differentiation present, the IMt*Founder variable was insignificant at both the 5 and 10 per cent significance level.
This can be interpreted as founders in family firm with vote difference having no essential affect on the firms’ investment performance when looking at vote rights and cash-flow. Model 6:
Model 6: Model 6:
Model 6: Done analyze how descendant managers in firms without vote difference affect the investment performance by control and ownership. Unfortunately the IMt*Descendant
variable was dropped, which can be explained by lack of observations that includes descendants as the managers.
Model 7: Model 7: Model 7:
Model 7: Doing the same regression for firms with descendant managers with vote difference the results in table 4.1 shows that the IMt*Descendant variable is insignificant at
both at the 5 and 10 per cent significance level. This can be interpreted as descendants in family firms with vote difference has no essential affect on the firms’ investment performance when looking at vote rights and cash-flow.
Model 8: Model 8: Model 8:
Model 8: The next regression done for control and ownership was to take external managers into account. All except the IMt variable is insignificant at both a 5 and a 10 per
cent significance level. This means that external managers in firms without vote difference has no significant affect on the investment performance of the firm when looking at vote rights and cash-flow rights.
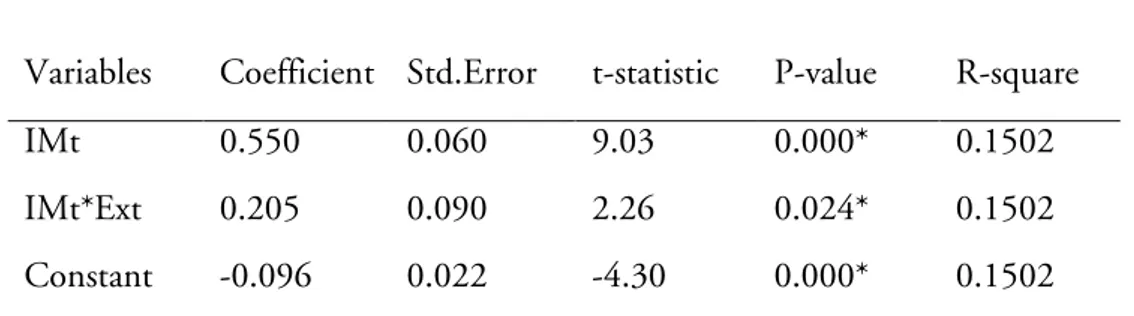
Model 9: Model 9: Model 9:
Model 9: However, when looking at external managers affect on the investment performance of firms with vote difference we can see in table 4.1 that all variables are significant at the 5 per cent significance level. This indicates that external manager’s control and ownership has a positive influence on the investment performance of family firm with vote difference. The F- value is (2,494) = 83.50 which is higher than the critical F value implying that the null hypothesis in hypothesis 6 and 9 can be rejected. The R-square shows a 15 per cent value which is a quit low, according to Gujarati (2003) a low R-square implies that the regression effects can be non-linear. The marginal q is 0.550+0.205=0.755 which is lower than one indicating a low investment rate.
Model 10: Model 10: Model 10:
Model 10: The marginal q received for this data set with 90 firms over a 15 year time period was calculated to 0.68. The marginal q is substantially lower than 1. However, in accordance with previous researches as Bjuggren and Palmberg (2007) the marginal q retrieved from this dataset is closely aligned to the marginal q retrieved in their paper which was estimated at 0.89. The F-value was (1,627) = 64.71 and R-square showed a 22.3 per cent value. The marginal q for this paper is 0.68 which is lower than 1, indicating that the firms are not making sufficient amount of investments.
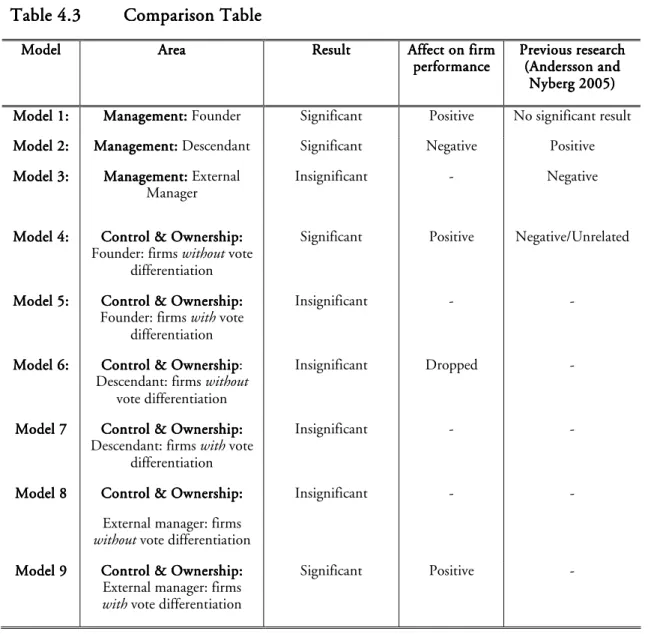
To give the reader a clear view of the results, table 4.3 is presented. This table clearly states the different significance level of the result, it also compares this thesis results with previous Swedish research done by Andersson and Nyberg (2005). In model 1, Andersson and Nyberg presented no significant results for when a founder was serving as the CEO and/or COB in a firm. However, the result for this thesis shows a strong positive significant relation between founder management and firm investment performance.
The results for descendant management shows a strong negative relation to firm performance compared to Andersson and Nyberg’s paper where the results showed a positive relation.
For control and ownership it was clearly affirmed that founders had a positive impact on the investment performance in firms without vote differentiation, the same were affirmed for external managers however for firms with vote differentiation.
Table 4.3 Table 4.3 Table 4.3
Table 4.3 Comparison TComparison TableComparison TComparison Tableableable Model
Model Model
Model AreaAreaAreaArea ResultResultResultResult Affect on firm Affect on firm Affect on firm Affect on firm performa performaperforma
performancencence nce Previous research Previous research Previous research Previous research (Andersson and (Andersson and (Andersson and (Andersson and Nyberg 2005) Nyberg 2005)Nyberg 2005) Nyberg 2005) Model Model Model
Model 1:1:1:1: Management:Management:Management:Management: Founder Significant Positive No significant result Model 2:
Model 2: Model 2:
Model 2: Management:Management: Descendant Management:Management: Significant Negative Positive Model 3:
Model 3: Model 3:
Model 3: Management:Management: External Management:Management: Manager
Insignificant - Negative
Mode Mode Mode
Model 4:l 4:l 4:l 4: Control & Ownership:Control & Ownership:Control & Ownership:Control & Ownership: Founder: firms without vote
differentiation
Significant Positive Negative/Unrelated
Model 5: Model 5: Model 5:
Model 5: Control & Ownership:Control & Ownership:Control & Ownership:Control & Ownership: Founder: firms with vote
differentiation
Insignificant - -
Model 6: Model 6: Model 6:
Model 6: Control & OwnershipControl & OwnershipControl & OwnershipControl & Ownership: Descendant: firms without
vote differentiation
Insignificant Dropped -
Model 7 Model 7 Model 7
Model 7 Control & Ownership:Control & Ownership:Control & Ownership:Control & Ownership: Descendant: firms with vote
differentiation
Insignificant - -
Model 8 Model 8 Model 8
Model 8 Control & Ownership:Control & Ownership:Control & Ownership:Control & Ownership: External manager: firms
without vote differentiation
Insignificant - -
Model 9 Model 9 Model 9
Model 9 CCCControl & Ownership:ontrol & Ownership:ontrol & Ownership:ontrol & Ownership: External manager: firms
with vote differentiation