Alternative Test Methods for Mine Trucks
and Loaders to Reduce Environmental
Impact, Improve Lead Time and
Productivity
Petter Aksnes
Mechanical Engineering, master's level 2019
Luleå University of Technology
Lule˚
a University of Technology
E7012T
Master of Science, Mechanical Engineering, Production
Epiroc Rock Drills AB
Underground Rock Excavation
”Alternative Test Methods for Mine
Trucks and Loaders to Reduce
Environmental Impact, Improve Lead
Time and Productivity”
Author: Petter Aksnes Supervisor: Johan St˚aby, Epiroc
Examiner and Supervisor: Jesper Sundqvist, LTU
Division of Product and Production Development Department of Engineering Sciences and Mathematics
Acknowledgement
Master Thesis. Final Project. A proof for the gathered knowledge from the past five years. When I started my university studies back in 2014 the thesis project felt far away. I remember how tough the first courses in mathematics and physics felt like and how much I fought to pass them. The years went by with new courses and the last two years with a specialization within Production. Now I see the end of this episode. Five years after I moved to Lule˚a I have now fulfilled my dream of becoming an Engineer.
I am very grateful for my time at LTU and I will always look back with happiness and gratitude. In Lule˚a I found amazing friends and you have all helped me during these years. I will always be thankful for your help, your happiness and our memories we will have for the rest of our lives. Thank you for these years! I would like to thank my family as well. Your support and belief in me has been important during these years. Thank you all!
In order to perform this thesis project, corresponding to 30 credits, I moved south for the first time in my life. I moved away from the winter in Lule˚a and unpacked my luggage in ¨Orebro to conduct this project at Epiroc Underground Rock Excavation. For me this thesis was an insight in a new industry, the mining industry with an interesting and exciting future. I would therefore like to thank everyone at Epiroc for these months and all your help from the very beginning until the end now in May.
During these months I have had two supervisors; Jesper Sundqvist (LTU) and Johan St˚aby (Epiroc). Jesper has answered my questions and supported me through this thesis project and I would like to thank you for all your help. Johan, you have helped since day one with all my questions about Epiroc’s abbreviations, who to contact and how to move on. Thank you for a good collaboration. Lastly, I would like to thank everyone I met during my study visits. Thank you for your time, effort and inspiration!
To summarize it all, these years have been amazing and I am very pleased I chose LTU and Epiroc. I am now ready for the next episode, work life.
¨
Orebro, June 15, 2019 Petter Aksnes
Abstract
Epiroc manufactures and develops equipment for the mining and infrastructure industry. This thesis has been performed at Epiroc Underground Rock Excavation (URE) in ¨Orebro, the company’s largest production unit for underground machines. In this project MH ma-chines (material handling) have been investigated, i.e loaders and trucks. These mama-chines are currently being built at the factory area in central ¨Orebro and subsequently quality controlled in the Kvarntorp mine before they are finally delivered to the customer. The project aims to evaluate how current test methods in the mine could be minimized and, in the future, removed for certain machine types. Today the machines passes six steps between final assembly and delivery, which results in an extended lead time. The machines are started up at the pressurizing station before they are ready for the quality control, i.e testing. The machines are then transported to Kvarntorp, about 20 kilometers from the factory, before the test operators from Epiroc conducts the testing. Each machine type has machine-specific checklists which means that the test operator performs both visual inspec-tion as well as test drive in order to verify the machine’s overall quality and performance. The current test procedure causes machine damages and the mining environment makes it necessary to perform both re-painting and washing. Summarized, the current test procedure leads to increased costs, increased amount of rework and extended lead times. In addition, the machine handling between the factory area and Kvarntorp involves logistical challenges. The work began with a literature study where the focus was on change management, flow efficiency and total quality management. Subsequently, a current state analysis was carried out in order to map the current structure and it’s problem areas. Identified problems included extended lead time, machine damages (paint, tires, bucket, snow) and work environment. All together, these areas lead to increased costs for the afterflow. These problems were categorized into three main problems; test procedure, environment and economy. To seek for improvements, three study visits were carried out; Volvo CE Arvika, Komatsu Forest Ume˚a and Epiroc SED ¨Orebro. The inspiration was used to create an optimized test facility at the factory area.
The work resulted in a solution where all areas are improved, i.e lead time, machine damages and work environment. A new test procedure based on an improved visual inspection, new bucket test and a succeeding test drive on a chassis dynamometer has eliminated the need for the Kvarntorp mine. With the new test facility the machine damages have been eliminated and the working environment for the affected people has improved considerably. Furthermore, the lead time is also heavily reduced. All together, the improvements results in large annual savings, which in turn gives relatively short pay back time. Epiroc is recommended to invest in both short and long term solutions where the short term can be implemented before the new test facility is finalized. In a short term perspective it is important to create a good dialogue between test operators and assemblers, switch to digital checklists and to remove the currently mandatory drag test. In longer term, Epiroc should implement a quality team, invest to increase data access and finally invest in the test facility.
Sammanfattning
Epiroc tillverkar utrustning f¨or borraggregat samt bergbrytnings- och anl¨aggningsindustrin f¨or b˚ade ovan- och underjordsapplikationer. Detta examensarbete har utf¨orts vid Epiroc Underground Rock Excavation (URE) i ¨Orebro, f¨oretagets st¨orsta produktionsenhet f¨or underjordsmaskiner. F¨or detta projekt har s˚a kallade MH-maskiner (material handling) unders¨okts, det vill s¨aga lastare och truckar. Dessa maskiner byggs idag p˚a fabriksomr˚adet i centrala ¨Orebro och kvalitetskontrolleras d¨arefter i gruvmilj¨o i Kvarntorp innan de slutligen levereras till kund.
Projektet syftar till att utv¨ardera hur nuvarande testmetoder i gruva skulle kunna min-imeras och fram˚at ¨aven tas bort f¨or vissa maskintyper. Dagens uppl¨agg inneb¨ar att maskinerna passerar sex steg mellan slutmontering och leverans, n˚agot som medf¨or en f¨orl¨angd ledtid. Maskinerna startas upp vid tryckst¨allning och blir d¨arigenom klara f¨or kvalitetskontroll, s˚a kallad provning. Maskinerna transporteras d˚a till Kvarntorp, cirka 20 kilometer fr˚an fabriken, innan provare fr˚an Epiroc genomf¨or provningen av dem. Varje maskintyp har maskinspecifika cheklistor som inneb¨ar att provaren genomf¨or b˚ade vi-suell inspektion och provk¨orning f¨or att verifiera maskinens ¨overgripande kvalitet och prestanda. Nuvarande provningsprocedur orsakar skador p˚a maskinerna och gruvmilj¨on g¨or att b˚ade lackering och tv¨att blir n¨odv¨andigt f¨or att uppn˚a ¨onskv¨ard niv˚a innan leverans. Sammantaget leder nuvarande provningsprocedur till f¨orh¨ojda kostnader, ¨okat omarbete och f¨orl¨angd ledtid. Dessutom inneb¨ar maskinhanteringen mellan fabriksomr˚adet och Kvarntorp logistiska utmaningar.
Arbetet inleddes med en litteraturstudie d¨ar fokus l˚ag p˚a f¨or¨andringsledning, fl¨odeseffek-tivitet och offensiv kvalitetsutveckling. D¨arefter genomf¨ordes en grundlig nul¨agesanalys f¨or att kartl¨agga nuvarande uppl¨agg och problemomr˚ade. Identifierade problem inkluderade f¨orl¨angd ledtid, maskinskador (lack, d¨ack, skopa, sn¨o) och arbetsmilj¨o. Sammantaget leder dessa omr˚aden till kraftigt f¨orh¨ojda kostnader f¨or efterfl¨odet av dessa maskiner. Dessa problem kategoriserades till tre huvudproblem; testprocedur, milj¨o och ekonomi. F¨or att s¨oka f¨orb¨attringsalternativ genomf¨ordes tre studiebes¨ok; Volvo CE Arvika, Komatsu Forest Ume˚a och Epiroc SED ¨Orebro. Inspirationen anv¨andes till att utfroma en, f¨or URE, optimerad testanl¨aggning i anslutning till fabriksomr˚adet.
Arbetet resulterade i en l¨osning som inneb¨ar f¨orb¨attringar p˚a alla omr˚aden, det vill s¨aga ledtid, maskinskador och arbetsmilj¨o. Genom ett nytt fl¨ode, med f¨orb¨attrad visuell in-spektion, nytt skoptest och provk¨orning p˚a chassydynamometer, har behovet av Kvarntorp eliminerats. Med den nya anl¨aggningen ¨ar maskinskadorna eliminerade och arbetsmilj¨on f¨or ber¨orda har f¨orb¨attrats avsev¨art, dessutom med kraftigt s¨ankt ledtid. Sammantaget resulterar f¨orb¨attringarna i stora ˚arliga besparingar. Epiroc rekommenderas att satsa p˚a b˚ade kort- och l˚angsiktiga l¨osningar d¨ar de kortsiktiga kan implementeras innan den nya testanl¨aggningen tagits i drift. Viktigt p˚a kort sikt ¨ar att skapa en bra dialog mellan provare och mont¨orer, ¨overg˚a till digitala checklistor samt att fr˚ang˚a det idag obligatoriska dragtestet. P˚a l¨angre sikt b¨or Epiroc implementera ett kvalitetsteam, satsa p˚a att ¨oka datatillg˚angen samt att investera i testanl¨aggningen.
Nyckelord: verksamhetsutveckling, avvikelser, sl¨oserier, produktionsfl¨ode, maskinprovn-ing
Contents
1 Introduction 1
1.1 Company Introduction . . . 1
1.1.1 Underground Rock Excavation . . . 1
1.2 Background For the Project . . . 2
1.3 Objectives . . . 2
1.4 Project Scope . . . 3
1.5 Stakeholders . . . 3
1.6 Outline . . . 3
2 Theoretical Framework 5 2.1 Operations Management and Development . . . 5
2.1.1 ADKAR . . . 7
2.1.2 Kotter’s 8 steps . . . 7
2.2 Lean Production . . . 8
2.2.1 Kaizen . . . 9
2.2.2 Waste Elimination . . . 9
2.2.3 Resource and Flow Efficiency . . . 10
2.3 High Mix Low Volume . . . 12
2.4 Quality Improvement . . . 13
2.5 Machine tests . . . 14
2.5.1 Test System Architecture . . . 14
2.5.2 Repeatability and Reliability . . . 15
2.6 Sound . . . 16
3 Methodology 17 3.1 Plan for Changes . . . 18
3.1.1 Time Plan . . . 18
3.1.2 Research Approach . . . 18
3.1.3 Literature Review . . . 18
3.2 Analyze the Current and Future State . . . 19
3.2.1 Observations . . . 19
3.2.2 Data Collection . . . 19
3.2.3 Interviews . . . 20
3.2.4 Value Stream Mapping . . . 20
3.2.5 Study Visit . . . 21
3.3 Formulate goals . . . 21
3.4 Search for Alternatives . . . 21
3.4.1 Benchmark . . . 22
3.5 Evaluate and Choose Alternatives . . . 22
3.6 Develop and Finalize Chosen Concept . . . 23
3.7 Implement . . . 23
3.8 Reliability and Validity . . . 24
3.8.1 Validity . . . 24
3.8.2 Reliability . . . 24
4 Result, Current State 26 4.1 Production Quality . . . 26
4.2 Process Mapping . . . 31
4.2.1 Value Stream Mapping . . . 32
4.3 Test Procedure . . . 33 4.3.1 Before Kvarntorp . . . 33 4.3.2 Kvarntorp . . . 34 4.3.3 Test Track . . . 35 4.4 Lead Time . . . 35 4.5 Economy . . . 37
4.6 Analysis of Current State . . . 38
4.6.1 Lead Times . . . 38 4.6.2 Vehicle Damages . . . 38 4.6.3 Work Environment . . . 40 4.6.4 Economy . . . 41 4.6.5 Environmental Impact . . . 42 4.6.6 Wastes . . . 42 4.6.7 Summary . . . 42
5 Result and Analysis 44 5.1 Internal Interviews . . . 44
5.1.1 Manager Production Quality . . . 44
5.1.2 Quality Technician . . . 45
5.1.3 Production Manager . . . 46
5.1.4 Test Operator . . . 47
5.1.5 Interview Analysis . . . 48
5.2 Study Visits . . . 51
5.2.1 Volvo Construction Equipment . . . 51
5.2.2 Epiroc Surface and Exploration Drilling . . . 53
5.2.3 Komatsu Forest . . . 54
5.2.4 Opus Vehicle Inspection ¨Orebro - Truckstop . . . 56
5.2.5 Analysis Study Visits . . . 57
5.3 Sound Levels . . . 59 5.4 Requirement Specification . . . 60 5.5 Finalized Solution . . . 61 5.5.1 Process Mapping . . . 61 5.5.2 Test Equipment . . . 61 5.5.3 Improvement Results . . . 64
5.6 Short Term Improvements . . . 65
5.6.1 Work environment . . . 66
5.6.2 Test improvements . . . 66
5.6.3 Work Methods . . . 67
6 Discussion 68 6.1 Project Execution . . . 68
6.2 Validity and Reliability . . . 68
6.3 3C and TSA . . . 69
6.3.1 Test Procedure . . . 69
6.3.2 Economy . . . 71
6.3.3 Environment . . . 71
6.5 Future Research . . . 73 6.6 Recommendations . . . 74 6.6.1 Short Term . . . 74 6.6.2 Long Term . . . 75 7 Conclusion 76 7.1 Research Questions . . . 76 7.2 Target Fulfillment . . . 77
Appendices
1 Gantt Chart . . . .Appendix p. 2 2 Value Stream Mapping, Scooptram ST14 . . . .Appendix p. 3 3 Value Stream Mapping, Minetruck MT42 . . . .Appendix p. 4 4 Internal Interview Guide . . . .Appendix p. 5 5 Tabular variant of conducted interviews . . . .Appendix p. 6 6 External Interview Guide . . . .Appendix p. 7 7 Study Visit, Volvo CE Arvika . . . .Appendix p. 8 8 Study Visit, Komatsu Forest Ume˚a . . . .Appendix p. 12 9 Numbers of test items for ST and MT . . . .Appendix p. 16 10 Axle loads and approximate weights . . . .Appendix p. 17 11 Prices for new equipment . . . .Appendix p. 18 12 Value Stream Mapping, Future State (theoretical) . . . .Appendix p. 19
List of Figures
1 Organization structure for URE ¨Orebro. Source: Epiroc (2019c). . . 1
2 Organization structure for the production department. Source: Epiroc (2019c). . . 2
3 Truck and loader manufactured in ¨Orebro. Source: Epiroc (2019d). . . 2
4 ADKAR model for change. . . 7
5 Kotter’s 8 step model for change. . . 8
6 Lean as a management system. Source: Modig and ˚Ahlstr¨om (2017). . . . 9
7 The efficiency matrix. Source: Modig and ˚Ahlstr¨om (2017). . . 11
8 Kingman’s equation and the impact of variation. . . 11
9 The cornerstone model for TQM. Based upon Bergman and Klefsj¨o (2012). 13 10 The composition for the test system architecture. Source: Black (2011). . . 15
11 The project circle used in the thesis. . . 17
12 The improvements rules. Based on: Petersson et al. (2015). . . 21
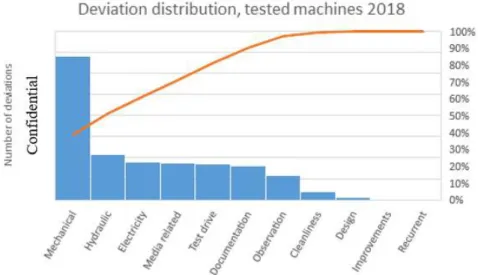
13 Pareto chart with deviation distribution of tested MH machines for year 2018. 26 14 Pareto chart with deviation distribution for MT. . . 27
15 Pareto chart with deviation distribution ST. . . 27
16 Pareto chart with classification points. . . 28
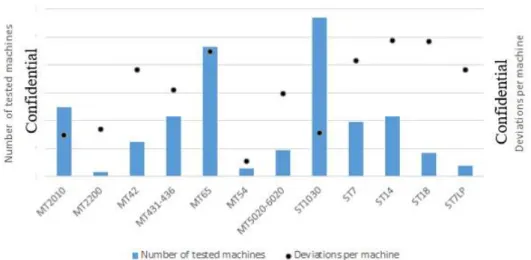
17 Deviations per product. . . 29
18 Average deviations per tested machine. . . 29
19 Comparison between different leakages. . . 30
20 Comparison between test drive and total amount. . . 31
21 Average total deviations per tested machine. . . 31
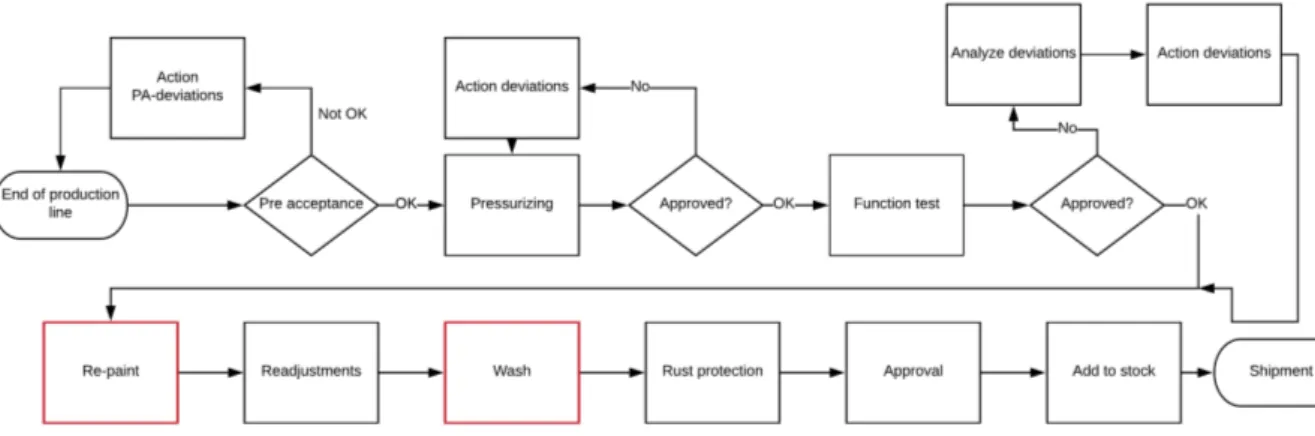
22 The process between production line and shipment. . . 32
23 The waiting field for the MH machines. . . 33
24 Minetruck delivered in Kvarntorp. . . 33
25 Visual inspection of a truck. . . 34
26 Bucket test. . . 34
27 Drag test in the test mine. . . 35
28 Average lead times for MH machines 2018. . . 36
29 Comparison between planned and real time in the after flow. . . 37
30 Comparison between planned and real cost in the after flow. . . 38
31 Paint damages on the machine. . . 39
32 Tyres affected of the tests. . . 39
33 Bucket affected of the lift test. . . 40
34 Snow in the machine cab. . . 40
35 Inadequate work environment in Kvarntorp. . . 41
36 Problem summary regarding current state. . . 43
37 The after flow process for VCE Arvika. . . 51
38 The after flow process for Komatsu Forest Ume˚a. . . 54
39 The drive-through lane at Opus. . . 56
40 Wheel inspection conducted both above and below ground level. . . 57
41 Sound levels for manufactured MH machines. . . 59
42 The improved after flow process. . . 61
43 Equipment for improved visual inspections. Source: Lucaside-Gems (2019). 62 44 Chassis dynamometer from Taylor. Source: Taylor (2019) . . . 63
46 The improved bucket test. Based on: Epiroc (2019e), Witre (2019), PMH
(2019). . . 64
List of Tables
1 Differences between resource and flow efficiency. . . 102 Classification of Data. . . 20
3 Error points due their relevance for the quality. . . 28
4 Lead time distribution for MH machines (2018). . . 36
5 Policy for external industrial noise. . . 60
6 Requirement Specification. . . 60
7 Deviations from drag test, 2013-2018. . . 66
List of Common Abbreviations
Abbreviation Definition
CCM Cultural Change Management CM Change Management
ERD Epiroc Rock Drills AB HM LV High Mix Low Volume HV LV High Volume Low Variety J IT Just In Time
KBD Key Business Drivers
LT U Lule˚a University of Technology M H Material Handling
M T Minetruck
OM Operations Management P DCA Plan Do Control Act QC Quality Control ST Scooptram T C Test center
T P S Toyota Production System T QM Total Quality Management T SA Test System Architecture U RE Underground Rock Excavation V SM Value Stream Map
W IP Work In Progress 3C Three Circles
List of Variables
Symbol Description Unit A Average lead time [days] B Extension through after flow [days] C Extension through after flow, ST [days] D Extension through after flow, MT [days] E Average cost: pressurizing, test drive,
readjustments
[SEK] F Standard cost: transportation,
re-paint, wash
[SEK] G Driven distance test operators [km] H Amount value adding time,
pressur-izing
[%] I Amount value adding time, rust
pro-tection
[%] J Amount test drive [%] K Number of machines, 2018 [nr] L Number of machines, production
plan 2019
[nr] M Time pressurizing [hour] N Time test drive [hour] O Time readjustments [hour] P Cost from operation cards (ST14) [SEK] Q Deviations drag test, 2013 [nr] R Deviations drag test, 2014 [nr] S Deviations drag test, 2015 [nr] T Deviations drag test, 2016 [nr] U Deviations drag test, 2017 [nr] V Deviations drag test, 2018 [nr] X Cost after flow [SEK]
1
Introduction
The work has been conducted in cooperation with Epiroc Rock Drills AB in ¨Orebro at the department for Production Engineering and Operations Development. This Section will introduce Epiroc as a company and further discuss the background, objectives and scope for the project. Lastly, the project’s stakeholders and the thesis outline will be explained.
1.1
Company Introduction
Epiroc was born in 2017 when Atlas Copco announced the split between Atlas Copco and the previous division Mining and Rock Excavation Technique. The company Epiroc was introduced as an independent company in the summer 2018 and has approximately 14 000 employees with sales in 150 countries (Epiroc 2019a).
Epiroc is a leading productivity partner for the mining, infrastructure and natural resources industries. With innovative technology, the company develops and produces drill rigs, rock excavation and construction equipment, and provides services and consumables worldwide (ibid.).
1.1.1 Underground Rock Excavation
The division Underground Rock Excavation (URE) develops and manufactures tunneling and mining equipment for underground activities. Their rock drilling equipment are used to excavate rock in infrastructure or mining operations worldwide. The loaders and trucks are used to transport rock and ores in an effective and powerful way. Lastly, rock reinforcement equipment are used to secure the underground environments during mining and infrastructure projects (Epiroc 2019b).
Epiroc Rock Drills (ERD) AB in ¨Orebro is URE’s main production facility and has 1800 employees. Figure 1 shows the organizational structure for ERD. The department of
Figure 1: Organization structure for URE ¨Orebro. Source: Epiroc (2019c).
Production Engineering and Operations Development lays under the production manager’s overall responsibility. Figure 2 shows the structure for the production department and it’s different sub departments. The figure further shows the department of Operations Development.
Figure 2: Organization structure for the production department. Source: Epiroc (2019c).
1.2
Background For the Project
ERD develops and manufactures a wide range of machines for the mining and infrastructure industry. Today, all manufactured machines are tested before being delivered to customer, a time-consuming and costly operation. The tests varies between machine types, but have a common ground. The material handling (MH) machines, i.e trucks and loaders, are all tested in the mine Kvarntorp outside ¨Orebro. In addition, the tests also involves logistical challenges, extends lead times and a requires the machines to be re-painted, washed and readjusted after the tests. Epiroc believes it is possible to minimize some of the tests for the MH machines and replace a large part of the mining tests with test methods at the factory area in ¨Orebro. Figure 3(a) shows a Minetruck (MT) 42 and Figure 3(b) a Scooptram (ST) 14, both manufactured in ¨Orebro and part of the MH series.
(a) (b)
Figure 3: Truck and loader manufactured in ¨Orebro. Source: Epiroc (2019d).
1.3
Objectives
The thesis project aims to, through a feasibility study, evaluate how tests for trucks and loaders in the mine can be minimized and in the future also be removed for certain types of machines. The thesis therefore aims to investigate how the test methods can be adapted in order to shorten the lead times and make the handling of finished mining machines more efficient after manufacturing, i.e analyze the after flow. Furthermore, the project aim is to conduct an analysis over the current situation and suggest improvements to
reduce lead times. The purpose is thus to analyze the handling of the machines after the manufacturing process and to investigate the time between production line and shipment. To fulfill the objectives the following research questions will be answered:
1. How are tests regarding trucks and loaders conducted today and are they all neces-sary?
2. How can the tests be adapted and developed for the future? 3. What methods are available for these types of machines?
4. How can new methods be implemented at Epiroc Rock Drills AB? 5. How will the improvements affect Epiroc?
1.4
Project Scope
To ensure that the project stayed within the actual scope, the following delimitations were made:
• The project will only analyze material handling machines (MH) such as trucks and loaders.
• The real (detailed) implementation phase at Epiroc will not be analyzed. • Lack of free space at the factory area will not be taken into consideration. • Test procedure for autonomous vehicles will not be analyzed.
The master thesis concludes 30 credits on full time, which corresponds to 20 full work weeks, during spring 2019.
1.5
Stakeholders
The master thesis is made for the department of Production Engineering, which thereby acts as the main stakeholder for the project. Johan St˚aby, Operations Development Manager and project employer together with the department will hopefully be able to use the project results for further developments within the company. Hopefully the thesis project will help to reduce lead times, reduce costs and make the handling more efficient. Examiner at LTU together with involved personnel are classified as secondary stakeholders. The testing personnel are this projects user stakeholders.
1.6
Outline
The following text explains the outline of this master thesis. Chapter one, this section, presents the introduction such as company information, background, objectives and scope. Chapter two clarifies the theoretical framework used in this master thesis. The presented theories have been used in the improvements, analysis and discussions. The methodology will be explained in chapter three. The chapter will clarify every phase of the thesis project and will explain how the work was done, when certain decisions were taken and how the work ended up with a complete solution. Chapter four explains the current situation and highlights problem areas. An analysis over the current state is followed,
which highlights what areas to prioritize. Next chapter, result and analysis, begins with four interviews and their combined analysis. The interviews are followed by a description of four conducted study visits and their combined analysis. The empirical work is summarized in a requirement specification before the chapter ends with a description over the final solution and it’s result. The result and the whole outcome from the thesis project is then discussed in Chapter six before everything is summarized in the last chapter, Conclusions.
2
Theoretical Framework
This chapter contains the theoretical framework used in this thesis project. The sources for the literature review have been books and scientific articles. The used books have previously been used in other courses at LTU and otherwise borrowed at ¨Orebro University Library. The scientific articles have been gathered at Scopus, Emerald Insight and Google Scholar.
Production is defined as a network of processes and operations. Connected operations forms the processes in which the products are produced (Shingo 1989). According to Karlsson (2003) there are numerous forces driving the production development towards more networks than it has been before. Production development is a wide term and refers to both development of new systems, as well as improvements of already existing systems. The largest potential to achieve high quality systems, is according to Bellgran (2009) during the development phase of new production systems. The author states that production development is more important than ever due globalization and the overall competitiveness and that it requires a long term perspective to ensure the potential. This is also stated by Bartezzaghi (2013) who explains that companies have experienced considerable changes regarding their overall activities, and specific production.
This project aims to analyze and improve the end of an already existing production system. The end in this case symbolizes the testing phase before the machines are delivered to the customers.
2.1
Operations Management and Development
Operations development is how to develop and improve the efficiency, quality and technology to achieve better business according to Salvendy (2001) who further states that so called full potential organizations have achieved the following four aspects during their journey:
• Sensitivity to the environment
An organizations ability to adapt and learn. • Cohesion and identity
An organizations ability to build an own and powerful identity. • Tolerance and decentralization
The ability to build long lasting relationships within and outside the own organization. • Conservative financing
Strong finances with long perspective.
Due operations development often can lead to changes, the ability to adapt is crucial. To implement improvements, the concept of change management (CM) can be used. According to Harrington and Voehl (2015) culture change management (CCM) is a more complex, but also more efficient, way to enable the desired culture and increase the capability for changes within an organization. The authors states that the culture has considerable impact on how an organization is prepared and willing to adapt and implement improvements and changes. The aim should be to create a culture where changes are accepted as well as expected. Further, Harrington and Voehl (ibid.) states that it is estimated that an average employee is directly affected by a projects output approximately once every five years but
argues that poor culture can affect the outcome nevertheless. According to the authors, 75% of all projects fail due lack of support from the employees. The resistance to change is also stated as a problem by Hiatt and Creasey (2003). The approach for CCM is described below:
1. Current State Assessment
Define the key business drivers (KBD). 2. Vision Statements
Develop a vision statement for every KBD. 3. Performance Goals
Compare the vision statements to the strategic plan for the company. Set 5 year performance goals for every KBD.
4. Desired Behavior
Make sure the KBDs and the organization’s values are matching. 5. Year Plans
Develop individual 3 year plans for every KBD. 6. Combined 3-year Plan
Combine the individual plans to one overall plan. 7. 90-day Action Plan
Breakdown of the first 90 days to single weeks with assigned tasks. 8. Implementation
Establish a group responsible for the tasks in the 90-days action plan.
In addition, follow up is crucial to remain desired level regarding the implementation. This is also stated by Paramanathan et al. (2004) who argues that support from management is an important factor to ensure motivation and expectation for changes and improvements. Stanleigh (2008) argues that changes will occur, despite people like it or not and that everyone have to be prepared and ready to adapt to remain successful. Changes can be radical, incremental or endemic (Counsell, Tennant, and Neailey 2005). Common reasons for change initiatives to fail are according to Stanleigh (2008) the following: not engaging all employees, managing change at management level, sending employees to short change programs and not giving time for the employees to adapt. To overcome the barriers, it is important to understand that change is a process, to move forward step by step and to create and communicate a clear vision (Stanleigh 2008; Hiatt and Creasey 2003). Operations management (OM) has, until recently, been an internal business function with focus on the management aspect of operations development. Nowadays the focus for OM has entered another path towards a more external role where focus is on how to develop closer relationships with every part in the supply chain (Johnston and Staughton 2009). The need to build strong relationships have grown bigger due globalization, which according to Johnston and Staughton (ibid.) have affected the role for OM. The importance of strong alliances and long term perspective is also supported by Liker (2009), Bergman and Klefsj¨o (2012) as well as Petersson et al. (2015). Although a more external role, OM is still much about internal changes and improvements with a large focus on continuously improvements (Johnston and Staughton 2009). Hicks (2007) argues that OM has large impact on the overall management system.
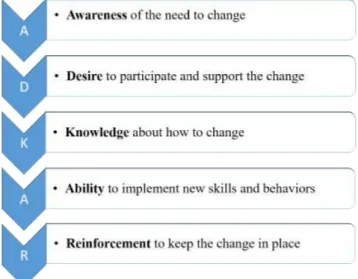
2.1.1 ADKAR
ADKAR is a model for change and is divided into five steps. These steps will act as a guide throughout the change (from the beginning untill the end) and is illustrated in Figure 4. The model illustrates what phases a person goes through during change. The culture regarding change will affect how employees experiences the five phases (Harrington and Voehl 2015; Hiatt and Creasey 2003). Management has to be aware of the different phases to implement changes and improvements step by step in an adapted way for the employees to ensure efficiency (Paramanathan et al. 2004; Stanleigh 2008; Hiatt and Creasey 2003). The ADKAR model can be used by management to focus on the right thing in the right moment.
Figure 4: ADKAR model for change.
2.1.2 Kotter’s 8 steps
ADKAR and Kotter’s 8 steps have similarities. Both are based on the different phases employees and people goes through during change. Kotter’s model consists of eight steps and is like ADKAR dependent on that right type of culture is available at the company. As Figure 5 illustrates the first three steps are linked to culture to ensure the right conditions for change exist. The following steps can be merged to engage the organization. The last two steps is in the end of a project or change and are connected to the implementation phase (Appelbaum et al. 2012).
Figure 5: Kotter’s 8 step model for change.
2.2
Lean Production
Lean is a concept and production philosophy that derives from the automobile manufac-turer Toyota. The concept of Toyota Production System (TPS) was first described in the west in 1990 by Womack, Jones, and Roos (1990) and the concept of Lean was introduced. Lean redefined the previous production system, mass production, which was introduced in the beginning of the 20st century. Lean is focused on the customer demand and to reduce costs through elimination of waste (Liker 2009).
According to Pardi (2007) the main benefit with TPS is it’s constant focus on continuous improvements and waste elimination. This is done through the focus on Just-In-Time (JIT) and Jidoka (autonomation), two fundamental parts for TPS according to Liker (2009). He further states that TPS is built upon 14 principles which in turn is organized through the 4P-model (Philosophy, Processes, Partners and Problem solving). The procedure for Lean according to Liker (ibid.) is:
1. Identify value
2. Map the value stream 3. Create flow
4. Establish pull 5. Seek perfection
Petersson et al. (2015) states that TPS cannot be directly copied to other organizations without adaption. Instead, it is crucial to adapt the principles and the methods in TPS to the current situation at the company to reach the potential of Lean. Lean is dependent on a specific culture to unsure that principles and methods are followed as desired. That is why a long term perspective is highlighted as the most important factor for Lean (Liker 2009; Petersson et al. 2015; Modig and ˚Ahlstr¨om 2017). Further Hines, Holweg, and Rich (2004) highlights the identification of customer value as crucial.
According to Modig and ˚Ahlstr¨om (2017) Lean is based on values, then principles which in turn is followed by methods. Lastly there are tools and activities that together form
Lean. The values defines how an organization should be, principles how it should think, methods how it should do and the tools defines what it should use. Lean should be seen as an operations strategy. Figure 6 illustrates Lean as a management system and how the content is linked to each other.
Figure 6: Lean as a management system. Source: Modig and ˚Ahlstr¨om (2017).
2.2.1 Kaizen
The Japanese term Kaizen stands for continuous improvements, an important idea within Lean. Continuous improvements is supposed to eliminate waste and improve the company continuously. The Deming wheel PDCA (Plan, Do, Control, Act) is an important method for continuous improvements (Liker 2009; Bergman and Klefsj¨o 2012). Petersson et al. (2015) states that standardization of successful implementations are crucial to maintain
the result in long term. To succeed with continuous improvements, it is crucial to not get pleased with the current situation. According to Liker (2009), Bergman and Klefsj¨o (2012) and Petersson et al. (2015) the strive for perfection and continuous improvements is a journey with no end.
2.2.2 Waste Elimination
According to Hicks (2007) there are two fundamental parts of Lean: waste elimination and ensuring value flows. Those in turn consists of identification of value, understanding of flow and characterisation of waste. Shah and Ward (2007) states that the values, principles, methods and tools that are associated with Lean exist in order to eliminate waste and to increase the customer value. In Lean there are seven wastes, i.e non-adding value, which have been developed to 7+1 (Hicks 2007):
• Overproduction • Inventories • Transport • Waiting • Motion • Extra processing
• Defects
• Underutilisation of employees
To minimize waste it is crucial to produce according to customer demand which in turn can be ensured by pull production. The idea is to deliver what the customer wants and when the customer wants it, which according to Hicks (2007) and Shah and Ward (2007) can be done through JIT. Liker (2009) states that pull production in small quantities reduces lead time and is far more efficient than push production. Pull system also reduces the work in progress (WIP) due production takes place with small lot sizes, which in turn increases the flexibility (Karlsson and ˚Ahlstr¨om 2013). The WIP level is a measurable variable and can be used to analyze the current situation in a production facility. Little’s law is used to calculate the WIP level where the throughput rate and lead time is multiplied as followed W IP = T hroughputrate ∗ Leadtime (1) and the product of them becomes the WIP level (Segerstedt 2008).
2.2.3 Resource and Flow Efficiency
The efficiency in a system can be defined in two ways, either flow or resource efficiency. The most common efficiency type is resource efficiency according to Liker (2009). Modig and ˚Ahlstr¨om (2017) refers resource efficiency to a single resource (i.e machines, employees) and the amount of time it is used in a system during a specific time unit. This focus increases the lead times, WIP and makes it harder to produce according to customer demand. Regarding resource efficiency the aim is to use the resources as much as possible to achieve high efficiency and reduce the alternative cost (the loss for not using a resource maximal). The opposite, flow efficiency, refers to a single flow unit and how the unit flows through the system. Efficiency in this case is measured through the flow units perspective and the time it’s value increases. Table 1 illustrates the differences between resource and flow efficiency.
Table 1: Differences between resource and flow efficiency. Resource Efficiency Flow Efficiency Focus Resources Flow unit
Goal High capacity utilization Fulfillment of needs Perspective Single resources System
Throughput time
Long Short
WIP Many Few
Hines, Holweg, and Rich (2004) states that efficiency is a fundamental variable to measure for companies to be able to analyze the current situation. Prioritizing flow efficiency is necessary if focus is JIT and pull production systems. With flow efficiency the flow unit (i.e produced products) will be prioritized above the available resources which thereby will decrease the lead times (Liker 2009; Petersson et al. 2015; Modig and ˚Ahlstr¨om 2017). Although flow is the best alternative between flow and resource efficiency, the optimal
alternative is a combination of both high flow as well as high resource efficiency. Modig and ˚
Ahlstr¨om (2017) states that the combination with both high flow and resource efficiency is impossible to achieve due variation in the system. Figure 7 illustrates the interlinkages between flow and resource efficiency. The star is the optimal state, i.e high flow and resource efficiency. As the figure illustrates the best way to reach the optimum is through
Figure 7: The efficiency matrix. Source: Modig and ˚Ahlstr¨om (2017).
flow efficiency. Modig and ˚Ahlstr¨om (ibid.) states flow efficiency should be prioritized in order to reach the optimum point. Continuous improvements should therefore, in the first place, aim to move the current state to the right and then move it up in the matrix when wastes have been eliminated. The star is not possible to reach, but according to Modig and ˚Ahlstr¨om (ibid.) a company should always aim towards the star in their strive for increased efficiency.
The impact of variation can be analyzed through Kingman’s equation where the re-lationship between throughput time and resource efficiency is directly affected by variation. The relationship can be seen in Figure 8 where high respectively low variation impacts the two parameters differently. With high variation the throughput time increases rapidly with increased resource efficiency. With low variation, the resource efficiency can be increased without jeopardizing the throughput time (Segerstedt 2008). According to Bergman and
Figure 8: Kingman’s equation and the impact of variation.
Klefsj¨o (2012) it is crucial to reduce the variation in a system, at least if the variation is a result of deviations. Although variation can reduce throughput time and resource efficiency, it can sometimes be necessary to meet customer requirements. Flexibility and unique customer orders are more important than ever due globalization and it is therefore
necessary to understand how to deal with the variation in an efficient way (Berry, Hill, and Klompmake 2013). Zhanga, Vonderembse, and Jeen-SuLimc (2003) highlights the importance of value chain flexibility. Further, Jina, Bhattacharya, and Walton (1997) argues that product variety and speed of delivery can be advantages for companies working with ”mass customization”.
2.3
High Mix Low Volume
In manufacturing there are two extremes when it comes to volume and variation: High mix/low volume (HMLV) and high volume/low variety (HVLV). Production system has mainly been associated with HVLV. As Kingman’s equation explained, the mix (variation) affects the outcome from a production system heavily. Horbal, Kagan, and Koch (2008) states that production within HMLV has several more requirements than production within HVLV, such as changing demand and more complex processes to maintain efficient. The authors further states that common tools and methods within Lean production may not be directly suitable to fit HMLV, instead it might be necessary to adapt them before implementation. HMLV production systems don’t produce as repetitive as HVLV systems, which makes it harder to ensure pull production.
Although mass customization can be seen as an advantage for companies, Jina, Bhat-tacharya, and Walton (1997) states that the concept leads to new complications regarding manufacturing. The authors states that typical HMLV volumes are 20 - 500 and 5000 - 20 000 units per year, i.e high variety distribution on few units. Due lower volumes, the unit cost therefore often increases in HMLV systems (Berry, Hill, and Klompmake 2013). Jina, Bhattacharya, and Walton (1997) declares that HMLV suffer from system turbulence and highlights four areas:
• Schedule changes • Product mix
• Changes in production volumes • Design changes of products
These four areas affects a HMLV system far more than a traditionally HVLV and it is therefore important to map the challenges in such a system to prevent their impact. Lean tools and methods can through adaption to current circumstances be implemented in many cases to ensure efficient manufacturing with high quality despite HMLV (Jina, Bhattacharya, and Walton 1997; Horbal, Kagan, and Koch 2008). Manufacturing flexibility can be seen as a strategic element in the same way as price, quality and delivery but requires effort to reach the potential (Zhanga, Vonderembse, and Jeen-SuLimc 2003). Further, the authors highlights the importance of logistics flexibility to enhance the overall system.
2.4
Quality Improvement
Total Quality Management (TQM) refers to a management system with focus on continuous improvements and proactive quality work. According to Samsona and Terziovskib (1999) the system is based on the following key content:
• Leadership
• Management of people • Customer focus
• Use of information and analysis • Process improvements
• Strategic and quality planning
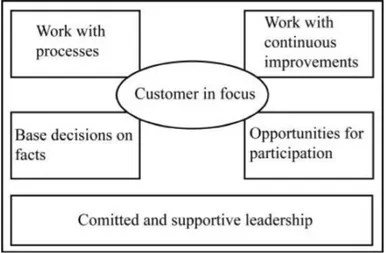
This is confirmed by Bergman and Klefsj¨o (2012) who argues that TQM is built upon four cornerstones, illustrated in Figure 9, with the same base as above. The customer is in
Figure 9: The cornerstone model for TQM. Based upon Bergman and Klefsj¨o (2012). focus in TQM and therefore in center of the figure above. Bergman and Klefsj¨o (ibid.) states that it is essential to identify what the customer requires and expects to fulfill the business in an acceptable way. It is impossible to fulfill the customer requirements if they are not identified. As described in chapter 2.2 ”Lean Production” it is important to work with processes in order to achieve continuous improvements. Processes are crucial for quality improvement due to the ability to map and improve single processes to a working entirety. Bergman and Klefsj¨o (ibid.) states that the purpose is to satisfy customer requirements with as few resources as possible. They can be distributed in operational, supportive and management processes. To base decisions on fact is crucial in order to reduce deviations on the journey towards improvements and higher quality (ibid.). To collect, analyze and decide the 7 quality control (QC) tools can be used. Most of the tools uses statistical data to analyze quality, which in turn can be used to interpret data from production. The tools are Pareto diagram, Cause & Effect diagram, Histogram, Control charts, Scatter diagram, Graphs and Chech sheets (Magar and Shinde 2014). Continuous improvements are fundamental within TQM and an important way to maintain competitive. The PDCA cycle as well as DMAIC (Define, Measure, Analyze, Improve and Control) can
be used as an iterative tool for continuous improvements (Taylor et al. 2014). The last cornerstone is about participation and it’s importance for the overall quality improvement. According to Bergman and Klefsj¨o (2012) communication, delegation and education are all important factors to achieve participation throughout the organization. Similar to Lean, TQM is also built upon the idea of a committed and supportive leadership. Re-garding TQM it is crucial the leadership encourage change (Samsona and Terziovskib 1999). Within both TQM and Lean the idea of highest possible quality is fundamental. Bergman and Klefsj¨o (2012) states that quality is supposed to be built in directly and that quality controls should be minimized if the quality is as high as it can be within TQM. This is supported by Petersson et al. (2015) who states that Lean production should focus on doing right from the beginning, which thereby minimizes the importance of quality controls during production. The quality improvements within TQM and Lean is thereby proactive instead of reactive. Also Liker (2009) argues that proactive quality improvements are more effective than reactive in the journey of continuous improvements.
Bergman and Klefsj¨o (2012) estimates that among Swedish industry companies the costs of poor quality (CPQ) stands for approximately 10 - 30% of their turnover, which is supported by Roden and Dale (2000) who argues that 25 - 30% of manufacturing companies turnover can be linked to poor quality. These CPQ can be distributed to internal respectively external CPQ. The internal CPQ are directly linked to the work inside the company, i.e the deviations and failures discovered before delivery to customer. The external CPQ are deviations and failures discovered at customer. Normally the external CPQ are more expensive for the company compared to the internal (ibid.).
2.5
Machine tests
According to Black (2011) tests can be divided into structural (white-box) and environ-mental (black-box) tests. The structural tests seeks to find errors in lines of code and interfaces, i.e low level operations. The environmental tests instead seeks to identify bugs and deviations in high level operations. The tests are functional and based on what the system should manage. These environmental tests involves an understanding of the system, but not on the same detailed level as the structural tests. The test operator relies on the requirement specification together with experience. The tests are best conducted by experienced test operators who understands the design and the systems structure (Engel 2011).
2.5.1 Test System Architecture
Black (2011) states that machine tests requires a test system architecture (TSA), which in turn is based on four elements. The fundamental element is the test team, i.e the group of people who performs the tests. The test team has to be competent and be in agreement with the machines. The test team is in turn dependent on the other elements; testware, test processes and test environment. Testware contains documentation and test tools, i.e tools to conduct the tests. The usage of the test tools leads to result logs, which can be analyzed and interpreted. The test processes are the arrangement of the test steps, from start to end. Those processes can thereby be seen as the cookbook for the test and can be both written and unwritten. The last element, test environment, is the outer circumstances and includes hardware, software and other infrastructure for the tests. The
interlinkages for the test system architecture can be seen in Figure 10. As the Figure
Figure 10: The composition for the test system architecture. Source: Black (2011). shows, the test team is the fundamental part of the architecture. Although the importance of the test team, the other three elements are essential as well and the Figure illustrates their impotence with the corresponding arrows between all four elements. The hardest element to change is the test environment due it’s complex nature. The other elements can be changed and adapted more easily.
2.5.2 Repeatability and Reliability
It is impossible to conduct tests without deviations. Those can be a result of weak stan-dardized processes, human factor or a result of measurement systems. The possibility to conduct several identical test with the same result are called repeatability (Pyzdek 2003). Standardized methods is according to Pyzdek (ibid.) the best way to heavily increase the repeatability.
Tests can be conducted to identify deviations or to analyze the risk for deviations to later appear, i.e the reliability. In that case, the number of deviations discovered during a test are used to estimate deviations to later appear. Engel (2011) states that reliability tests should be performed in environments with similar circumstances as the products natural habitat. Some errors may appear after long time, which makes it hard to test and provoke them in an early test stage. Increased load during tests can be used to trig errors and deviations to appear earlier than expected, which Engel (ibid.) calls accelerated testing. The correlation between load and life-span can then be used to interpret the accelerated testing to a normal perspective.
2.6
Sound
According to G¨aderlund et al. (2015) industries within cities and close to housing must adjust their sound level according to regulations. The sound level is measured in Decibel [dB] but often readjusted to dB(A) which is a weighing filter and used to approximate the sound to the human ears capability (Callermo 2015). New planned building can be categorized in three zones, where Leq is a form of time weight which makes it possible to
read the values instantaneous;
A houses: External sound level is low and no need for adjustments. Leq day = 50 dB(A),
Leq evening = 45 dB(A) and Leq night = 45 dB(A).
B houses: New houses can be accepted with sound protection adjustments. Leq day = 60
dB(A), Leq evening = 55 dB(A) and Leq night = 50 dB(A).
C houses: Due high external sound level, buildings should not be accepted. Leq day >60
dB(A), Leq evening >55 dB(A) and Leq night >50 dB(A).
Nationalencyklopedin (2019) states that a normal human conversation is equivalent to 55 dB and a car 10 meters away is equivalent to 70 dB. A sound level above 120 dB is perceived as painful, but hearing damages can appear already at around 85 dB.
Callermo (2015) states that it is up to the concerned company to make measures and prevent inconvenience. Every company is responsible for noise related to it’s operations and the responsibility thereby lays on the company and not neighbours. Actions should be targeted at the source for best result, which according to Callermo (ibid.) can be new machines, processes or work methods. Actions intended to minimize noise at the receiver (i.e neighbours) should be taken only when measures against the source is considered
3
Methodology
Chapter three, Methodology, contains details regarding the method used in the master thesis project. The project circle has been used during the project and six out of eight phases have been passed by. The different phases are described below, first according to theory and then how they have been used in the project.
The methodology for the project is based on Johansson and Renhagen (1995) and their project circle. The eight phases follows a chronological order and consists of the following steps:
1. Plan for changes
2. Analyze the current and future state
3. Formulate goals and the requirement specification 4. Search for alternatives
5. Evaluate and choose alternative
6. Develop and finalize the chosen concept 7. Implement the chosen concept
8. Evaluate the effects. Due time constraints, the thesis project will not reach phase number 8. The evaluation process will therefore not be carried out.
The green external line in Figure 11 illustrates the phases used in this project. This shows that phase number seven (implement) will be started but not finished. In this project the implementation will only be analyzed in general. Phase number eight will not be started at all.
3.1
Plan for Changes
The first phase of the project circle includes the overall project planning combined with a literature review for the theoretical framework used in the project. The phase aims to form the structure for the project, i.e time distribution and resource planning for the content. 3.1.1 Time Plan
In the beginning of the project the overall time plan (Gantt chart) was formulated. The purpose with the Gantt chart was to illustrate the different phases of the project, their respectively time amount and can further be seen in Appendix 1. A project plan was then conducted in order to form the structure for the project in a more detailed level. The background, objectives, scope, theoretical framework and methodology were explained in a summarized way and was then distributed to the projects two supervisors for approval. 3.1.2 Research Approach
According to Saunders, Lewis, and Thornhill (2009) the research approach can be divided into inductive and deductive, where the deductive approach is common in scientific research. The inductive approach aims to investigate a problem which in the end is turned into a theory. Prince and Felder (2006) also states that engineering and scientific research are mostly conducted in a deductive way. However, inductive perspective regarding the investigation process focuses on observations that can be interpreted, questions that should be answered and problems to be solved in a more quantitative approach. Borrego, Douglas, and Amelink (2009) states that qualitative research often takes an inductive way throughout data analysis, which in turned is confirmed by Tjora (2016) who argues that an inductive approach is strongly linked to empirical investigations. Due this project focuses on an existing case, i.e to map and analyze the current state in order to find improvements, the project thereby aims to interpret observations into solutions. The investigation strategy was thereby concentrated to the case study. That’s why an qualitative and inductive approach was chosen in the projects beginning.
3.1.3 Literature Review
The purpose of the literature review was to gather relevant information for the projects continuing and to ensure the project would be based on reliable theory. The previous written research questions acted as the base for the research and literature with interlinkages to the questions were analyzed. The purpose of the five questions was to contribute to the overall scope of the project, i.e to find alternative test methods for trucks and loaders. The services from Lule˚a University Library were used, such as available search engines. For the most part Google Scholar, Scopus and Emerald Insight were used to identify relevant literature. Common search phrases were, but not limited to, operations management lean, change management, high mix low volume production, lean production, Toyota production system, waste elimination, resource flow efficiency, flexible production, total quality management. The identified articles throughout the literature review were mostly chosen through relevance of titles and abstract. The chosen books had for most of the time been used in previous courses during the years at the program Mechanical Engineering. Otherwise, they were selected with help of the library staff at ¨Orebro University Library.
3.2
Analyze the Current and Future State
This phase was concentrated to the analysis of the current state in order to find the current problems and thereby the potential improvements. Also, the future state was analyzed in order to identify the demands for the future. Several interviews and study visits to the Kvarntorp mine were conducted during this phase. The objective was to seek improvements within the subject and to identify the biggest problems that exists today. 3.2.1 Observations
Observations is a method to analyze what and how people do certain things (Tjora 2016). In order to gain broad understanding of the current state, the initial part of the project was concentrated to observations at the production lines within ERD. The purpose was to identify critical phases during the manufacturing and to see the assembling of MH machines. The purpose of the current test drive for the machines at Kvarntorp is to identify deviations from the manufacturing line and it was thereby important with a deep understanding of the manufacturing process. Those observations were conducted in what Bell (2000) calls non-participation, i.e objective observations. Tjora (2016) argues that the role for the observer varies during observations and that the interaction both increases and decreases. Furthermore, several observations have been conducted at Kvarntorp. Flow leaders within the after flow have been observed and followed several times, which according to Tjora (ibid.) is a good method to see the reality. The current situation were analyzed throughout discussions and observations with test operators. Every test step (i.e visual inspection and test drive) have been investigated through what Tjora (ibid.) calls interactive observation, i.e the observer acts as observer but can interact with the observed people. The current state has been video recorded and photographed in a wide range of series to have documentation throughout the project. Documentation is a crucial part of the analyzing phase after observations (Bell 2000).
3.2.2 Data Collection
To collect and analyze data has been a vital part of the current state analysis. The purpose has been to map the deviations from today’s manufacturing in order to identify where and what deviations that occur. These deviations must be identifiable in the future state as well. All identified deviations for 2018 were analyzed and sorted in different categories depending on type and amount. For this project, the most important category was devia-tions discovered during test drive. These deviadevia-tions where analyzed in different stages and sorted by product and machine type. Through the analysis it became clear that deviations discovered during test drive is a clear minority of the total amount. The production economy has been analyzed as well. The costs for the after flow have been compiled in order to analyze the costs after production line. The costs for the processes have been col-lected or calculated and analyzed in order to find the most expensive processes in the after flow. However, due lack of data the analysis could not be conducted in the desired approach. There are two types of data according to Saunders, Lewis, and Thornhill (2009), quan-titative and qualitative. The data regarding deviations has been quanquan-titative and the interviews have been qualitative. In Table 2 the classification of data can be seen. Saunders, Lewis, and Thornhill (ibid.) states that these two methods can be combined, which they also have been in some cases during the project.
Table 2: Classification of Data.
Data Type Method Classification Test related Primary Participation Qualitative Production
devi-ations
Secondary Databases Quantitative Economy Secondary Databases Quantitative 3.2.3 Interviews
As mentioned, the project has mostly been focused on qualitative methods. Tjora (2016) states that interviews are the most used method to collect data and is a method to later analyze what people say. Unstructured interviews were held in the projects beginning to get a deeper understanding of the current situation. According to Bohgard et al. (2015), unstructured interviews are best when the interviewer only has a vague idea of the situation. The purpose was only to understand the situation quickly and thereby the answers were not analyzed further. When the knowledge increased, semi-structured interviews were held. Those are a combination of unstructured and structured interviews and the prepared plan can thereby be adjusted due new circumstances during the interview (ibid.). Tjora (2016) argues semi-structured interviews can be used to study attitudes and experiences,
two important aspects for this thesis project. The interviews were analyzed in order to find similarities and differences and some of the result was compiled in a tabular which according to Carlstr¨om and Hagman (2012) is a method to visualize result from qualitative research. Tjora (2016) states it is important to maintain a subjective perspective during qualitative approaches, which has been a constantly present conclusion during the thesis project.
3.2.4 Value Stream Mapping
Value stream mapping (VSM) is according to Petersson et al. (2015) a method to map the current state in order to find improvements for the whole system. The purpose is to identify the current state, analyze it and then improve it with remained focus at the product. The current state should act as the starting point for the improvements and the authors highlights the importance of an overall perspective to prevent single process perspective. A VSM should be conducted backwards, i.e from the customer to the supplier, according to Rother and Shook (2003). Although the backwards focus, Petersson et al. (2015) states that it is not necessary. Due the HMLV production in this project, the VSM
was conducted in chronological order. To follow the products and to map the current state the products should be divided into product families.
This thesis project looked into two product families, ST and MT. The purpose was to investigate if there existed differences and if so, where and why. One ST and one MT was followed and significant data was measured and collected. The future state was based on Petersson et al. (ibid.) improvement rules (eliminate, combine, rearrange and simplify -ECRS) which acted as a help to question the flow and it’s structure and can be seen in Figure 12. The last step was to create an action plan for the improvement activities. In this case, only a small plan was created but normally the plan should include what to be
Figure 12: The improvements rules. Based on: Petersson et al. (2015).
done, whom is responsible and when it should be done. The purpose of the plan is to assign smaller projects to the involved persons (Petersson et al. 2015).
3.2.5 Study Visit
To get a new perspective on the current situation, a study visit at Volvo Construction Equipment (VCE) in Arvika was conducted on the 20th of February. The purpose was to see and observe other methods and procedures for quality assurance for similar products. Arvika is Volvo’s main production facility for wheel loaders and produces a large number of customized machines every year. The visit was conducted from morning to late afternoon. During the morning the visit was concentrated to the quality assurance department, where a team leader in production was followed. During the afternoon the test drive / afterflow department was followed in order to see how VCE works with quality securing. The study visit was thereby mainly based on observations and interviews.
3.3
Formulate goals
The third phase ”Formulate goals” was conducted at the end of phase number two. The third phase was about the future state and the requirements to reach the goals. The goals were specified in a requirement specification and based on the interview analysis regarding the current state. Bellgran (2009) states that the requirement specification should contain demands and goals for the optimized future state in order to improve the production system. The specification was divided into a description and a weight for each requirement.
The weight illustrated the relevance for each requirement and where to put extra ef-fort and acted thereby as a guide during the projects proceeding. The requirement specification acted as a decision maker for ideas and solutions. It was conducted when all data was collected and analyzed in order to base the weight factor on real fact.
3.4
Search for Alternatives
Phase number 4 in the project circle, search for alternatives, was mainly based on benchmark and identification of other ways to conduct quality tests. Although the phase
was number 4 in order, the search for alternatives was part of the project from the beginning until the end, both directly and indirectly. The focus on alternatives was part of the project through every meeting, interview and study visit and the project was thereby mainly focused on improvements and alternatives. Although the continuously focus on improvements and alternatives, some methods and tools have been used in order to work in a structured and efficient way.
3.4.1 Benchmark
Benchmark is according to Bergman and Klefsj¨o (2012) a method for companies to compare themselves to leading competitors and companies in order to find improvements and keys for successful development. The authors explains the idea of benchmark as a structured way to identify and find possible improvements for the internal processes. Bergman and Klefsj¨o (ibid.) further states that the ambitions should be high, i.e to become one of the best. Benchmark should not be used to copy other companies, instead the method should be used to identify successful solutions and then reflect why those are better. Bergman and Klefsj¨o (ibid.) describes the benchmark process in the following steps; Plan, Seek, Study, Analyze, Adapt and Improve.
In this thesis project the purpose of benchmark was to identify other methods that could be used to evaluate and test the MH machines. This was mainly done through a benchmark against companies with other types of machines compared to the MH series. The criteria was heavy machines designed for tough conditions and environments and non of the studied companies were thereby a direct competitor. Bergman and Klefsj¨o (ibid.) states that it is harder to benchmark competitors due the concern of protecting methods and information and the authors highlights the importance of collaboration for best re-sults. To conduct the benchmark, study visits at the chosen companies was done. Those visits was mainly based on each companies way of working with quality test and quality assurance. The first two steps in the benchmark process described above was common for all companies, but the steps after the study was separate for each and one of them. As mentioned earlier, the first visit was conducted at VCE in Arvika and their wheel loader factory. During the visit semi-structured interviews and observations was used to identify and collect the desired information. The other study visit was conducted at Epiroc Surface and Exploration Drilling (SED) in ¨Orebro and the third study visit was at Komatsu Forest in Ume˚a and their production facility for forest machines. The last study visit was conducted in order to see and analyze a vehicle inspection facility and was conducted at Opus ¨Orebro-Truckstop.
3.5
Evaluate and Choose Alternatives
During this phase ideas from the previous phases were gathered into alternatives and solutions. These ideas were combined with inputs from the four study visits and later on combined with the result from the interviews. The overall purpose with the phase was to evaluate the alternatives and then choose the final concept, based on all the previous work. When ideas were gathered into solutions, new issues appeared. As a result of continuous dialogue with the thesis stakeholders, two more delimitations were added to the thesis project during this phase;
• Lack of free space at the factory area will not be taken into consideration.
The current lack of free space is a problem. However, if the management agrees to implement the final solution this problem will be solved according to the projects supervisor.
• Test procedure for autonomous vehicles will not be analyzed.
Epiroc has some projects going on with autonomous machines, but the test procedure for these machines wont be part of this thesis due to it’s complexity. Several vehicle inspection companies in Sweden was contacted in order to analyze their future test procedure. However, none of these companies had a clear vision for the future. Instead they referred to the Swedish Transport Agency, responsible for such questions. They on the other hand referred to both European Union as wall as United Nations. With no input about autonomous vehicle inspections, it was chosen to not take these machines in consideration.
The requirement specification was used to verify that the chosen solution actually led to significant improvements for the after flow.
3.6
Develop and Finalize Chosen Concept
Phase number six acted as the last full length phase and thereby as the detail development phase in order to finalize an effective and optimized solution. The chosen alternative from the previous phase was developed further into a final solution for the current problems. The final solution have ideas and improvements collected from both the study visits and conducted interviews. The theoretical framework acted as the base for the detailed solution, i.e the chosen solution is based on theories from operational management, Lean, HMLV and quality improvements. Further the solution has taken theories regarding both machine tests and sound in consideration.
Manufacturers of test equipment were contacted during this phase with an inquiry about their possibilities to deliver a system according to the machines requirements. Due to heavy weights and axle loads several manufactures replied they were not able due to lack of knowledge and personnel. Some manufactures replied with an estimation, while some did a serious attempt to calculate the actual costs for such system. 10 manufactures were contacted, however only two were able to deliver a solution. To be able to replace the tests in the Kvarntorp mine, new ideas and solutions were discussed with both colleagues and manufactures/suppliers in order to finalize a complete solution.
3.7
Implement
Phase number 7, Implement, is the second last phase in the project circle. The implemen-tation phase will be discussed theoretically, but not analyzed in practice due to the fact that the solution cannot be tested. The implementation discussion were based on change management and theories for how to implement new solutions and ideas successfully. The chosen solution will affect several positions, making it necessary to implement the solution in the right way. Focus has thereby been on how to ensure commitment and understanding.