Umeå University Medical Dissertations, New Series No 1713
Physiological demands of competitive
elite cross-country skiing
Magnus Carlsson
Department of Community Medicine and Rehabilitation Sports Medicine Unit
Umeå University Umeå 2015
Responsible publisher under swedish law: the Dean of the Medical Faculty This work is protected by the Swedish Copyright Legislation (Act 1960:729) New Series No 1713
TABLE OF CONTENTS
Table of Contents
Abstract I Abbreviations III List of publications V Introduction 1 Cross-country skiing 1History of cross-country skiing 1
History of competitive cross-country skiing 1
Recent changes in competitive cross-country skiing 2
Physics of cross-country skiing 3
Energy supply during cross-country skiing 3
Recent investigations of the physiological demands in cross-country skiing 4
Aims 7 Methods 9 Overall design 9 Subjects 9 Measuring equipment 9 Oxygen-uptake measurements 9 Ski-ergometer measurements 10 Vertical-jump measurements 10 Isokinetic measurements 10 Blood-lactate measurements 10 Body-composition measurements 10 Physiological measurements 11
Variables obtained during the lactate-threshold tests 12
Variables obtained during the maximal and peak oxygen-uptake tests 13
Variables obtained during the mean oxygen-uptake tests 14
Variables obtained during the double-poling tests 14
Variables obtained during the body-composition test 14
Variables obtained during the knee-extension and vertical-jumps tests 14
Competitive performances 14
Cross-country skiing competitions 15
International Ski Federation’s ski-ranking points 15
Statistics 16
Correlation analyses 16
Multiple regression analyses 16
Presentation of data 16
Statistical programs 16
Ethical considerations 17
Results 19
Lactate-threshold tests 19
Maximal and peak oxygen-uptake tests 20
Mean oxygen-uptake tests 21
Double-poling tests 22
Body-composition test 23
Knee-extension and vertical-jumps tests 23
Competetive performance 24
Multiple regression models 24
Discussion 25
Principal findings 25
Lactate threshold 25
Oxygen uptake 27
Power output and body composition 29
Multiple regression model 31
Practical implications 32
Strength and limitations 32
Future perspectives 34
Conclusion 34
Funding 35
Acknowledgements 37
ABSTRACT
Abstract
Introduction Researchers have, for decades, contributed to an increased collective
understanding of the physiological demands in cross-country skiing; however, almost all of these studies have used either non-elite subjects and/or performances that emulate country skiing. To establish the physiological demands of cross-country skiing, it is important to relate the investigated physiological variables to the competitive performance of elite skiers. The overall aim of this doctoral thesis was, therefore, to investigate the external validity of physiological test variables to determine the physiological demands in competitive elite cross-country skiing.
Methods The subjects in Study I – IV were elite male (I – III) and female (III – IV)
cross-country skiers. In all studies, the relationship between test variables (general and ski-specific) and competitive performances (i.e. the results from competitions or the overall ski-ranking points of the International Ski Federation (FIS) for sprint (FISsprint) and distance (FISdist) races) were analysed. Test variables reflecting the subject’s general strength, upper-body and whole-body oxygen uptake, oxygen uptake and work intensity at the lactate threshold, mean upper-body power, lean mass, and maximal double-poling speed were investigated.
Results The ability to maintain a high work rate without accumulating lactate is an
indicator of distance performance, independent of sex (I, IV). Independent of sex, high oxygen uptake in whole-body and upper-body exercise was important for both sprint (II, IV) and distance (I, IV) performance. The maximal double-poling speed and 60-s double-poling mean power output were indicators of sprint (IV) and distance performance (I), respectively. Lean mass was correlated with distance performance for women (III), whereas correlations were found between lean mass and sprint performance among both male and female skiers (III). Moreover, no correlations between distance performance and test variables were derived from tests of knee-extension peak torque, vertical jumps, or double poling on a ski-ergometer with 20-s and 360-s durations (I), whereas gross efficiency while treadmill roller skiing showed no correlation with either distance or sprint performance in cross-country skiing (IV).
Conclusion The results in this thesis show that, depending on discipline and sex,
maximal and peak oxygen uptake, work intensity at the lactate threshold, lean mass, double-poling mean power output, and double-poling maximal speed are all externally valid physiological test variables for evaluation of performance capability among elite cross-country skiers; however, to optimally indicate performance capability different test-variable expressions should be used; in general, the absolute expression appears to be a better indicator of competitive sprint performance whereas the influence of body mass should be considered when evaluating competitive distance performance capability of elite cross-country skiers.
ABBREVIATIONS
Abbreviations
ATP Adenosine triphosphate
CI Confidence interval
CMJ Counter-movement jump
CMJA Counter-movement jump with an arm swing DP20Fpeak Peak force during 20 s double poling DP60Pmen Mean power during 60 s double poling
DP60V̇O2mean Mean oxygen uptake during 60 s double poling (equivalent to
V̇O2dp)
DP360Pmean Mean power during 360 s double poling
DP360V̇O2mean Mean oxygen uptake during 360 s double poling
DXA Dual-emission x-ray absorptiometry FIS International Ski Federation
FISdist International Ski Federation’s ski-ranking points for distance races
FISsprint International Ski Federation’s ski-ranking points for sprint races
GE Gross efficiency
LM Lean mass
LMLB Lean mass lower body
LMUB Lean mass upper body
LMWB Lean mass whole body
OBLA4mmol Relative work intensity at a blood-lactate concentration of 4 mmol·l-1
PT60 Mean isokinetic knee extension peak torque with angular velocity 60°·s-1
PT180 Mean isokinetic knee extension peak torque with angular velocity 180°·s-1
PT300 Mean isokinetic knee extension peak torque with angular velocity 300°·s-1
r Correlation coefficient
RER1.0 Relative work intensity where respiratory-exchange ratio reached 1.0
Rise1mmol Relative work intensity where blood-lactate concentration had increased 1 mmol·l-1 above the lowest measured concentration
SD Standard deviation
SNC15 Performance at the 15 km race at the Swedish National Championships
SNC30 Performance at the 30 km race at the Swedish National Championships
SQJ Squat jump
VAS Visual analogue scale
Vmax Maximal speed
V̇O2dp Mean oxygen uptake during 60 s of double poling (equivalent to
DP60V̇O2mean)
V̇O2max Maximal oxygen uptake
V̇O2obla Oxygen uptake related to a blood-lactate concentration of
4 mmol∙l-1
LIST OF PUBLICATIONS
List of publications
This doctoral thesis is based on the following original studies and they will hereafter be referred to by their roman numerals.
I Carlsson M, Carlsson T, Hammarström D, Tiivel T, Malm C, Tonkonogi M. Validation of physiological tests in relation to competitive performances in elite male distance cross-country skiing. J Strength Cond Res. 2012;26:1496-504.
II Carlsson M, Carlsson T, Knutsson M, Malm C, Tonkonogi M. Oxygen uptake at different intensities and sub-techniques predicts sprint performance in elite male cross-country skiers. Eur J Appl Physiol. 2014;114:2587-95.
III Carlsson M, Carlsson T, Hammarström D, Malm C, Tonkonogi M. Prediction of race performance of elite cross-country skiers by lean mass. Int J Sports Physiol Perform. 2014;9:1040-5.
IV Carlsson M, Carlsson T, Wedholm L, Nilsson M, Malm C, Tonkonogi M. The physiological demands of competitive sprint and distance performance in elite female cross-country skiing. Submitted
The studies within this thesis are reprinted with permission from the original publisher.
INTRODUCTION
Introduction
Cross-country skiing
History of cross-country skiing
Knowledge, creativity, ingenuity, and, occasionally, serendipity are some of the underlying qualities that give rise to solutions to problems. To move more effectively in different environments, humans have invented tools, e.g. fins, boats, and wheels, to help compensate for the limitations of the human body [1]. To be able to move through snow-covered terrain as swiftly and effortless as possible was most likely important for the survival of inhabitants in places with long, freezing winters [2]. Faced with this problem, a long time ago, someone acquired the knowledge that it was easier to move through the snow-covered terrain by placing themselves on an object that distributes the body weight over a larger surface area than the feet, thereby reducing the risk of sinking down into the snow. This knowledge gave rise to the invention of snowshoes and skies, and the oldest preserved skis are approximately 5200 years old [3]. In the 50’s, it was scientifically shown that it is far more efficient in terms of movement economy to use skies than to use snowshoes or to walk [4]. During the Viking Age (AD 700 to 1100), cross-country skiing was strongly associated with the Asa God Ull, who was considered to be the best skier and archer of all of the Asa Gods [3]. Throughout the millennia, cross-country skiing has evolved from being equated as a means of transportation of Gods and an important mode of transportation while hunting to a demanding endurance sport, where the hunt for wildlife has been replaced with a hunt for seconds.
History of competitive cross-country skiing
The first known cross-country skiing race was held in Oslo, Norway, in the year 1767, with soldiers as participants [5]. The first documented race that was open to the public was held in 1848 in Tromsø, Norway [5,6]. In Sweden, the first public race was held in 1879 in Stockholm; however, the first race that attracted much attention from both the media and the public was the Nordensiöld race in 1884, which had a race distance of 220 km and a substantial cash prize for the winner [5]. The race was launched by the famous arctic explorer to prove to nonbelievers the veracity of the reported information concerning the skiing distance covered in a short time, as was performed by two of the skiers in the expedition, during their second Greenlandic exploration in 1883 [5]. Fifteen men entered the competition, and the winner’s time was 21 hours and 22 minutes, proving that the reported information was not exaggerated [5]. In the year 1882, the association for the promotion of cross-country skiing was founded, which resulted in organized skiing competitions [5]. Although there was newfound popularity among the public, a great
distrust of this new sport also developed because children’s parents felt that this sport was harmful to practice [7]. To scientifically clarify if this sport was harmful or beneficial to health, Dr. Henschen conducted a series of investigations on skiers before and after competitions and concluded in his thesis in 1897 that skiers with the enlarged hearts were more successful than skiers with smaller hearts, therefore stating that “big hearts win races!” He also concluded that cross-country skiing should be encouraged as a form of exercise that is beneficial to health [7]. Along with an increased interest in participating in cross-country skiing, the number of ski clubs also increased. On December 11th 1908, the Swedish Ski Association became a member of the Swedish Sports Confederation. Moreover, the International Ski Federation (FIS) was founded on the 18th of February in 1910. Cross-country skiing has, since the first Games in 1924 in Chamonix, France, been a part of the Winter Olympics. Twenty-eight years later (1952), the first cross-country skiing event for women was included in the Winter Olympic program.
Recent changes in competitive cross-country skiing
The 50 km race at the Olympic Games in 1924 was held in the French Alps and had an “up and down” course profile, where the start was at 1100 m above sea level and the highest point at 1800 m; this resulted in very demanding uphill skiing at first as well as a terrifying descent during the last part of the race [5]. Today, certified FIS courses are, for example, homologated (e.g. distribution of approximately 1/3 each of uphill, downhill, and undulating terrain) and have a minimum prepared course width of 3 – 12 m, depending on the discipline [8]. Traditional cross-country skiing was performed using a classical style comprising herringbone, double-poling, kick double-poling, and diagonal-stride techniques [9]. However, in the 80’s, the freestyle was developed to increase skiing speed and was accepted as a new style by the FIS in 1986 [10]. The freestyle has five predominant sub-techniques, which are known as gears (G1-5) in the Swedish nomenclature [11], and is faster compared with classical style [12]. In the 90’s, the sprint discipline, with a race distance of 0.8 to 1.8 km, was introduced. Currently, cross-country skiing comprises different distances (0.8 to 50 km), styles (classical and free), and starting methods (interval and mass starts). In addition, double pursuit with a mandatory ski change adds to the complexity of the sport. Along with improved track preparation and technological advances in ski equipment, there has been an increased usage of the double-poling technique in classical races [13,14]. In recent years, several skiers have used the double-poling technique exclusively throughout World Cup sprints and competitions included in the FIS Marathon Cup. Consistent with this change, cross-country skiing research has suggested that a greater proportion of a skier’s training should focus on developing upper-body strength and power output [15-21].
INTRODUCTION
Physics of cross-country skiing
In cross-country skiing, the goal of the skier is to create the largest possible imbalance between propulsive and counteractive forces throughout the race; in general, greater imbalance leads to higher speed and a faster finishing time. There are several counteracting forces that the skier must overcome to create forward motion, as follows: work against gravity in ascents and during the stride cycle, air resistance, ski friction, and translational and rotational kinetic-energy changes during the stride cycle. Previously, it has been suggested that the counteracting forces affecting the skier during skiing are all related to body mass. Therefore, a skier with larger body mass must generate higher propulsive forces compared with a lighter skier to have the same skiing speed in level and uphill terrain; conversely, a large body mass is advantageous when potential energy is transformed to kinetic energy in descents [22]. Skeletal muscle forces are transferred through the skis and poles to the snow for propulsion, and the force-generating potential is related to the skeletal muscle cross-sectional area [23-27]. However, the proportion of the generated muscle forces that contributes to the propulsive forces depends on the efficiency of the skier’s movement pattern in the specific sub-technique.
Energy supply during cross-country skiing
A prerequisite for power production by the muscles is the availability of adenosine triphosphate (ATP); to continuously generate high propulsive forces, rapid synthesis of ATP in exercising muscles is necessary. This is emphasized by the potential 400-fold increase in the ATP turnover rate for exercising compared with resting skeletal muscles [28].
ATP can be synthesized through both aerobic and anaerobic pathways. During aerobic ATP synthesis, oxidative phosphorylation occurs in the mitochondria, which is an effective but relatively slow process. The aerobic processes are dependent on the availability of oxygen in the exercising muscles, and the aerobic energy supply system is limited by the ability of the cardiorespiratory system to deliver oxygen to the exercising muscles [29]. The available anaerobic pathways involve the usage of stored ATP as well as the synthesis of ATP by phosphocreatine splitting and adenosine diphosphate fusion and the anaerobic catabolism of carbohydrates to lactic acid. Together, these anaerobic pathways allow the muscles to generate force when the oxygen supply is limited. The processes are rapid but have a limited capacity compared with the aerobic system. If the oxygen supply does not meet the increased oxygen demand in the exercising muscles, a larger proportion of the required ATP will come from the anaerobic catabolism of carbohydrates, which will result in a more rapid depletion of intracellular glycogen stores and an increased production of fatigue-related metabolites [30]. The anaerobic capacity has previously been related to the muscle volume [31,32] which, to some extent, could be explained by the proportional increase in available energy stores with an increase in volume [31]. This is consistent with the the results where the anaerobic energy
production during intense exercise was shown to be related to the muscle mass involved [33]. The proportion of the required ATP that comes from aerobic and anaerobic pathways, respectively, depends mainly on the duration of the race [34].
In cross-country skiing, sprint races generally last from 2 to 4 minutes, indicating that the proportion of energy derived from aerobic processes ranges from 50-70% (i.e. 50-30% anaerobic energy contribution); whereas the corresponding value for distance races (5-50 km), with a skiing time from 13 min to more than 2 hours, ranges from 90-99% [34,35]. This difference in the aerobic energy contribution indicates that there is a potential difference in the physiological demands between sprint and distance disciplines.
To evaluate the capability of a skier’s aerobic processes, oxygen uptake is analysed at different intensities and with different sub-techniques. For elite skiers, the maximal oxygen uptake (V̇O2max) is reached using the diagonal-stride
technique [35], whereas the oxygen uptake at maximal work intensity for the other sub-techniques is less than the V̇O2max [15,35-38] and is generally reported as the
peak oxygen uptake (V̇O2peak). In this thesis, the different oxygen uptake variables
are therefore referred to accordingly.
Recent investigations of the physiological demands in cross-country skiing With the various recent changes (e.g. the inclusion of sprint, freestyle, and mass-start races, improved track preparation and ski equipment), it can be assumed that the physiological demands have changed to meet the new prerequisites. Generally, studies on sport performance need to be externally valid; hence, the dependent variable need to be a competitive performance with athletes that belong to the targeted population to whom the result is intended to be generalizable to [39,40]. Therefore, to determine the physiological demands in modern elite cross-country skiing, research should be based on the relationship between competitive performance (i.e. the results of skiing competitions or FIS overall ski-ranking points for sprint (FISsprint) and distance (FISdist) races) and the physiological characteristics of elite skiers competing at the senior level. It is important that all of these criteria are met to obtain accurate information concerning the physiological demands of competitive elite cross-country skiing.
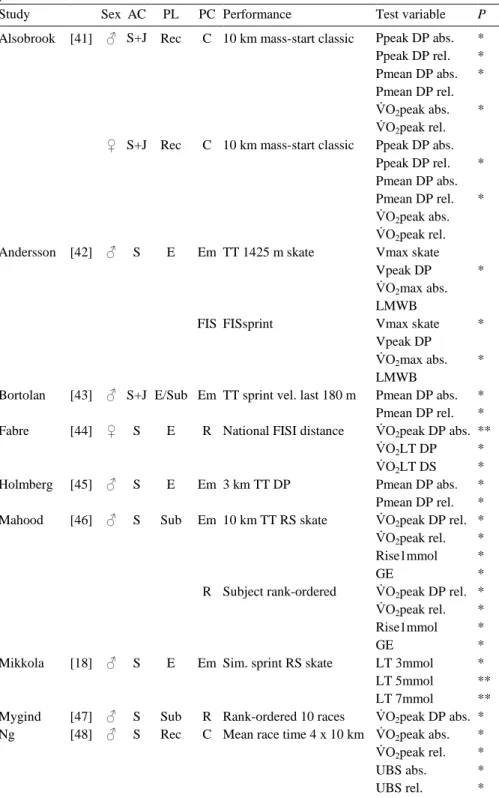
When reviewing previous research from the 80’s (when the major changes in cross-country skiing began) to the time when the research plan for this thesis was written in 2010, a limited number of studies were identified as having investigated correlations between test variables and performance (Table 1).
INTRODUCTION
Table 1. Studies (1980-2010) which has investigated correlations between test variables and
performances
Study Sex AC PL PC Performance Test variable P
Alsobrook [41] ♂ ♀ S+J S+J Rec Rec C C 10 km mass-start classic 10 km mass-start classic Ppeak DP abs. Ppeak DP rel. Pmean DP abs. Pmean DP rel. V̇O2peak abs.
V̇O2peak rel.
Ppeak DP abs. Ppeak DP rel. Pmean DP abs. Pmean DP rel. V̇O2peak abs.
V̇O2peak rel.
* * * * * * Andersson [42] ♂ S E Em FIS TT 1425 m skate FISsprint Vmax skate Vpeak DP V̇O2max abs.
LMWB Vmax skate Vpeak DP V̇O2max abs.
LMWB
*
* * Bortolan [43] ♂ S+J E/Sub Em TT sprint vel. last 180 m Pmean DP abs.
Pmean DP rel. * * Fabre [44] ♀ S E R National FISI distance V̇O2peak DP abs.
V̇O2LT DP
V̇O2LT DS
** * * Holmberg [45] ♂ S E Em 3 km TT DP Pmean DP abs.
Pmean DP rel. * * Mahood [46] ♂ S Sub Em R 10 km TT RS skate Subject rank-ordered
V̇O2peak DP rel.
V̇O2peak rel.
Rise1mmol GE
V̇O2peak DP rel.
V̇O2peak rel.
Rise1mmol GE * * * * * * * * Mikkola [18] ♂ S E Em Sim. sprint RS skate LT 3mmol
LT 5mmol LT 7mmol
* ** ** Mygind [47] ♂ S Sub R Rank-ordered 10 races V̇O2peak DP abs. *
Ng [48] ♂ S Rec C Mean race time 4 x 10 km V̇O2peak abs.
V̇O2peak rel.
UBS abs. UBS rel. * * * *
Table 1. Continue.
Study Sex AC PL PC Performance Test variable P
Staib [20] ♂ S+J Sub R National FIS distance V̇O2peak abs.
V̇O2peak 0.67
V̇O2peak rel.
V̇O2peak DP abs.
V̇O2peak DP 0.67
V̇O2peak DP rel.
Ppeak DP abs. Ppeak DP rel. * * * * * * Stöggl [49] ♂♀ S E/Sub Em 1 km TT RS DP Vmax DP *** Stöggl [50] ♂ S E/Sub Em Sim. sprint TRS classic Vmax DP
Vmax DS V̇O2max 0.67
V̇O2max rel.
*** ***
Stöggl [21] ♂♀ S E Em 1 km TRS DP Ppeak DP ***
Subjects sex, ♂, men; ♀, women; AC, age category; S, senior; J, junior; PL, performance level of the subjects, E, elite; Sub, sub-elite; Rec, recreational; PC, performance category, Em, performance emulating country skiing; C, cross-country skiing competition; R, different type of ranking; FIS, International Ski Federation’s ski-ranking points for sprint (FISsprint) and distance (FISdist); FISI, Italian Ski Federation’s ski-ranking points; TT, time trial; RS, roller skiing; TRS, treadmill roller skiing; DP, double-poling technique; Ppeak, peak power output; V̇O2peak, peak oxygen uptake;
Pmean, mean power output; V̇O2LT, oxygen uptake at the anaerobic threshold; V̇O2max,maximal oxygen uptake using
the diagonal-stride technique; Vmax; maximal speed; Vpeak, peak speed; LMWB, lean mas for the whole body; Rise1mmol, relative work intensity where blood lactate had increased 1 mmol∙l-1 above the lowest measured
concentration; GE, gross efficiency; LT, lactate threshold; UBS, isokinetic upper-body strength; abs, absolute expression; rel, relative expression; reported alpha levels of significance for the included studies are: * for P < 0.05; ** for P < 0.01; and *** for P < 0.001.
When summarizing the results of the included studies in Table 1, two studies met all of the aforementioned criteria [42,44]; no study has investigated the relationship between distance performance and the V̇O2max or variables of lean mass. Several of
the other variables, included in Table 1, have only been investigated on one occasion. Moreover, merely two studies have investigated the relationship between test variables and distance performance among elite female skiers, and no study has used women’s sprint performance as a dependent variable.
Because of this limited research and the wide variety of new elements affecting cross-country skiing performance, it is essential that further investigations be performed to increase the knowledge regarding the physiological demands in competitive elite male and female cross-country skiing.
AIMS
Aims
The overall aim of this doctoral thesis was to investigate the external validity of physiological test variables to determine the physiological demands in competitive elite cross-country skiing. The specific aims of the original studies included in this thesis were:
I To establish which physiological test parameters reflects the distance performances in the Swedish National Championships in cross-country skiing (SNC) and the International Ski Federation’s (FIS) ranking points for distance performances (FISdist). The present study also aimed to create multiple regression models to describe skiing performance for the SNC distance races and FIS ranking.
II To investigate the relationship between sprint-prologue performance (using the classical technique) and the V̇O2obla, V̇O2max, and V̇O2dp.
III To investigate the relationship between race performance and LM variables, as well as to examine sex differences in body composition in elite cross-country skiers.
IV To investigate the relationship between elite females’ competitive performance capability in sprint and distance cross-country skiing and the variables of gross efficiency (GE), work rate at the onset of blood-lactate accumulation (OBLA4mmol), maximal oxygen uptake (V̇O2max), maximal speed (Vmax),
METHODS
Methods
Overall design
The overall design of this thesis was to investigate external validity of physiological test variables by correlating the test variables with competitive performance from the targeted population of elite male and female skiers.
Subjects
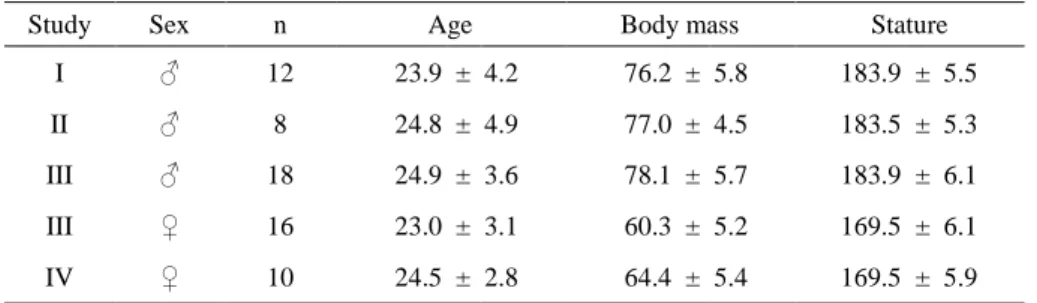
In total, 50 subjects (29 men and 21women) elite cross-country skiers, including 26 with World Championships and/or World Cup experience (14 men and 12 women), volunteered to participate in the studies included in this thesis. Some of the subjects volunteered to more than one study, more precisely, five men and five women took part in two studies, while two men took part in three studies. The characteristics of the subjects for each study are presented in Table 2.
Table 2. The characteristics of the subjects included in Study I – IV
Study Sex n Age Body mass Stature I ♂ 12 23.9 ± 4.2 76.2 ± 5.8 183.9 ± 5.5 II ♂ 8 24.8 ± 4.9 77.0 ± 4.5 183.5 ± 5.3 III ♂ 18 24.9 ± 3.6 78.1 ± 5.7 183.9 ± 6.1 III ♀ 16 23.0 ± 3.1 60.3 ± 5.2 169.5 ± 6.1 IV ♀ 10 24.5 ± 2.8 64.4 ± 5.4 169.5 ± 5.9
The values representing the subjects’ age, body mass, and stature are presented as mean ± SD; ♂, men; ♀, women; n, the number of subjects in the specific study; Age, the age of the subjects (years); Body mass, the body mass of the subjects (kg); Stature, the height of the subjects (cm).
Measuring equipment
Brief descriptions of the equipment used to measure physiological capabilities of the subjects in Study I – IV are presented below. For more detailed description of the measuring equipment, see the studies.
Oxygen-uptake measurements
Throughout the oxygen-uptake tests, parameters of expired air were continuously analysed using a stationary metabolic cart in mixing chamber mode (Jaeger Oxycon Pro, Erich Jaeger Gmbh, Hoechberg, Germany) (I, II, IV) and a mobile metabolic unit (Jaeger Oxycon Mobile, Erich Jaeger Gmbh, Germany) (I). Both equipment have previously been shown to be accurate systems for measuring oxygen uptake [51,52]. Prior to each new test, the equipment were calibrated according to the specifications of the manufacturer.
Ski-ergometer measurements
An air-braked Nordic ski-ergometer (Concept II, Concept Inc., Morrisville, VT, USA) was used to measure the subject’s poling force and velocity during the double-poling cycles (I). The ski-ergometer has previously been shown to be both reliable and valid [45]. To measure the horizontal force and velocity for the double-poling cycles, a load cell (Load Cell, model 333A, Ergotest Technology AS, Norway) and a linear encoder (Linear encoder, Ergotest Technology AS, Norway) were attached to the ski-ergometer. Prior to each new subject, the load cell was checked for zero load and with a 10-kg precision weight, whereas the linear encoder was controlled for a known length.
Vertical-jump measurements
The maximal jump height was determined with an infra-red mat based IVAR-system (IVAR Jump & Speed Anayzer, LN Sport Konsult HB, Sweden), which calculates the vertical jump height based on the subject’s flight time. The system have previously shown to be reliable and valid [53].
Isokinetic measurements
The isokinetic peak torque measurements at different angular velocities were performed using a Biodex muli-joint dynamometer 2 (Biodex Medical Systems Inc., NY, USA). At the start of each new test day, the equipment was calibrated according to the specifications of the manufacturer. It has previously been reported the Biodex is reliable equipment for measuring isokinetic strength [54], and it is considered to be the golden standard for measuring the knee-extension peak torque [55].
Blood-lactate measurements
The capillary-blood samples, collected during and after the roller-skiing tests were analysed to determine the subject’s blood-lactate concentrations (Biosen 5140, EKF-diagnostic Gmbh, Barleben, Germany). The equipment was calibrated according to the manufacturer’s specifications and the equipment has shown to be both a reliable and valid blood-lactate analyser [56].
Body-composition measurements
The body composition of the subjects was measured using dual-emission X-ray absorptiometry (DXA) (GE Healthcare Lunar, Madison, USA), and were analysed by the DXA software (enCORE, Version 13.6, General Electric Company, Madison, USA). The equipment was calibrated each day, according to the manufacturer’s instructions, by using a standardized phantom. When an appropriate protocol designed to minimize the influence of the potential confounding factors is applied,
METHODS
Physiological measurements
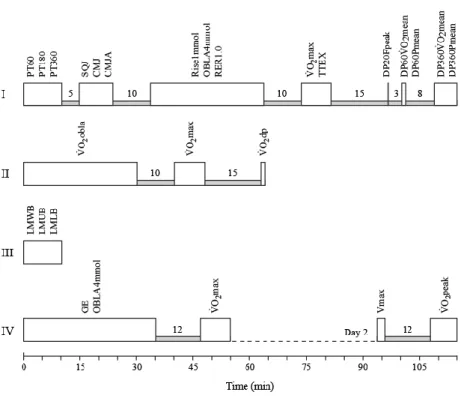
The analyses in Study I – IV are based on physiological variables collected from both general and ski-specific tests. A schematic overview of the study designs (I – IV) is presented in Figure 1. Brief descriptions of test procedures and test variables are presented below. For more detailed information of the test procedures and variables, see the studies. The roller-skiing tests in the studies were performed on two motor-driven treadmills (OJK-2; Telineyhtymä, Kotka, Finland (I, II); Saturn 450/300rs, h/p/cosmos sports & medical GmbH, Nussdorf-Traunstein, Germany (IV)).
Figure 1. Schematic overview of the study designs (I – IV), where the white blocks represents the physiological tests and the associated test variables whereas the gray blocks represents the rest between tests.
Variables obtained during the lactate-threshold tests
The lactate-threshold test was performed treadmill roller skiing using the diagonal-stride technique. The test protocols had an incremental exercise test design, where the duration of each work intensity was 3.5 min (I, II) or 4 min (IV). Directly after each stage, a capillary-blood sample was collected; thereafter, the work intensity was increased by increasing treadmill speed and/or inclination (for test protocols, see the studies). Based on the relationship between blood-lactate concentration and work intensity, the relative work intensity (W·kg-1) where blood-lactate concentration had increased 1 mmol·l-1 above the lowest measured concentration (Rise1mmol) (I), and the relative work intensity at blood lactate concentration of 4 mmol∙l-1
(OBLA4mmol) (I, IV) were determined (Figure 2a).
During the last minute of each stage, volume of both oxygen uptake and produced carbon dioxide were determined. For each subject, the linear relationship between relative work intensity and oxygen uptake was established and based on this relationship, the oxygen uptake at the relative work intensity corresponding to a blood-lactate concentration of 4 mmol∙l-1 (V̇O2obla) was calculated (II) (Figure 2b).
Figure 2. Determination of test variables related to the lactate-threshold test, where i, the relative work intensity where blood-lactate concentration have increased 1 mmol·l-1 above the lowest measured
concentration; ii, the relative work intensity at a blood-lactate concentration of 4 mmol·l-1; iii, the oxygen
uptake related to the relative work intensity (ii) at the onset of the blood-lactate concentration of 4 mmol∙l-1.
Based on the relationship between V̇CO2/V̇O2-ratio and work rate, the relative
work intensity where the respiratory-exchange ratio reached 1.0 (RER1.0) (I) was established. In Study IV, the subject’s gross efficiency (GE) was determined for a
METHODS
specified intensity, i.e. GE = WR / MR (for more information about the calculations regarding GE, see Study IV).
Variables obtained during the maximal and peak oxygen-uptake tests
The test to determine the subject’s V̇O2max was an incremental treadmill
roller-skiing test using the diagonal-stride technique, where the work intensity increased every 30 s (IV) or 60 s (I, II) depending on which test protocol that was used (for detailed descriptions of the test protocols, see the studies). During the V̇O2max test,
the subject’s oxygen uptake was continuously analysed and the V̇O2max was
defined as the highest mean oxygen uptake during a 60-s period when meeting specific criterion(s). The criterions in Study I was: (a) plateau in oxygen uptake i.e. less than 2.1 ml∙min-1∙kg-1 in V̇O
2 between successive stages; (b) at least one of two
secondary criteria, a respiratory exchange ratio ≥ 1.15 or a blood-lactate concentration > 8 mmol∙l-1
, had to be fulfilled [60]. In Study II and IV, the criterion was the recognition of data points that fell outside (and below) the extrapolated CI for the V̇O2 – work-intensity relationship (established for a period of 3 min
immediately preceding the levelling-off behaviour) (Figure 3) [61]. This criterion for a plateau in oxygen uptake was also used in Study IV to determine the subject’s highest mean oxygen uptake during a 60-s period (V̇O2peak). The V̇O2peak test was
commenced roller skiing on a treadmill using double-poling technique and the work intensity was increased every 30 s. In addition to the V̇O2max, the time to
exhaustion (TTEX) was used as a test variable in Study I.
Variables obtained during the mean oxygen-uptake tests
During the ski-ergometer double-poling tests with test duration of 60 s (I, II) and 360 s (I), the oxygen uptake was continuously analysed for the whole test duration. Based on the oxygen-uptake measurements during the tests, the subject’s mean oxygen uptake for the 60-s (DP60V̇O2mean (I) and V̇O2dp (II)) and 360-s
(DP360V̇O2mean) double-poling tests was determined.
Variables obtained during the double-poling tests
Simultaneously with the oxygen-uptake measurements during the double-poling tests, the subject’s mean double-poling power output for the 60-s (DP60Pmean) and 360-s (DP360Pmean) was determined by using the force and displacement measurements during the test. In addition to the power-output measurements in Study I, a 20-s double-poling test was used to determine the peak force produced during a single double-poling cycle (DP20Fpeak). In Study IV, the subject’s maximal roller-skiing speed using the double-poling technique (Vmax) was determined by using speed increments of 1 km·h-1 every 4 s while maintaining a constant treadmill inclination. The subject’s Vmax was determined as the treadmill speed of the last completed 4-s stage.
Variables obtained during the body-composition test
The body composition of the subject was analysed using DXA and the subject’s lean mass, fat mass, and bone-mineral content for whole body and body segments (head and neck, arms, trunk, and legs) was determined. The test variables used in the correlation analyses were lean mass in the whole body (LMWB), upper body (arms + trunk) (LMUB), and lower body (legs) (LMLB).
Variables obtained during the knee-extension and vertical-jumps tests
The isokinetic knee-extension peak torque was determined, with a 90° range of motion, for three different angular velocities: 60°·s-1, 180°·s-1, and 300°·s-1 using a Biodex dynamometer. The peak-torque value for the right and left leg were used to calculate a mean-peak torque value for each of the tested velocities and the test variables derived from the peak-torque test were PT60, PT180, and PT300 (I).
In Study I, three different vertical-jump tests were performed. The highest jump height for squat jump (SQJ), counter-movement jump (CMJ) and counter-movement jump with an arm swing (CMJA) were used as test variables.
Competitive performances
The investigated variables in Study I – IV are related to elite male and female competitive cross-country skiing performances, i.e. the results of skiing competitions, FISsprint or FISdist. Descriptions of the performances included in the
METHODS
Cross-country skiing competitions
All cross-country skiing competitions were performed on homologated courses that met the criteria of international competition courses [62], and the track and waxing conditions were stable during the competitions. In Study I, performance data were collected from competitions at the Swedish National Championships (SNC). Completion times from the men’s 15-km competition in classical style with interval start (SNC15c) and the men’s 30-km double-pursuit competition in mass start (SNC30) were used as performance variables. In Study II, performance data was collected from a 1.25-km sprint prologue in classical technique for men. In Study III, completion times in the SNC from the women’s 10-km free-style competition (SNC10) and 1.55-km sprint prologue as well as the men’s 15-km free-style competition (SNC15f) and 1.76-km sprint prologue were used as performance variables. For more detailed information concerning the competitions, see the studies.
International Ski Federation’s ski-ranking points
The FISsprint (II, IV) and FISdist (I, IV) were used as indicators of competitive cross-country skiing performance. To determine the participants’ performance capability in sprint and distance races, ski ranking points were obtained from the FIS Cross-Country List which was the most recent published for each study. The FIS-point system is intended to rank the skiers and a lower FIS-FIS-point value indicates better performance ability. A participant’s FISdist and FISsprint are based on an average of the skier’s best five FIS-point results from the last twelve months in distance and sprint competitions, respectively.
For a specific skiing competition, the skier receives a FIS-point value which is the sum of the race points and the race penalty, i.e. FIS-points = Race points + Race penalty. Calculation of a skier’s race points is based on the formula: Race points = ([Tx·To-1] – 1) · RF, where: Tx = the skier’s race time (s), To = the winner’s race time
(s), RF = the race factor (800 for distance competitions with interval start, 1200 for sprint races, and 1400 for competitions with mass-start and skiathlon races). For example, for distance competitions with interval start the skier receives 8 race points for each percent in race time behind the winner. The race penalty is calculated as the sum of the three best FIS-points values of the competitors who finished among top five of the race divided by 3.75. If the calculated race penalty is lower than the minimum penalty of the specific race, the minimum penalty is applied to the race. The minimum penalty for FIS competitions is 15. For races included in the World Cup, World Championships, and Olympic Winter Games no race penalty is added to the FIS-point value (i.e. race penalty is fixed to 0).
Statistics
The investigations to establish the physiological demands of competitive elite cross-country skiing were mainly based on correlation analyses between physiological variables and competitive performance in cross-country skiing. If two or more physiological variables were correlated with a specific performance variable, the possibility to create a multiple regression model was evaluated. All of the tests performed at an alpha of 0.05.
Correlation analyses
Prior to the correlation analyses, the potential occurrence of outliers was analysed and the variables agreement with a normal distribution were investigated by using the Kolmogorov-Smirnov test (I, III) and the Shapiro-Wilk test (II, IV). All of the test and performance variables included in the correlation analyses fulfilled the assumptions of level of measurement (interval or ratio scale), related pairs (each subject has a score on both the physiological and performance variable), independence of observations (all test and performance data are independent of one another), linear relationship between variables, homoscedasticity (similar variability for all scores of the performance variable). The correlation analyses were performed by using Pearson’s product-moment correlation coefficient test and the relationships between physiological and performance variables are reported as correlation coefficients (r).
Multiple regression analyses
The multiple regression analyses were used investigate how much of the variance in performance that could be explained by two (or more) physiological variables derived from different tests. The rules set to determine a valid model were (a) each of the test variables should display significant correlation with the performance variable, (b) the test parameters were not allowed to be intercorrelated (i.e. r < 0.7), (c) each test parameter should significantly contribute to the model (i.e. P < 0.05), and (d) to avoid multicolinearity, the variance-inflation factor should be less than 2 and the tolerance value should be higher than 0.3.
Presentation of data
The characteristics of the subjects, test results, and performance data are presented as the means and standard deviations (SD). In addition, ranges (minimum value– maximum value) were presented in Study I.
Statistical programs
The statistical analyses in Study I – IV were processed using the IBM Statistical Package for the Social Sciences (SPSS) statistics software, version 20 (IBM
METHODS
Ethical considerations
Before participation in Study I – IV, all of the subjects provided written informed consent to participate. Approvals for the studies were given by the Ethics Committee at Dalarna University, Falun, Sweden (I) and the Regional Ethical Review Board, Uppsala, Sweden (II – IV). All test procedures in the studies were performed in accordance with the World Medical Association Declaration of Helsinki – Ethical Principles for Medical Research Involving Human Subjects 2008.
RESULTS
Results
Correlations
The relationships between the investigated test variables and competitive cross-country skiing performances in Study I – IV are presented, depending on which test each variable is linked to, in Table 3-7.
Lactate-threshold tests
The relationships between test variables related to the lactate-threshold test and competitive distance and sprint performances are presented in Table 3.
Table 3. Correlations between test variables related to the lactate-threshold test and
competitive performance
Study Sex Test variable (Unit) Performance (Unit) r
Distance performance
I ♂ Rise1mmol (W·kg-1) FISdist (points) -0.69 *
I ♂ Rise1mmol (W·kg-1) SNC15c (s) -0.71 ** I ♂ Rise1mmol (W·kg-1) SNC30 (s) -0.68 * I ♂ RER1.0 (W·kg-1) FISdist (points) -0.77 ** I ♂ RER1.0 (W·kg-1) SNC15c (s) -0.73 **
I ♂ RER1.0 (W·kg-1) SNC30 (s) -0.62 I ♂ OBLA4mmol (W·kg-1) FISdist (points) -0.66 *
I ♂ OBLA4mmol (W·kg-1) SNC15c (s) -0.66 * I ♂ OBLA4mmol (W·kg-1) SNC30 (s) -0.63 IV ♀ OBLA4mmol (W·kg-1) FISdist (points) -0.64 * IV ♀ GE (%) FISdist (points) -0.48
Sprint performance
II ♂ V̇O2obla (l·min-1) Sprint prologue (m·s-1) 0.79 *
II ♂ V̇O2obla (ml·min-1·kg-1) Sprint prologue (m·s-1) 0.60
IV ♀ OBLA4mmol (W·kg-1) FISsprint (points) -0.52
IV ♀ GE (%) FISsprint (points) -0.46
Relationships are presented as Pearson’s product-moment correlation coefficients (r) and alpha levels of significance are: * for P < 0.05; ** for P < 0.01; and *** for P < 0.001.Rise1mmol, relative work intensity where blood lactate had increased 1 mmol∙l-1 above the lowest measured concentration during treadmill roller skiing; RER1.0, relative work
intensity where the respiratory-exchange ratio (V̇CO2/ V̇O2) reached 1.0 during treadmill roller skiing; OBLA4mmol,
relative work intensity at blood-lactate concentration of 4 mmol∙l-1 during treadmill roller skiing; GE, gross efficiency;
V̇O2obla, where the oxygen uptake related to a blood-lactate concentration of 4 mmol∙l-1 determined during treadmill
roller skiing using the diagonal-stride technique; FISdist, International Ski Federation’s ski-ranking points for distance races; FISsprint, International Ski Federation’s ski-ranking points for sprint races; SNC15c, skiing time for 15 km in classical technique with interval start in Swedish National Championships; SNC30, skiing time for 30 km double pursuit with mass start in Swedish National Championships; Sprint prologue, race speed for the sprint prologue in classical technique; ♂, men; and ♀, women.
Maximal and peak oxygen-uptake tests
The relationships between peak oxygen-uptake variables using different techniques and competitive distance and sprint performances are presented in Table 4.
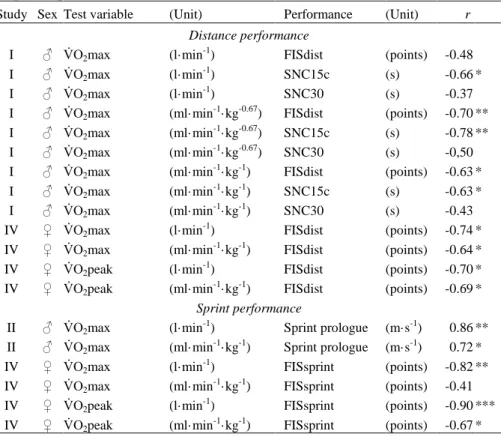
Table 4. Correlations between oxygen-uptake variables using different techniques and
competitive performance
Study Sex Test variable (Unit) Performance (Unit) r
Distance performance
I ♂ V̇O2max (l·min-1) FISdist (points) -0.48
I ♂ V̇O2max (l·min -1
) SNC15c (s) -0.66 * I ♂ V̇O2max (l·min-1) SNC30 (s) -0.37
I ♂ V̇O2max (ml·min -1
·kg-0.67) FISdist (points) -0.70 ** I ♂ V̇O2max (ml·min-1·kg-0.67) SNC15c (s) -0.78 **
I ♂ V̇O2max (ml·min -1
·kg-0.67) SNC30 (s) -0,50 I ♂ V̇O2max (ml·min-1·kg-1) FISdist (points) -0.63 *
I ♂ V̇O2max (ml·min-1·kg-1) SNC15c (s) -0.63 *
I ♂ V̇O2max (ml·min-1·kg-1) SNC30 (s) -0.43
IV ♀ V̇O2max (l·min -1
) FISdist (points) -0.74 * IV ♀ V̇O2max (ml·min-1·kg-1) FISdist (points) -0.64 *
IV ♀ V̇O2peak (l·min -1
) FISdist (points) -0.70 * IV ♀ V̇O2peak (ml·min-1·kg-1) FISdist (points) -0.69 *
Sprint performance
II ♂ V̇O2max (l·min-1) Sprint prologue (m·s-1) 0.86 **
II ♂ V̇O2max (ml·min -1
·kg-1) Sprint prologue (m·s-1) 0.72 * IV ♀ V̇O2max (l·min-1) FISsprint (points) -0.82 **
IV ♀ V̇O2max (ml·min -1
·kg-1) FISsprint (points) -0.41 IV ♀ V̇O2peak (l·min-1) FISsprint (points) -0.90 ***
IV ♀ V̇O2peak (ml·min-1·kg-1) FISsprint (points) -0.67 *
Relationships are presented as Pearson’s product-moment correlation coefficients (r) and alpha levels of significance are: * for P < 0.05; ** for P < 0.01; and *** for P < 0.001. V̇O2max,maximal oxygen uptake during treadmill roller
skiing using the diagonal-stride technique; V̇O2peak, peak oxygen uptake during treadmill roller skiing using the
double-poling technique; FISdist, International Ski Federation’s ski-ranking points for distance races; FISsprint, International Ski Federation’s ski-ranking points for sprint races; SNC15c, skiing time for 15 km in classical technique with interval start in Swedish National Championships; SNC30, skiing time for 30 km double pursuit with mass start in Swedish National Championships; Sprint prologue, race speed for the sprint prologue in classical technique; ♂, men; and ♀, women.
In Study I, test variable the TTEX was correlated with the competitive-performance variables FISdist, SNC15c, and SNC30 (r = -0.79, P < 0.01; r = -0.86,
RESULTS
Mean oxygen-uptake tests
The relationships between mean oxygen-uptake variables using double-poling technique and competitive distance and sprint performances are presented in Table 5.
Table 5. Correlations between mean oxygen-uptake variables using double-poling technique
and competitive performance
Study Sex Test variable (Unit) Performance (Unit) r
Distance performance
I ♂ DP60V̇O2mean (l·min-1) FISdist (points) -0.69 *
I ♂ DP60V̇O2mean (l·min -1
) SNC15c (s) -0.66 * I ♂ DP60V̇O2mean (l·min-1) SNC30 (s) -0.75 *
I ♂ DP60V̇O2mean (ml·min -1
·kg-1) FISdist (points) -0.80 ** I ♂ DP60V̇O2mean (ml·min-1·kg-1) SNC15c (s) -0.68 *
I ♂ DP60V̇O2mean (ml·min -1
·kg-1) SNC30 (s) -0.81 ** I ♂ DP360V̇O2mean (l·min-1) FISdist (points) -0.33
I ♂ DP360V̇O2mean (l·min -1
) SNC15c (s) -0.44 I ♂ DP360V̇O2mean (l·min-1) SNC30 (s) -0.43
I ♂ DP360V̇O2mean (ml·min -1
·kg-1) FISdist (points) -0.48 I ♂ DP360V̇O2mean (ml·min-1·kg-1) SNC15c (s) -0.47
I ♂ DP360V̇O2mean (ml·min -1 ·kg-1) SNC30 (s) -0.53 Sprint performance II ♂ V̇O2dp (l·min -1 ) Sprint prologue (m·s-1) 0.94 *** II ♂ V̇O2dp (ml·min-1·kg-1) Sprint prologue (m·s-1) 0.64
Relationships are presented as Pearson’s product-moment correlation coefficients (r) and alpha levels of significance are: * for P < 0.05; ** for P < 0.01; and *** for P < 0.001. DP60V̇O2mean, mean oxygen uptake during the 60-s double
poling ski-ergometer test; DP360V̇O2mean, mean oxygen uptake during the 360-s double poling ski ergometer test;
V̇O2dp, mean oxygen uptake during double poling on a ergometer; FISdist, International Ski Federation’s
ski-ranking points for distance races; FISsprint, International Ski Federation’s ski-ski-ranking points for sprint races; SNC15c, skiing time for 15 km in classical technique with interval start in Swedish National Championships; SNC30, skiing time for 30 km double pursuit with mass start in Swedish National Championships; Sprint prologue, race speed for the sprint prologue in classical technique; and ♂, men.
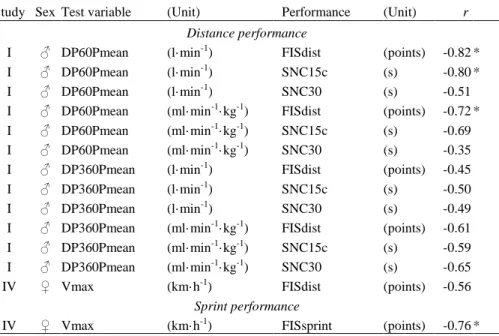
Double-poling tests
The relationships between double-poling variables and competitive distance and sprint performances are presented in Table 6.
Table 6. Correlations between double-poling variables and competitive performance
Study Sex Test variable (Unit) Performance (Unit) r
Distance performance
I ♂ DP60Pmean (l·min-1) FISdist (points) -0.82 * I ♂ DP60Pmean (l·min-1) SNC15c (s) -0.80 * I ♂ DP60Pmean (l·min-1) SNC30 (s) -0.51 I ♂ DP60Pmean (ml·min-1·kg-1) FISdist (points) -0.72 * I ♂ DP60Pmean (ml·min-1·kg-1) SNC15c (s) -0.69
I ♂ DP60Pmean (ml·min-1·kg-1) SNC30 (s) -0.35 I ♂ DP360Pmean (l·min-1) FISdist (points) -0.45 I ♂ DP360Pmean (l·min-1) SNC15c (s) -0.50 I ♂ DP360Pmean (l·min-1) SNC30 (s) -0.49 I ♂ DP360Pmean (ml·min-1·kg-1) FISdist (points) -0.61 I ♂ DP360Pmean (ml·min-1·kg-1) SNC15c (s) -0.59
I ♂ DP360Pmean (ml·min-1·kg-1) SNC30 (s) -0.65 IV ♀ Vmax (km·h-1) FISdist (points) -0.56
Sprint performance
IV ♀ Vmax (km·h-1) FISsprint (points) -0.76 *
Relationships are presented as Pearson’s product-moment correlation coefficients (r) and alpha levels of significance are: * for P < 0.05; ** for P < 0.01; and *** for P < 0.001. DP60Pmean, mean power during the 60-s double poling ski-ergometer test; DP360Pmean, mean power during the 360-s double poling ski-ski-ergometer test; Vmax, maximal double-poling speed determined while treadmill roller skiing; FISdist, International Ski Federation’s ski-ranking points for distance races; FISsprint, International Ski Federation’s ski-ranking points for sprint races; SNC15c, skiing time for 15 km in classical technique with interval start in Swedish National Championships; SNC30, skiing time for 30 km double pursuit with mass start in Swedish National Championships; ♂, men; and ♀, women.
There were no significant correlations (P > 0.05) between DP20Fpeak and the distance competitive performance variables in Study I.
RESULTS
Body-composition test
The relationships between body-composition variables and competitive distance and sprint performances are presented in Table 7.
Table 7. Correlations between body-composition variables and competitive performance
Study Sex Test variable (Unit) Performance (Unit) r
Distance performance III ♂ LMWB (kg) SNC15f (s) -0.08 III ♀ LMWB (kg) SNC10 (s) -0.85 ** III ♂ LMUB (kg) SNC15f (s) -0.08 III ♀ LMUB (kg) SNC10 (s) -0.86 *** III ♂ LMLB (kg) SNC15f (s) -0.12 III ♀ LMLB (kg) SNC10 (s) -0.81 ** Sprint performance
III ♂ LMWB (kg) Sprint prologue (s) -0.69 * III ♀ LMWB (kg) Sprint prologue (s) -0.82 *** III ♂ LMUB (kg) Sprint prologue (s) -0.66 * III ♀ LMUB (kg) Sprint prologue (s) -0.81 *** III ♂ LMLB (kg) Sprint prologue (s) -0.69 * III ♀ LMLB (kg) Sprint prologue (s) -0.78 **
Relationships are presented as Pearson’s product-moment correlation coefficients (r) and alpha levels of significance are: * for P < 0.05; ** for P < 0.01; and *** for P < 0.001. LM, lean mass; WB, whole body; UB, upper body (arms and trunk); LB, lower body (legs); SNC15f, skiing time for 15 km in free style with interval start in Swedish National Championships; SNC10, skiing time for 10 km in free style with interval start in Swedish National Championships; Sprint prologue, race speed for the sprint prologue in classical technique; ♂, men; and ♀, women.
Knee-extension and vertical-jumps tests
In Study I, there were no significant correlations (P > 0.05) between the competitive distance performance variables and test variables derived from the knee extension peak torque (PT60, PT180, PT300) and the vertical jumps test (SQJ, CMJ, CMJA).
Competetive performance
The relationships between FIS points and performance in skiing competitions are presented in Table 8.
Table 8. Correlations between FIS points and performance in skiing competitions
Study Sex FIS points (Unit) Competition (Unit) r
Distance performance
I ♂ FISdist (points) SNC15c (s) -0.95 *** I ♂ FISdist (points) SNC30 (s) -0.91 *** III ♂ FISdist (points) SNC15f (s) -0.85 *** III ♀ FISdist (points) SNC10 (s) -0.71 *
Sprint performance
II ♂ FISsprint (points) Sprint prologue (s) -0.78 * III ♂ FISsprint (points) Sprint prologue (s) -0.79 ** III ♀ FISsprint (points) Sprint prologue (s) -0.84 **
Relationships are presented as Pearson’s product-moment correlation coefficients (r) and alpha levels of significance are: * for P < 0.05; ** for P < 0.01; and *** for P < 0.001. FISdist, International Ski Federation’s ski-ranking points for distance races; FISsprint, International Ski Federation’s ski-ranking points for sprint races; SNC15c, skiing time for 15 km in classical technique with interval start in Swedish National Championships; SNC15f, skiing time for 15 km in free style with interval start in Swedish National Championships; SNC10, skiing time for 10 km in classical technique with interval start in Swedish National Championships; SNC30, skiing time for 30 km double pursuit with mass start in Swedish National Championships; Sprint prologue, race speed for the sprint prologue in classical technique; ♂, men; and ♀, women.
Multiple regression models
In Study I, the multiple linear regression models, that met the stated criteria for a valid model, which were derived for competitive performance variables are presented in Table 9.
Table 9. Multiple linear regression models for competitive performance variables
Study Sex Model R2
I ♂ FISdist = 643.9 - 79.2·RER1.0- 6.6·DP60V̇O2mean/kg 0.814
I ♂ FISdist = 903.2 - 7.5·V̇O2max/kg - 87.3·DP60V̇O2mean 0.764
I ♂ FISdist = 932.8 - 2.06·V̇O2max/kg2/3 - 71.7·DP60V̇O2mean 0.716
I ♂ FISdist = 922.6 - 90.9·OBLA4mmol - 6.6·V̇O2max/kg 0.643
I ♂ SNC15c = 6022.5 - 7.94·V̇O2max/kg
2/3 - 201.9·DP60V̇O
2mean 0.780
I ♂ SNC15c = 5617.2 - 24.6·V̇O2max/kg - 269.6·DP60V̇O2mean 0.735
I ♂ SNC15c = 5697.3 - 291.4·OBLA4mmol - 21.6·V̇O2max/kg 0.641
FISdist, International Ski Federation’s ski-ranking points for distance races; SNC15c, skiing time for 15 km at classical technique with interval start at Swedish National Championships (s). Test parameters in order of appearance; RER1.0, work intensity where respiratory exchange ratio (V̇CO2/V̇O2) reached 1.0 during treadmill roller skiing (W·kg-1);
DP60V̇O2mean/kg, mean relative oxygen uptake during the 60 s double poling ski-ergometer test (mL·min-1·kg-1);
DISCUSSION
Discussion
Principal findings
The results in this thesis provide new insight into the physiological demands, reflected by relevant tests, in competitive elite cross-country skiing. The included studies in this thesis showed that the ability to maintain a high work rate without accumulating lactate is an indicator for distance performance, independent of sex (I, IV). Independent of sex, oxygen uptake in whole-body and upper-body exercise was important for both sprint (II, IV) and distance (I, IV) performance. The maximal double-poling speed and 60-s double-poling mean power output were indicators of sprint (IV) and distance performance (I), respectively. Lean mass was correlated with distance performance for women (III), whereas correlations were found between lean mass and sprint performance among both male and female skiers (III). Moreover, no correlations were found between distance performance and test variables derived from tests of knee-extension peak torque, vertical jumps, and double poling on a ski-ergometer with 20-s and 360-s durations (I), whereas gross efficiency during treadmill roller skiing was not correlated with either distance or sprint performance in cross-country skiing (IV).
Lactate threshold
For each performed sub-maximal stage during lactate-threshold tests, the skier reach a steady state, where the amount of ATP required corresponded to the work rate performed and where the rate of appearance equalled the disappearance of lactate in the blood [30]. The blood-lactate concentration is a reflection of the acidity in the exercising muscles due to the anaerobic catabolism of carbohydrates [34]. To decrease the acidity in the muscles, thereby enabling continued ATP synthesis, the produced lactate is diffused by means of lactate transporters from a higher acidity (lower pH) in the exercising muscles to a lower acidity (higher pH) in the blood. By facilitated diffusion, the lactate in the blood is transported into other tissues, e.g. the liver, where it is transformed to glucose via gluconeogenesis, and to non-exercising muscles, where it is oxidized to pyruvate, which is subsequently used as a substrate, thereby reducing the concentration of lactate in the blood. When the relationship between blood-lactate concentrations and work intensity are plotted, there is generally an exponential rise in the blood lactate concentration with an increase in work intensity [63]. Generally, there are several different types of lactate variables used, which can be divided into three categories: the first rise of the blood-lactate concentration above baseline (e.g. Rise1mmol), a fixed concentration (e.g. OBLA4mmol), and the breakpoint of the curvature [63]. If oxygen uptake is measured during the lactate-threshold test, the oxygen uptake, based on the linear relationship between oxygen uptake and work intensity, could be related to the intensity at different blood-lactate concentrations (e.g. V̇O2obla).
The capability to maintain a high work intensity without accumulating lactate, as reflected by the variables derived from the lactate-threshold test, is an indicator of distance performance, independent of sex (I, IV); hence, this capability entails that a skier with a higher work intensity for a specific lactate-threshold variable will, compared to a skier with a lower work intensity, be able to have a higher mean skiing speed for the investigated performance. These results are consistent with reported data from previous studies, where Rise1mmol was related to a 10-km roller skiing time trial for men [46] and V̇O2obla was related to both a 5.6-km time trial
[64] and rankings based on four competitions [65] for male junior skiers. However, no correlation was found between V̇O2obla and ranking for female junior skiers
[65]. The work intensity at V̇O2obla was an indicator of male sprint prologue
performance (II), whereas OBLA4mmol was not correlated with female sprint performance (IV). Previously, roller-skiing velocities corresponding to blood-lactate concentrations of 3, 5, and 7 mmol·l-1 were related to the mean velocity of a four-heat simulated roller-skiing sprint [18]. The somewhat limited research on the relationship between lactate-threshold test variables and competitive skiing performance, especially for women and sprints, warrants further investigations.
Previously, it was reported that 25 different lactate-threshold concepts have been used to assess endurance capacity [63]. For running distances shorter than 16 km, OBLA4mmol appeared to be the best predictor of performance, whereas for longer distances, aerobic thresholds (e.g. Rise1mmol) are better performance indicators [63,66]. For cross-country skiing, the correlation coefficient for the relationship between a simulated sprint performance and velocity at 7 mmol·l-1 was higher than for velocities at 3 and 5 mmol·l-1 [18]. Moreover, in Study I, the result showed that the performance in the 30-km race was correlated with Rise1mmol but not with OBLA4mmol. This is consistent with previous recommendations that the variable chosen to predict performance capability should reflect the work intensity during the competitive performance [63,66].
Skeletal muscles undergo several chronic adaptations with endurance training, e.g. increased capillary numbers, mitochondrial density, oxidative enzyme activity, and type I fibre area; there is also evidence that with endurance training, type II fibres change to have a higher mitochondrial content and thus a higher oxidative capacity [67], resulting in an increased fat oxidation in exercising muscles, which in turn leads to a lower blood-lactate concentration for a given work intensity [68].
It has been proposed that exercising for one hour or more at approximately the lactate threshold produces the greatest adaptation for endurance-trained individuals [35,69]. However, it is important that the training is regular and specific because the adaptations are highly specific to the type, frequency, and duration of the performed training, e.g. the adaptations of increased mitochondrial density and oxidative