STATENS VAG- OCH TRAFIKINSTITUT
National Swedish Road and Traffic Research InstituteTHE RATING AND MEASURING OF ROAD ROUGHNESS
by
Georg Magnusson and Peter W Arnberg
REPORT NO. 83 A Linképing 1 976
STATENS VAG- OCH TRAFIKINSTITUT
National Swedish Road and Traffic Research InstituteTHE RATING AND MEASURING OF ROAD ROUGHNESS
by
Georg Magnusson and Peter W Arnberg
REPORT NO. 83 A Linképing 1976
6.1 6.1.1 6.1.2 6.2 7.1 7.1.1 7.1.2 7.1.3 7.1.4 7.1.5 7.1.6 7.1.7 7.1.8 7.1.9 CONTENTS . FOREWORD SUMMARY BACKGROUND
THE USES OF ROAD-SURFACE PROFILE MEASUREMENTS PURPOSE OF THE PRESENT STUDY
ROAD METERS
The GM profilometer The CHLOE profilometer The PCA Road Meter
The Chock-meter system T¢I
DETERMINATION OF THE COMFORT VALUE ACCORDING TO ISO STANDARD 2631
COMMENTS ON THE RATING METHOD AND THE SELECTIONS OF ROAD SECTIONS
Rating Method Background
Advantages and Disadvantages
Selection of Road Sections PRE EXPERIMENT
Description of Pre experiment
Purpose I
Locale and time of year
Vehicle type and rating position Subjects Speed Rating scale Road sections Rating task 1 Rating task 2 7.1.10 Procedure 11 11 13 17 17 17 17 18 20 20 20 20 20 21 21 21 21 21 22 22
\ l \ l \ l \ l \l O O O O C D O O O O O O O O O O O O O O C D K O K O K D K D K D K D O O O U T a n N H N N N N N F wa l l O O ( s h b o wl -4 N R> ro w h4 +4 H FJ F H U JN l -J Results
Consistency among the subjects over the ratings Significance of vehicle type and rating position Sources of the total experience of discomfort Acceptable discomfort levels for different road
categories
Acceptable discomfort levels while driving 70 and 90 km/hr
Acceptable discomfort levels for a distance requiring one hour's travel
Comparison of the subjective data with the data
from the road meters
Conclusions
MAIN EXPERIMENT
The Organization of the Main Experiment Vehicle type and rating position
Subjects
Rating task 1 Rating task 2 Procedure Results
Consistency among the subjects over the ratings Experience of discomfort
Acceptable discomfort levels for different road categories
Acceptable discomfort levels while driving 70 and 90 km/hr
Acceptable discomfort levels for distances requiring different time durations
Correlation of the results with ISO Standard 2631
Comparison of subjective data with data from the road meters
DISCUSSION
The rating of discomfort
Agreement with ISO Standard 2631 Representativeness of Road Sections Comparison of Measuring Instruments Implications for further research
REFERENCES 23 23 23 26 26 27 27 27 28 29 29 29 3O 3O 3O 3O 31 31 31 32 33 34 35 35 38 38 39 4O 42 43 44
FOREWORD
This report has been sponsored by the National Swedish Road Administration. Georg Magnusson, project leader, has been responsible for the technical aspects of the study and Peter W. Arnberg has been responsible for the parts corre-sponding to the subjective measurement of road roughness.
SUMMARY.
A study has been carried out aiming, in part, to elucidate the significance of road roughness for road users' experience of
comfort and, in part, to find an objective method for measuring
road roughness, giving data which are directly comparable with the road-users' experience of comfort.
The study was divided into a preliminary experiment and a main experiment. Thirty subjects in the preliminary experiment and forty in the main experiment rated their experience of comfort on twenty road sections representing varying degrees of smooth-ness to roughsmooth-ness conditions. The ratings were carried out in
passenger cars, trucks and in a bus. Two kinds of ratings were
made: an estimation of the general experience of discomfort when the road sections were compared with one another and a general estimation of what was considered to be an acceptable
level of discomfort in different specified situations (e.g.,
on different types of roads,& rtk3traveling at different speeds, and while traveling for different lengths of time).
The results of the ratings were partly used to evaluate the apprOpriateness of the ISO comfort standard in connection with road use and partly to evaluate four different kinds of road
meters.
The results showed that the road-users accepted longer exposure
time for road roughness on roads of relative smoothness than what would be eXpected from the ISO reduced comfort boundary.
As for rougher roads, the estimated acceptance time approached the ISO boundary.
Three of the four road meters which were used produced results well in accordance with the results from the subjective ratings. Due to measuring and evaluating techniques, however, only one of these can be recommended for more extensive measurements involving road building and road maintenance. The recommended road meter is the so-called PCA Road Meter but there is reason to consider -whether a Road Roughness Indicator or a Bump Inte-grator equipped with the measuring system of the PCA Road Meter would not be a still better alternative than the present PCA
Road Meter. This construction, however, has not been studied
BACKGROUND
Due to the more advanced means of transportation resulting from the development of modern technology, man has become subjected to vibrations of a much different nature than was previously the case with more basic forms of locomotion such as walking or horse riding. As a result, new stresses have been placed on the body, affecting the safety, ability, and comfort of the users in a variety of ways.
Problems involving vibration effects on the man-vehicle system have been studied for more than a decade in laboratory experi ments as well as in field studies. In spite of the great number
of references, over 4 000, the literature has been mainly
sporadic and non integrated until recently. In the last few years a number of literature surveys have been available such as "Vibration Effects on Man" (Hornick, 1969), "Ten Years of
Human Vibration Research" (Beaupert et al, 1969), Human Response
to Vibration - a Critical Survey of Published Work" (Guignard and Guignard, 1970), "Human Reaction to Vibration" (Allen, 1971),
"Vibration and Human Performance" (Grether, 1971), "Decrements in Tracking and Visual Performance During Vibration" (Collins, 1973), and "Human Response to Whole-Body Vibration" An Evaluation of Current Trends" (McCullough and Clarke, 1974). The intensive work towards organizing the literature has resulted in an attempt to establish international tolerance criteria for vibration
levels.Zhil974, the International Organization for Standardiza-tion (ISO) published a "Guide for the EvaluaStandardiza-tion of Human
Expo-sure to Whole-Body Vibration", and an international standard,
ISO 2631 (1974), was formulated. This standard was mainly
constructed from studies carried out in simulators and on vibrat ing platforms where subjects rated how long they could tolerate different vertical and horizontal sinusoidal vibrations. The standard was based on the best internationally available data and served to recognize and evaluate three areas affecting the human response to vibration: health/ safety, work proficiency,
and comfort. As the ISO Committee states, however, the complex
far from understood. The purpose of the ISO Standard can be
said to be twofold: first, "to facilitate the evaluation and
comparison of data gained from continuing research in this field", and second, "to give provisional guidance as to acceptable rates of human exposure to whole-body vibration". With all respect to the efforts of the committee, reactions from various investigators should be considered. Guignard and Guignard (1970) proposed that the ISO Standard should be treated as a tentative guide only, as they felt that the amount of available literature to support the standard was limited. Allen (1971) stated that the ISO vertical vibration limits for short time exposure (16 minutes or less) were too high and that in many situations such levels could cause serious impairment (n3 activity and considerable discomfort. This was especially applicable to visual accuracy at frequencies greater than 10 Hz and tracking performance at frequencies
lower than 8 Hz. Stickeleather, Halt and Radke (1972) suggested that "subjective criteria developed under these conditions
(of establishing the ISO Standard) will, in general, require that their interpretations and applications include some allowance for the many important physical and psychological parameters of the real world", meaning that the important
question as to how much and what type of allowances are neces-sary and realistic remain, to a great extent, unanswered.
McCullough (1974), after a literature Survey, stated that "the available data on human sensivity to vibration provide no satis-factory basis for choosing any one of the recommended comfort limits in preference to any other". He argues that inconsistency has been inevitable in an area where wide ranging and usually inadequate methods have been used and wherethe investigators, as a rule, have been unaware of the many "pitfalls in psycho ; logical research". Finally, Janeway (1975) strongly opposes the adOption of the ISO Standard on the grounds that "the proposed standard does not represent the best available data".
However critical the Opinions, the ISO Standard, from most
researchers' viewpoint, is considered to be a step forward in that it reflects a collective agreement. In practice, however, thereare limitations to the application of the
standard. The "fatigue-decreased proficiency boundary", which
refers to the effect vibration has on human work performance: seems especially difficult to apply beCause of the many
different types of work proficiency existing outside of the laboratory. It is also necessary to examine the effects of vibration exposure in specific situations, such as in car and truck driving.
THE USE OF ROAD-SURFACE PROFILE MEASUREMENTS
There are a number of possible fundamental uses for road-surface profile measurements. The measurements could be used as a quality control tool in road construction, determining standards which contractors should be required to meet. In
turn, roads could be assessed in terms of deviation from
these standards and tolerable deviation acceptance standards established. A control of this type would also reflect the
surface degradation over a given period of time. Another reason for measurement is to locate where something abnormal has
happened to a road, e.g., how weather changes have affected a road's surface. This type of data could be valuable to road constructors and engineers who could use the information to study how changes in design could influence the condition of the pavement during its life.
The series of studies of which the present report is a part is also concerned with establishing a correlation between the measured roughness of a road surface and the penalties imposed on the driver-vehicle system as a result of using the rough road.
The following seven "performance penalties" could occur: 1) Decreased traffic safety conditions resulting from the
effect road roughness has on a driver's ability to handle his vehicle; visual accuracy and steering have been shown to be particularly sensitive to vibration
2) Fatigue, experienced either during the period of actual roughness or afterwards
3) Decreased or altered road usage from that which was origi nally intended
- 4) Decreased comfort of both driver and passenger 5) Damage to transported goods
6) Reduced tire traction in acceleration and braking as well as reduced dynamic stability of the vehicle
7) Increased wear and reduced service life of the vehicle or
parts of the vehicle
Finally, the measurements of road surface could be used to study the interaction between vehicle and road surface. In this way the vehicle's role in causing roughness and how this process is accelerated on an already rough road could be determined. A knowledge about road-surface profiles would make it possible to maintain pavements and to build newroads in a more efficient way. What seems necessary is an index system whichwould enable the highway engineer to rank road profile descriptions according to the potential effects road roughness will have on the driver-vehicle system, as well as on the road itself. The construction of such an index should be based on all of the above mentioned factors. An initial step towards such an index could be to examine the relationship between comfort and road roughness. A substantial amount of work in this area has already been carried out at the National Swedish Road and Traffic Research Institute. Different types of road meters have been constructed and a road simulator as well as a mathematical model have been developed. The model can transform data from one of the road meters to data which can be evaluated in terms of the ISO
PURPOSE OF THE PRESENT STUDY
The present study is a field study and its main purpose is to solve some of the practical problems involved in road measure-ment, both by road meters and by subjective rating, especially with regard to how the comfort of both driver and passenger
is affected by road roughness. Although accurate roughness
analysis of roads can be obtained from the data of road meters, this information alone is not sufficient in determining how
the driver or passenger of a vehicle experience such roughness.
Results from the subjective rating are influenced by such factors
as speed, type of vehicle used in the rating and whether the rating is made while the subject is driver or passenger. Other related factors involve how the rating is done and whether or not the subject is actually rating comfort or making a complex evaluation of sensory input from visual information, the
experience of vertical movement, etc. It is therefore obvious that the role of these factors must also be considered before a general comfort standard can be established.
Another problem in analyzing the road is the evaluation of roughness distribution. Thus, a road with well-distributed roughness of a less severe nature might be more acceptable than a road where rather significant roughness is located in a few concentrated areas.
The purpose of the present study, thus, is threefold:
1) Evaluation of the road meters
The comparison of as many different road meters as possible will be carried out with special regard to the examination of whether or not the data from the meters correlate with the subjective rating of comfort.
2) Evaluation of how subjects rate comfort
An evaluation will be made of the various factors
influ-encing the subjects' experience and rating of comfort.
3) Evaluation of the ISO Standard
The ISO "reduced comfort boundary" will be compared with the subjects' rating of comfort.
ROAD METERS
The GM-profilometer
The GM-profilometer, developed by the General Motors Corporation, is a modern system for evaluating pavement surface profiles at various traffic speeds. The equipment is instrumented to measure road roughness by a spring loaded road-following wheel mounted underneath the chassis of a vehicle. The vertical movements of the wheel are measured by a potentiometer giving an output repre-senting the road profile as seen from the vehicle (see Figure l and 2).
reference system it is necessary to have knowledge about the In order to transform this profile to a ground fixed vertical movements of the vehicle chassis. This is attained by measuring the vertical acceleration of the chassis and then by integrating this signal twice. A signal representing the actual road profile is produced by adding the outputs from the
potentio-This signal is recorded on an thus
meter and from the accelerometer.
analogue tape recorder and processed in a laboratory,
giving a comfort value characterizing the road.
The comfort value calculated fromthe road profile in this International Standard ISO 2631 (1974), "Guide for the evaluation of human exposure to whole-body vibra-study is based on the
tion". The method used for the calculation of the comfort value involves the use of a mathematical model of a vehicle with a
driver in the front seat. This model is programmed for simula-tion in an analogue computer.
The CHLOE-profilometer
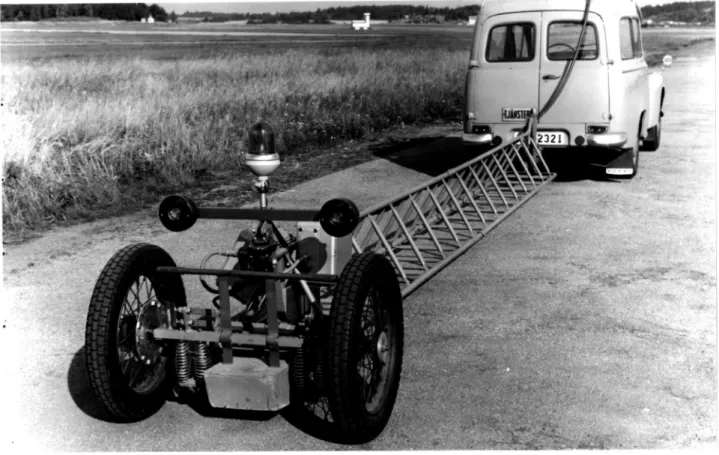
The CHLOE-profilometer is a trailer in tow of a car. The trailer consists of a chassis 7 meters in length with two wheels side by side at its rear (Figure 3). Immediately in front of these wheels is the road-following device, consisting of two small wheels mounted in tandem (see Figure 4). These two wheels follow the road profile and the quantity observed is based upon the slope of the road profile, or, in reality, the angle between the chassis of the profilometer and the short beam connecting the
centres of the small wheels.
Internationally, the road roughness as measured by the CHLOE-profilometer is reported by the PSI-value composed of the variance of the slope of the road profile and certain other observed characteristics of the road surface, such as cracking, patching and rut depth. In Sweden, the variance is replaced by the standard deviation of the slope of the road profile and the other road surface characteristics mentioned above are neglected. This measure of road roughness is referred to as the TRAC-value.
10.
Fig 3. The CHLOE profilometer
P". <:x \ -i 4" ."fv
' v . J 4;. ,.
A thy: 'w' _ .
;
11.
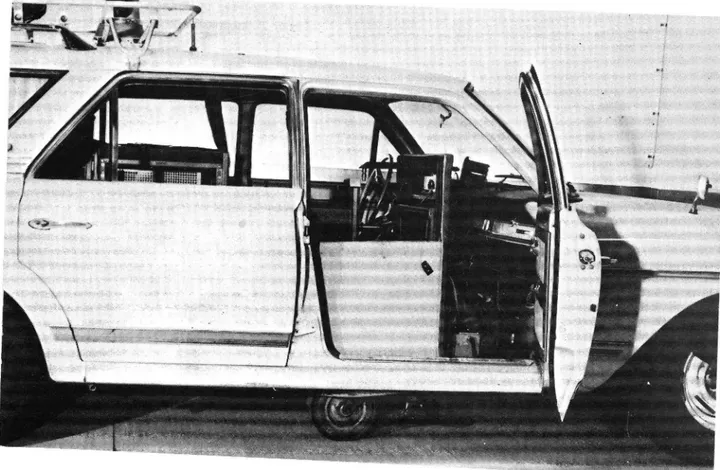
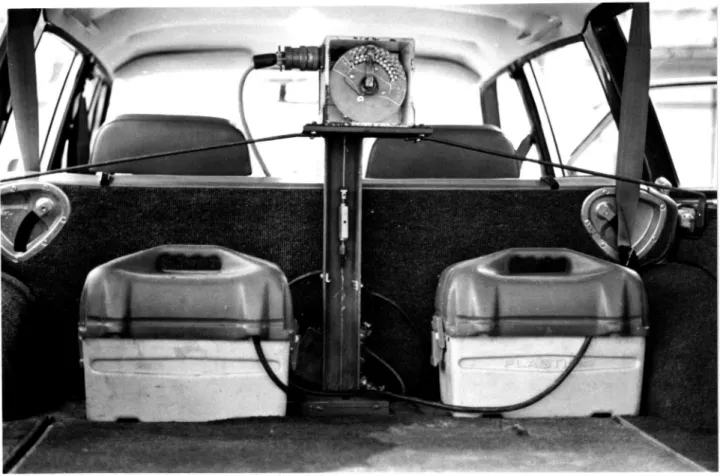
The PCA Road Meter
The PCA Road Meter is a simple electromechanical device
installed in a standard passenger car. It measures the number and the magnitude of vertical deviations from the body of the vehicle to the centre of the rear axle housing. The instrument consiStsc fa nylon-covered flexible steel cable connected to the top centre of the rear-axle housing in the car. The cable is brought vertically through the floor of the vehicle to a package deck inside the vehicle (see Figure 5). This package deck consists of a circular disk with 25 conductive segments and a moving contact guided by the flexible steel cable
(Figure 6). The conductive segments are connected to six and the vertical deviations between the chassis and
The of those counters are then processed in a laboratory
counters
the rear axle housing is thus classified in six classes. readings
in order in Sweden called the
TRAP-value.
to get a road roughness value,
It is important that the carrier vehicle is in good condition and that it has a normal suspension system and good tires. The PCA Road Meter has to be calibrated regulary against a CHLOE
meter, because of the change in condition of the carrier vehicle.
In this experiment a Volvo 145 was used as the carrier vehicle.
The Chock meter system T¢I
The Chock-meter consits of a standard passenger car with an accelerometer mounted on the rear axle housing which
measure the vertical acceleration of the axle. The maximum acceleration measured on every 7,56 m road section is recorded on a paper tape. The measure of road roughness for the total road section produced by this device is the mean and standard
deviation of the recorded maxima of acceleration. The utilized
information in computing the road roughness value is thus only a fraction of the informationmdriginallyavailable.
12.
Fig 5. The PCA meter. In the middle of the picture you can see the box containing the disk with the conductive
segments and the wire leading down to the rear axle
l3.
DETERMINATION OF THE COMFORT VALUE ACCORDING TO THE ISO STANDARD 2631
The International Standard ISO 2631 (1974) states:
"This International Standard defines and gives numerical values
for limits of exposure for Vibration transmitted from solid
surfaces to the human body in the frequency range 1 to 80 H2 It may be applied, within the specified frequency range, to periodic vibrations and to random or non-periodic vibrations with a distributed frequency spectrum. Provisionally, it may also be applied to continuous shock-type excitation in so far as the energy in question is contained within the l to 80 Hz"-band.
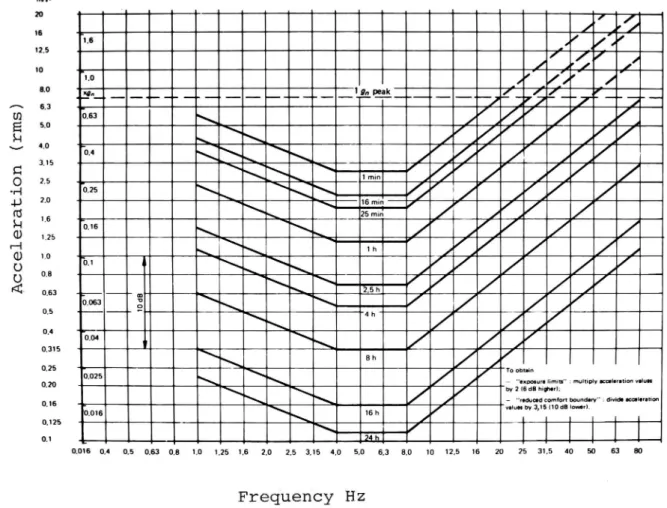
The limits are given for use according to the three generally recognizable criteria of preserving comfort, working efficiency, and safety or health, named respectively, in this International Standard, the "reduced comfort boundary", "fatigue-decreased proficiency boundary" and the "exposure limit" (seeAFigure 7)."
In the case of road-induced vibrations in the vehicle, we have
to deal with random vibrations, thus, according to the ISO
Standard, the overall vibration signal is to be weighted
with an electronic network. This weighting network shall have an insertion loss with a frequency response according to the curves in Figure 7. The network characteristics shall not deviate more than i 1 db between the two fixed frequencies
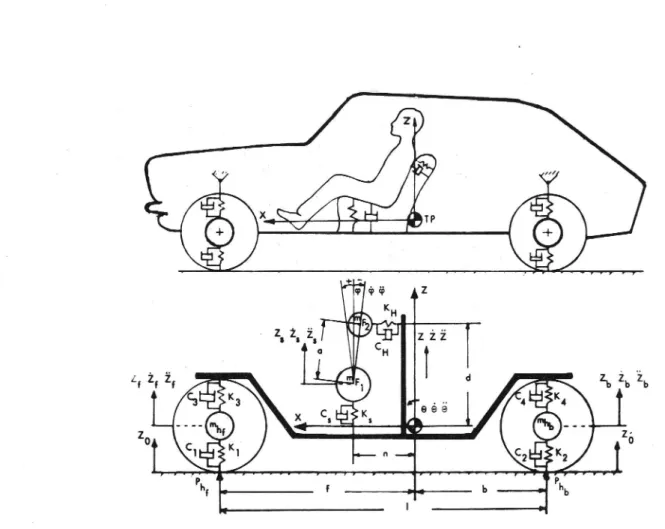
6.3 Hz and 31.5 Hz and more than i 2 db over the other frequency ranges. The network used in this study is shown in Figure 8. The road profile measured by the GM-profilometer and recorded on magnetic tape is used as the input to a mathematical model of a vehicle with a driver in the Emmmtseat, programmed for
simulation in an analogue computer. Figure 9 shows a schematic
diagram of the model. The computer calculates the vertical
acceleration of the driver and this acceleration is then weighte« with the electronic network defined above. To get a single value characterizing the whole road section the signal is then
pro-cessed in a second electronic network giving the RMS-value of the signal.
A c c e l e r a t i o n ( r m s ) 8.0 6,3 5,0 4,0 0.8 0,63 0,5 0,4 0,315 0.25 0,20 0.16 0.125 0,1 14. obtain "oxpoturn limits" :
by 2 (6 d8 him"): multiply seal-ration vuluu "roducod comfort boundary" : divide Icalontion values by 3,15 (10 dB low").
0.016 0,4 0,5 0,63 0,8 1,0 1,25 1,6 2,0 2,5 3,15 4,0 5,0 6,3 8,0 10 12,5 16 20 25 31,5 40 50 63 80
Frequency Hz
Fig 7. ISO Standard 2631. Limit characteristics for exposure
dB 0 __ / -6 lfz // ///. ,/»~** lt~\\ //// / _ _ ,/ a z \\ / / / /// \\ ,//
-8 Az
//i; //
\
\\\\
///
\
\\
// \\ \ \\ \\
'\ \ .\ \ \ -12 \\\ \.L -18 24 - ~ ~ 1.0 2.0 _ 4.0 '8;O 12.5 31.5 Hz Frequency16.
Fig 9. Diagram of vehicle model used for the determination of comfort values
17.
COMMENTS ON THE RATING METHOD AND THE SELECTION OF ROAD SECTIONS
Rating Method
Esskgregaé
In the area of experimental psychology, several methods have been developed for the subjective rating of perceptual
experi-Stevens, 1960; 1966 and
1972). All of these different methods share that a number of subjects have the task ence (see, e.g., Bjorkman and Ekman,
Kling and Riggs, a common principle:
of stating, in one way or another, how they experience a
certain stimulus. The choice of how this statement is made is, of course, related to the nature of the stimulus being judged. In the present study, a special rating method described by Bjorkman and Ekman (1966), has been used. In this method, the subjects evaluate variations of a given stimulus and state how they experience these variations on an equal-interval scale. Methods of this type are based on the assumption that subjects have the ability to quantify the size and the intensity of their eXperiences. Normally, the high and low points of the scale are identified for the subject so that he will have some "point of reference" to base his responses on. In this experi-ment, it was impossible to do this because of the limited
knowledge about how road roughness is experienced by subjects. This problem was solved by allowing the subjects to choose the end points of the scale themselves; in other words, they were required to rate at least one of the twenty sections as "one"
and at least one as "nine".
§§y§22§9s§_§2§_9isééyéafégse
There were a number of advantages/disadvantages with the method of rating employed. The subjects rated the twenty road
sections only in relation to one another and were told not to compare the sections with roads which they had experienced outside of the experiment. This was done in order to minimize
18.
the influence of background experience as well as to correlate
the data with that from the road meters. This meant, however, that in order to eliminate the influence of individual back
-ground experience in the ratings, the opportunity for an over all evaluation of the Swedish road network had to be sacrificed.
The latter evaluation was done in another way, however; after
completing the ratings in each vehicle type, the subject was asked to mark on the nine-grade scale acceptable discomfort levels for roads allowing 70 and 90 km/hr as the highest
per-mitted speeds, for roads on which he could travel distances
requiring different time durations, and for different categories
of roads, e.g., inter-European roadways, national trunk roads,
primary and secondary roads. These ratings were done with general background experience in mind and could also be used in comparison with ISO Standard 2631 in which the estimation of roads is given in terms of the amount of time a subject can tolerate driving on them.
Selection of Road Sections
Ten kilometers of a national trunk road in the north of Sweden
were used for the experiment. This special road was chosen
primarily due to the fact that parts of the surface were in very bad condition due to very uneven frost heave. Thus it was
possible to get the full range of smoothness to roughness condi-tions on one road, necessary to avoid transporting the subjects from one area to another. In order for a stretch of road to be considered for a rating section, the following five requirements
were necessary:
1) The sections should be located as close to one another as
possible so that the comparison of sections would not be interrupted by long periods of transportation.
2) The sections should vary according to roughness alone and
not to other variables such as road width or curvature.
3) The total number of sections should be representative of the total range of smoothness-roughness conditions.
l9. 4) The road should have as little traffic as possible% 5) Each individual section should be homogeneOus in its
degree of smoothness or roughness;
On the basis of these qualifications,twenty road seCtions,
each consisting of 200 meters in length, were SeleCtede This number was considered to be large enough to be representative of the full range of smoothness to roughneSs conditions without being so large that it would overburden the subjeCts and make
20.
PRE-EXPERIMENT
Description of Pre-experiment
EEEEQ§§
The purpose of the pre-experiment, carried out in the spring of 1974, was to test the previously discussed rating method in an experimental situation. An additional purpose was to give information about the extent to which the total
experi-ence of discomfort was influexperi-enced by various subfactors, e.g.,
visual or auditory sensations, sensations resulting from horizontal or vertical motion, the eXperience of a decrease in safety conditions, or anxiety over potential damage to the vehicle. Also sought was information about the degree to which vehicle type and driver or passenger position influenced the ratings,and how well the data from the road meters corre-lated with the subjective data.
Locale and time of Y§§£
The National Swedish Road Administration suggested that National Road 90, north of Solleftea,
due to the occurrence of rather rough areas due to very uneven seemed suitable for the experiment frost heave in the spring. The experiment was accordingly held during this period.
Yehisls-Eyps_§2§_£s§;29_99§ifige
The ratings were carried out in three vehicle types: passenger
cars Volvo 142/144, Volkswagen 1302 and truck Scania LS 110
(without cargo), and in two positions: as driver and as passenger.
Five different "conditions" or positions thus resulted:the subject could be either a passenger or a driver in each of the
21.
§9§i§9§§
The subjects consisted of thirty men between the ages of twenty and sixty. All had some background in various areas of road technology, and all were experienced drivers.
Ten of the subjects carried out the ratings under all five conditions, five carried them out only as passengers in the truck, five as only drivers in the-cars, and five as only passengers in the cars. The remaining five subjects carried out the ratings under a variety of rating conditions.
§p§§§
The ratings were done at 901qm n:in the passenger cars and at
701qm nrin the truck. The lower speed for the truck was felt
to be necessary as some of the road sections were in such poor condition that higher speeds might have been hazardous.
B§2i29_§s§l§
A scale consisting of nine grades was used. This gave the subjects an Opportunity to be extremely precise in their ratings,as well as making the standardization of data from the road meters possible. It was also a scale which was easy to handle and easily learned by the subjects, even by those who were unfamiliar with rating tasks.
Road sections
Twenty road sections, each consisting of 200 meters, the total number representing a full range of smoothness to roughness conditions, were used in the experiment. For more
detailed information about how the road sections were selected
see "Selection of road sections", page 18.
B§§;29_:§§E_l
The subjects' first task was to judge, on a nine-grade scale, their experience of discomfort on each of the twenty road sections. In order to assess what source of information/
7.1.10
22.
the subjects were also asked to state, on the same scale,
to what degree the discomfort had arisen from visual sensa-tions, auditory sensasensa-tions, sensations resulting from verti-cal or horizontal motion, from the eXperience of decreased safety conditions, or from anxiety over potential damage to
the vehicle.
B§2i29_3§§3_2
Using the same nine grade scale, the subjects were asked to state what they considered to be acceptable discomfort levels
national for four categories of roads: inter European roadways,
trunk roads, primary roads, and secondary roads, for roads on which the highest permitted speed was 90km/hr for cars and 70km/hr for trucks,
travel a distance lasting one hour.
and for roads on which they were going to
Procedure
After having read through and understood a set of instructions, the subjects rode as passengers over the entire eXperimental course in a vehicle which was not one of the types used in the experiment. After controlling that the subjects had fully understood what was required of them, they carried out the first rating task in one of the five rating conditions. The method used was that the vehicle was stopped after each rating
section and the rating carried out. After all twenty sections had been rated, the subjects were first allowed to correct
their ratings if they wished, after which they proceeded to the second rating task. The data was then collected and the subjects proceeded to the next rating condition. The majority of the
subjects were interviewed after the first and last rating their general atti
session during which, among other topics,
tudes toward the rating method, as well as their ideas about how they had managed the tasks, were discussed.
23.
Results
999s;§Esasy_§meag_Eh§-§291§92§_QY§£_ED§_£§2229§
The ratings of the various road sections were consistent and
any differences among the subjects were insignificant. The reliability coefficient for the ten subjects who had carried out the ratings under all five rating conditions was 0.98
1966; 1970).
(Ferguson, Winer,
§192i£iss99s_9£-2shlsls_Eyes_§9§_£§2i29_99§£2192
Ten of the thirty subjects Carried out the ratings under all five rating conditions. The results from these subjects were highly consistent despite the variety of conditions in which
The correlations (Pearson's product .97 for "driver" and .98 for "passenger", both significant at the the ratings were done.
moment correlation) for the passenger cars were
.1% level. Correlations for the driver-passenger positions and passenger car - truck vehicle types were .99 (see Fig. 10) and .96 (see Fig. 11) respectively, both also significant at the .1% level.
In order to determine whether or not the consistency of results had been influenced by memory effects, the results
from the groups which had either driven only as passengers
in the truck or only as passengers in the cars were compared with the results from the subjects who had carried out the ratings under all rating conditions. Again, the results were similar,with no significant differences occuring betweeen the
1966).
in the interviews that memory had not affected their
different groups, (Ferguson, The subjects also stated
responses, as they had been unable to remember their ratings
D r i ve r 3 Pa ssen ge r A
1
«a
L In. 4 b p In 1-p h. In nun-p. 1-.- nun-. Inn. S e c t i o n N o F i g 10. R a t i n g of t h e g e n er a l e xp e r ie n c e o f d i sc o m f o r t wh e n d r i vi n g on r o a d s r ep r e s e n t i ng va r yi n g d e g r e e s o f r o ug h -n e s s. C o m p a r i so n b e t we e n r a t i n g s d one b y d r i ver s a n d r ati n g s d o n e b y p a s s e n ge r s 24.R a t i n g s p e r f o r me d in p a s s e n g e r c a r s 3 R a t i n g s p e r f o r m e d in t r uc k s x X0 X0. m m F i g 11 . I I I I I I I l l I l I I I 14 ' 11 8 18 7 16 13 4 10 5 17 2 12 15 6 _ S e c t i o n N o R a t i n g of t h e g e n e r al e X p e r i e n ce of d i s c o m fo r t wh e n d r i vi n g o n r o a d s r ep r e s e n t i n g va r yi n g d e g r ee s o f r o ug h -n ess . C o m p a r i s on b e t we e n r a ti n g s c a r r i e d out in p a s s e n ge r F Q Y C n n r q n vv4 / A A Q J J . L q . -l _ 1 . . _ . 25.
26.
§92£9s§_9£_Ehs-§9§sl_s§9§£;sass_9£_§i§ssm§9£2
In addition to rating total discomfort, the subjects were asked to state in what degree the discomfort had arisen from
different sources, e.g., visual/auditory sensations,
sensa-tions resulting from vertical or horizontal motion, etc. This task proved too difficult; the subjects found that while they were concentrating on the actual rating of the degree of dis-comfort experienced, it was impossible to simultaneously
observe what had caused the discomfort. The subjects also found it too difficult to state the degree to which anXiety about an accident or possible damage to the car might have influenced their feeling of discomfort.
§E§§EE§§l§_§l§EQT§9£E_léYél§_§9£_§l§§§£§EE-£9§§_E§E§99£2§§
In the second rating task, the subjects were asked to state,
using the nine-grade scale, what they felt to be acceptable discomfort levels for inter-EurOpean roadways, national trunk
and secondary roads. This task was roads, primary roads,
carried out for each of the five rating conditions.
As regards levels for inter European roads, 23% of the subjects stated that grade 2 was acceptable whereas 54% felt that grade 1 was necessary. The remaining 23% stated that all of the 3 twenty sections were too rough to be acceptable as inter
European roadways; this was especially true.for the subjects carrying out the ratings in the VW or the truck.
As regards levels for national trunk roads, 52% of the subjects stated that grades 2-4 were acceptable, 42% required grade 1, and 6% felt that none of the twenty sections were acceptable as a national trunk road (in this last category, none of the
ratings had been carried out in the Volvo).
Fifty-four percent of the subjects stated that grades 3-5 were acceptable for primary roads while 34% required grade 2. The remaining 12% felt that grade 1 was necessary.
27. As regards the last category, secondary roads, 26% of the subjects stated that grades 6 7 were acceptable, 58% felt that grades 3 5 were acceptable, 10% required a grade of at least 2, and 6% felt that grade 1 was necessary.
The subjects were more tolerant of the rougher roads in the Volvo than they were in either the VW or the truck. For
example, the mean value for acceptability on secondary roads
was 4.1 in the Volvo, while it was 3.7 and 3.4 respectively
in the VW and the truck.
Assspzsbls_éisegm£9£2_lsysl§_whils_§£iyi29_ZQ-§2§_29_£mZhr
The road sections rated as the roughest (grades 7-9) were considered to be too rough for roads on which the highest permitted speed was 901Um n:for cars and 70km/hr for trucks. The majority of the subjects stated that they felt grades 3 4 were acceptable for a 901qm uispeed limit in a passenger
car. The mean values were as follows: Volvo driver: 3.8,
Volvo passenger: 4.3, VW driver: 3.6, and VW passenger: 3.8.
In general, the same standards applied to the truck at
701qm utas for the passenger car at 90k Vhru The mean value for truck passenger was 3.4.
52999§§91s_§i§299£9£2-1sysl§_£9£_§_éi§2§29s_£s99;££29-92s
hour's travel
Most of the subjects stated that roads of grade 6 would be acceptable for distances requiring one hour's travel. The
mean valuesvmnxaas follows: Volvo driver: 5.8, Volvo passenger: 6.0, VW driver: 5.1, and VW passenger: 5.1.
The ratings were rather consistent, with no rating lower than 3 or higher than 7. For the truck, the mode value was 5 and
the mean value 4.2.
Gemssri§92_9£_Ehs_ssbissfirs_§§E§_wi§h_§h§_§§§§_££99_tbs
road meters
The results showed a strong consistency between the subjects' ratings and the data from the road meters for at least two
.2.8
28. The product moment correlation between the CHLOE profilo-meter's TRAC values and the ratings carried out under all for the PCA meter's TRAP values, the figures were .88 at SOkHMhr, .89 at, rating conditions has been estimated at .90;
I lem/hry and .87 at 90kmv%un All of the above figures are
significant at the 0.1% level.
correlation between the truck and TRAP values at 70 km/hr
.89 and for the passenger car - TRAP values at 90kmv un it
The was
was .87. These results are also significant at the 0.1% level.
The cal
road meter operating on the principle of measuring verti-acceleration at the rear axle of a passenger car showed rather poor correlation with the results from the subjects. The results from the GM profilometer have not been analyzed. The development of an appropriate method of analysis was severely delayed and would not have been ready for use until the fall of 1975, which was after the main experiment had
been carried out. Conclusions
The results from the pre-experiment showed a consistency among the subjects,regardless of the vehicle or poSition in which
ratings also The the rating had been carried out. The subjects'
conformed to the data from two of the four road meters. nine-grade scale proved to be well-suited for its purpose
ahdlthUSICOUld be used without alteration in the main experiment. The results thus showed that at least persons with some back-ground in road technology could use the scale and that their ratings conformed to data from objective means of measurement. It therefore seemed justified to see whether or not the same results could be achieved by a group more representative of the Swedish driving population in general.
The results from the pre experiment pertaining to the question in which the subjects were asked to judge the degree to which various subfactors had contributed to their total experience of discomfort showed that this task had been too difficult.
This question was, therefore, eliminated in the main experiment
and a more indirect means was used to study the various sub factors contributing to the total eXperience of discomfort.
29.
MAIN EXPERIMENT
The Organization of the Main Experiment
The main experiment was, in principle, identical to the pre experiment except for the following details:
Yshisls_Eyes_§s§_£§2iss_99§i§iga
The ratings were carried out under six different conditions in
four vehicles:
1. Passenger in a two-axle truck, Scania L76, 42-160, 1966
2. Passenger in the rear of a bus, Volvo B58-6O T,
1971
3. Passenger in a three axle truck, Volvo NB88-44,
1970
4. Passenger in a passenger car, 701qm mr,Volvo 144, 1974
5. Passenger in the front of a bus,
(same as 2)
6. Passenger in a passenger car, 90 km/hr, (same as 4)
were carried out in the
All of as seen above,
passenger position. The pre-experiment had shown that there
the ratings,
was no significant difference between ratings carried out by driver vs. those carried out bypassenger. For practical
the vehicles
The
reasons,as well as for the purpose of uniformity,
were therefore driven by specially instructed drivers.
30.
§2§j§2§§
Forty subjects between the ages of 18 and 70, took part in the study. Approximately one third of the subjects came from a large city area, one third were from a medium sized town
in the north of Sweden, and one third were from a rural area,
also in the north of Sweden. The purpose of having these different groups was to see whether or not the subjects from the north of Sweden judged road roughness differently from the other subjects.
B§2;99_§§§E_l
In rating task 1 the subjects were required to judge, on a nine-grade scale, their experience of discomfort on each of twenty road sections.
B§2i29_§§§5_2
Rating task 2 was identical to that in the pre experiment except that in addition to stating which level of discomfort
the
were also required to state which levels they could 2.5 and 8 hours. This was done in order to compare the data with the ISO Standard.
they could tolerate for distances lasting one hour, subjects
25 minutes,
tolerate for distances lasting 16 minutes, hours, 4 hours,
Procedure
The procedure Was the same as that used in the pre-experiment. The subjects were given a slight rest period after they had carried out the ratings in each vehicle type. After half of the experiment had been completed, they had a light meal and rested for half an hour. The data was collected and checked after the subjects had carried out the ratings in each vehicle type,and any incomplete forms were returned to the subjects for completion.
31.
Results!
QQB§E§EEEEY-§¥J9§9_Eh§_§E§i§EE§_QY§£_EE§_£§EEI}9§
The results from rating task 1, in which the subjects were asked to rate their experience of discomfort on twenty road sections, showed a strong consistency among the subjects, regardless of in which vehicle the ratings had been carried
out, e.g., section 2 was judged to be the least tolerable in
all of the vehicles. Likewise,section 20 was judged to be
the most tolerable in all of the vehicles. Even the rank order
of the various sections was the same, irrespective of vehicle type.
The reliability was high: .98 for both trucks as well as for the bus (rear) and .99 for the passenger car at both 70 and 901um usas well as for the bus (front) (Winer, 1970). Since no significant differences were obtained between the results from the subjects living in the large city area and those
living in the north of Sweden (both town and rural areas),
these groups were not treated separately when describing the
results.
E§9s£l§29§_9£_éi§sgm£9£§
Several attempts were made to indirectly study the influence of certain subfactors assumed to affect comfort. Noise was measured in all of the rating vehicles but as the noise factor appeared to be more dependent upon the the engine's R.P.M. than on actual road roughness, it was impossible to correlate noise in the vehicle with the experience of dis
comfort.
The visual information about the road's surface did not appear to influence the ratings either. One road section,with smooth wheel track areas and roughness in the centre of the road, appeared rough to the subjects but was still rated as rela-tively smooth. The ratings thus appear to be more likely based upon the actual experience of roughness occurring in
the area of the wheels. Also, ratings carried out in the rear
.2.3
32.
surface was limited, did not differ from the ratings carried
out in any of the other vehicle types. The significance of sideways motion and pitchvnusuncertain since they usually occurred in conjunction with vertical motion.
49999299;§_919990£9£E_legals-f9£_§1££9£§2£-£999-29§§99£1§§
In rating task 2,the first task was to state what were con-sidered to be acceptable levels of discomfort for four cate-gories of roads: inter European roads, national trunk roads, primary roads, and secondary roads.
Table 1 shows the mean and standard deviation for the subjects' ratings of each of the four road types. The data shows a
significant difference between inter-European roads and national trunk roads at the 5% level. The difference between primary
and secondary roads is not significant. The table shows that not even the smoothest of the twenty road sections was accept-able as an inter European road in the bus or truck. It must
be recognized, however, that the standard deviations were
rather high and, thus, the consistency among the subjects was not especially strong.
g Road category
inter-European
Type of National ,Primary =Secondary
vehicle roads trunk road 3 roads roads
M
g
s
M g
s i
M
s
M g
s
2-axle
-0,03 5 2,4
2,4 ; 2,2 E 4,6
2,5
6,6
2,9
Truck 3_axle _0 03 3 1,9 2,3 g 1,9 : 4,8 2,3 7,0 2,8front
0,01 3 2,0
2,5
2,0 I 5,1
2,3
6,9
2,9
Bus
rear
0,26 ; 1,9
2,5
1,8 _ 4,8
2,0
6,9
2,4
70 km/hr
1,05
1,9
3,5
2,1
5,6
2,3
7,7
2,4
Passenger car90 km/hr
1,13
1,6
3,3
1,7
5,3
1,9
7,1
2,1
F ; 2,97 2,59 1,02 0,67 Mean value S Standard deviationAcceptable discomfort levels for different road cate
gories. Mean value, standard deviation and F value.
The difference between inter European roads and national trunk roads is significant at the 5% level.
.2.
33.
Assss:2§ls-§;§sem§9£5_lsysl§_whils_§£12123_Z9-393-29-Em£h£
In the next part of rating task 2, the subjects were asked to state what they considered to be acceptable levels of dis comfort on roads where 70 and 90l m nrwere the highest per mitted speeds. The results showed that in the truck and bus, the ratings were 4 5 on roads with a 70lqm nrspeed limit, while in the passenger car,levels 6-7 were acceptable. On a road with 901qm nras the highest permitted speed, a better
standard than was represented by any of the twenty road sections
was demanded in the trucks. In the rear of the bus, a standard
corresponding to the smoothest of the sections was required for speeds of 9Ok Vhr,M UJ£21evel 2 was acceptable in the front of the bus. Approximately 3.5 was acceptable in the passenger car. Table 2 shows the mean and standard deviation for the ratings carried out in the different vehicles. The standard deviation is somewhat higher here than in the previous task
of stating acceptable discomfort levels for different road types. Highest permitted speed
Type of vehicle 70 km/hr
90 km/hr
M i
s
M g
s
2~axlef 4,5 3,0 0,7 3,0¢rUCk
3-axle
5,0
3,3
0,9
2,4
front f 5,1
2,5
2,1
2,5
Bus
rear
5,1 ' 3,1
1,3
2,2
70 km/hr
7,1 : 2,6 ; 3,7
3,2
Passenger car
i
I
;'
90 km/hr
6,5 § 2,8 § 3,4
2,8
Mean value S Standard deviationTable 2. Acceptable discomfort level while driving 70 and 901qmquijean value and standard deviation.
.2.
34.
89998599l9_919998£9£E_l929l§_£9£_91§£99998_£9921£199_91££§£99§
time durations
In order for a comparison between the results from the ratings and ISO Standard 2631 to be made, in the last part of rating
task 2, the subjects were asked to mark, on the nine-grade scale,
which levels of discomfort they considered acceptable for trips
lasting 16 min., 25 min., 1 hr., 2.5 hrs., 4 hrs., and 8 hrs.
For all of these ratings, a 5% significance level between the different vehicles was obtained. This showed that the comfort requirement was much stronger for a trip in the truck or rear
of the bus,than it was in the other vehicles. Not even the
smoothest of the 20 sections was stated to be acceptable for a trip lasting 8 hrs. in the bus or in either one of the trucks
(see Table 3).
' Acceptable discomfort leVels for.different time durations i i
16 min [25 min
1 hr ?2,5 hrs? 4 hrs
8 hrs
M ; s % M ' s
M
s
M
s
M i s
M
8
Type of vehicle?
2vaxle
8,1?2,3§6,6 2,5 4,7 2,1 3,1 2,211,3§2,1 003 2,2
Truck . , 1 a .1 A ..' 5,
3~axle
8,2 2,0 6,7 1,934,7 1,8 3,0 1,5 1,3 1,9 «L26 1,9§
Bus
front
8,0;2,0 6,6 1,9 4,6 1,8 3,01,6 1,8 1,7 4LO3 1,9
rear
"8,6 1,8 7,3 1,7 5,5 1,6 3,9 1,72,2 1,6 0,85 1,8
.
i0 km/hr 10,0 2,0 8,6 2,2 6,7 2,1 5,3 1,9 3,6 2,1: 2,2 2,3
Passenger car . : '90 km/hr 9,3 2,1 8,1 1,8 6,3 1,7 4,8 1,6 3,3 1,4 l,6~l,5,
F
'
5,81
6,53
9,45
12,50
11,99 '
10,05
M = Mean value S = Standard deviationTable 3. Acceptable discomfort levels for distances requiring
different time durations. Mean value, standard devia
tion and F-value. The differences between the different time durations are all significant at the 5% level.
35.
Correlation of the results with ISO Standard 2631
The results showed that the subjects accepted longer exposure time for roughness on smooth roads than could be expected from the ISO boundary for the maintenance of comfort. On rougher roads the exposure time approached the ISO boundary.
When the means of all the ratings on each road section were compared with the data from the road meters, there appeared to be a strong correlation for three of-the four meters. Fig. 12 shows the correlation between the subjective means and the data from the GM profilometer (GM), PCA meter (TRAP), CHLOE profilometer (TRAC) and the Chock meter. As can be seen
from the figures, the TRAP and TRAC values correlate well
with the values_from the ratings,while the ChOck meter values correlate rather poorly. The GM values correlate rather well in general, although they deviate for several sections. In section 9 where the deviation was greatest, a very rough area was located in the centre of the road,which was not picked up
13).
however, picked up by the measuring wheel of the GM meter,
by the wheels of the vehicles (see Fig. The roughness was,
which is located between the ordinary wheels. The correlations between the subjective ratings and the meters (as well as the meters' reliability) can be summarized as follows:
Correlation With rating. Reliability GM profilometer: .91 (Excluding section 9) (0.96)
PCA meter: .88 (0.98) CHLOE profilometer: .86 (0.99) Chock meter; .43
-xeqem xoouo 4 quew p908 VDd xeqemoIIJOId HOTHQ Ai xeqemoIrgoxd ms v r-I Th e Ch o c k me t e r
l
Th e CH L O E p r of i l om e t er Al
sburaea Th e PC A Road \ m et e r The G M _\ p r o f i l om e t e rJ
A ve r a g e va l ues f r o m a l l t h e r a t i ng s1
// \\ //>e
-¥
\ ONCDPKOLOV MNI Il 2 3 4 5 6 7 8 9 10 ll 12 13 14 15 S e c t i o n N o . l6 17 18 19 20 36 F i g 12 . M e a s ur i n g r e s ul t s f r o m t h e G M p r o f i l o m e t e r , t h e P C A R o a d M e t e r , t h e C H L O E p r o f i l o -m e t e r , a n d t h e C h o c k m e t e r as c o m p a r e d wi t h t h e a ve r a g e va l ue s of a l l t h e r a t i n g s
37.
WW" II m
V . lidhjh7". g f
4 uh Iii." ~0 "Naif-«.355;"e' a»- -:-L
38.
DISCUSSION
In the previously discussed experiments, a number of issues related to the measurement of the effects of road roughness on the experience of comfort have been examined. This part of the report will be devoted to a discussion of some of these
issues.
The rating of discomfort
The method used for rating of discomfort was a rating scale in which the highest and lowest categories were defined by the
subjects themselves. The results showed a strong consistency among the subjects.
One problem related to the rating of the eXperience of dis-comfort had to do with determining the actual source of the feeling of discomfort. The task of partially rating the total experience of discomfort,and partially rating the relative significance of different sources of information for this experience,proved to be too difficult. This was most likely due to the fact that the eXperience of discomfort is derived from a number of different sources,and the resulting informa tion is weighed together in an unconscious way to form a total impression. This theory is mainly based on the ideas of Gibson
(1969» who suggests that although the senses furnish us with a great number of perceptions, these are not necessarily differ-ent or recognized individually. Although man realizes how
his body is positioned in space and how it functions in
different activities, he, at the same time, is unaware of the
fact that this knowledge is based on a complex of information
from such sources as balance organs, muscles, the skin, the
eyes, and the ears. The experience of comfort can be
under-stood in the same way, i.e., as a certain phenomenon arising
out of a synthesis of information from the various sense organs.
39. By using indirect methods of analysis it can be suggested that this experience of discomfort is dominated by the experience of vertical motion, while noise and sense perceptions have a relatively minor impact. The influence of sideways motion and pitch is uncertain since these motions do not occur in an iso-lated fashion,.but ordinarily in conjunction with vertical motion (Thiery, 1972). The only conclusion that can be drawn
from these observations is that vertical motion appears to be the dominating influence in the experience of discomfort. In the second rating task the subjects were asked to state acceptable discomfort levels for driving on four different
categories of roads, as well as on roads with 70km/hr and
90km/hr as the highest permitted speeds. In addition, they were asked to state acceptable discomfort levels for trips requiring different time durations. Ratings of this nature are extremely demanding and a number of factors can be expected to influence the subjects, e.g., expectations of how the results might be used and if they might eventually come to affect
them through new restrictions, tax increases, etc.
Attempts to eliminate the influence of such factors on the subjects were not made in this study, but due to the large number of subjects and the resultant probable diversification in their expectations, the results are felt to be reliable. The results did show that even in this task, the ratings were fairly consistent, although the standard deviation was much greater than in the direct rating of discomfort.
Agreement with ISO Standard 2631
An international standard specifying boundaries for whole-body vibration has been established by the International Standardiza-tion Organization and presented as ISO Standard 2631. Three differenthmndariesfor the human exposure to whole body vibra-tion are given in the Standard:
1. Boundary for the maintenance of comfort
2. Boundary for the maintenance of work capacity 3. Boundary for the maintenance of health/safety
40.
In most instances, the criticisms of the ISO Standard have been
that the standard was not established under realistic conditions. The standard is essentially based upon the results from experi-ments using simulators where the subjects are exposed to sinusoi
dal vibrations of different amplitudes. The subjects can thus,
by means of the musculature, tense different parts of their bodies in order to protect themselves and reduce the effects of the vibrations. Arnberg (1973) has referred to this as "antici-pation effects". Road roughness gives rise to vibrations of a
much more random nature,whose influence is much more difficult
to reduce by preparing the body. Random vibration should, thus, according to the hypothesis about "anticipation effects", be experienced as more uncomfortable than sinusoidal vibration. In turn, the "anticipation effects" should be more pronounced for sinusoidal vibrations of greater amplitude than for those of lesser amplitude.
The results showed that: 1) In general, the subjects were not as critical about vibration as could be expected from the ISO Stan-dard; in other Words, judging from the ISO Standard, one would expect the subjects in the present experiment to be much more intolerant than they were about the discomfort experienced on the different road sections. The subjects who helped to develop the ISO Standard probably underestimated the effects of rough roads, due to the aforementioned "anticipation effects". It can be hypothesized that these two factors cancel each other out on rough roads, making the ISO Standard applicable for these roads,
whereas for smoother roads, it tends to overestimate discomfort.
Representativeness of Road Sections
The data from the PCA profilometer were compared with data from an earlier measurement of Swedish E4 between Stockholm and
Harnosand, a distance of approximately 400 km. Figure 14 shows the comparison of the distribution of the 558 TRAP values taken from E4 with the distribution of the values for the twenty
sections on National Road 90, both converted to a nine grade scale. As can be seen from the figure, the twenty sections on National Road 90 represent the same categories of smoothness to roughness conditions as found on Swedish E4.
41.
D ' E4 ,5 Stockholm H'arnosand
llll
[ ] - Experimental Road Sections
[
WWW l
lllllllllll- IIIIILIIIIIIIFig 14. E4 the distance Stockholm-Harnosand. Trap-values measured with the PCA Road Meter and transferred to the nine grade rating scale. Average rating values from National Road 90 are also shown in the figure.
42. In discussions with the subjects from both the pre and main experiments, it was felt that the subjects also considered the road sections used in the experiment to be representative.
La Barre, Forbes, and Andrews (1970) have, through data from
road meters on a large number of roads in England, France, Belgium, and West Germany, shown that roads are relatively similar with regard to type of vibration frequency. They show also that if one road is rougher than another in a certain wave length or frequency, this applies to the road's entire wavelength or frequency range.
Comparison of Measuring Instruments
The Swedish Road Administration's interest in road roughness and road measuring instruments is concentrated on the following
three areas:
1. The development of roughness on newly laid pavements
2. An inventory of smoothness standards on a larger sample of
roads in order to determine which roads are worst and need
improvement
3. The examination of a particular road in order to see if a previously determined standard has been maintained
The three road meters, GM, PCA, and CHLOE, can be said to be of
equal value in terms of reliability and consistency with the subjective ratings. The choice of a road meter should thus be based on the knowledge about the technical/practical aspects of the different systems. The GM profilometer can be said to be a generally complicated and expensive instrument which
demands highly qualified technical personnel for its operation.
The PCA meter is, from the technical standpoint, a considerably
simpler instrument, but it must be calibrated at least once every six months. As regards the CHLOE meter, its most serious limita-tion is the low speed required for measurement which means that the production of data is much lower.
43. The Chock meter, due to its rather poor correlation with the subjective data, cannot be recommended.
The results show, therefore, that the PCA meter is the most recommendable. An absolute requirement for its use, however,
is that it be calibrated regurlarly. Implications for further research
One of the purposes of the present study has been to find an objective means of measurement which will make it possible to express the degree of roughness in terms of a comfort measure-ment and on the basis of this, establish a comfort-based rough-ness norm. Continued research in the field would undoubtedly lead to the establishment of an even more precise relationship between comfort experience and roughness. It is the writers'
opinion, however, that the gains achieved by further research
in terms of increased knowledge and a more precise basis for the establishment of a roughness norm do not warrant the time and expense which this research would entail. Energy would be more profitably spent if it were directed toward solving some of the other problems in connection with vibration, e.g., how
road roughness affects traffic safety conditions through its
influence on the road user's performance capacity. In order to achieve a complete- picture of the influence of road roughness on safety, comfort, transport economy, and road construction
and maintenance, however, a number of additional factors must be taken into consideration, and not until all of these factors
have been considered, will it be possible to obtain a total
10
44.
REFERENCES
Allen, G, Human Reaction to Vibration. Journal of Environmental
Sciences, 1971, 14, (5), 10 - 15.
Arnberg, P.W. Litteraturgenomgang och diskussion av vagojamn heters betydelse for komfort och prestation. Statens vag-och trafikinstitut, Internrapport 134, 1973.
Beaupert, J.Eé Ten years of Human Vibration Research. Naval Contract Number 2994/001. The Boeing Company, Wichita, Kans. 1969. (Ref. genom Stikeleather et a1 1972).
Bjorkman, M. and Ekman, G. Experimentalpsykologiska metoder. Stockholm: Almqvist och Wiksell, 1966.
Collins, A.M. Decrements in tracking and visual performance
during vibration. Human Factors, 1973, 16, (4),379 393.
Ferguson, G.A. Statistical Analysis in Psychology and Education.
London: McGraw-Hill, 1966.
Gibson, J.J. Vara sinnen som perceptuella system. (The Senses Considered as perceptual Systems). Stockholm: Beckmans Bokforlag AB, 1969.
Grether, W.F. Vibrations and Human Performance. Human Factors, 1971, 13, (3), 203 - 216.
Guignard, J.C. and Guignard, E. Human response to vibration:
a critical survey of published work. University of Southamp-ton ISVR Memorandum No 373, September 1970.
Hornick, R.J. Vibration Effects on Man - an Overview of Recent
Research. Report TDOC 690. Litton Systems, Advanced Marine Technology Division, El Segundo, California 1969.
45.
International Organization for Standardization, Guide for the Evaluation of Human Exposure to Whole-Body Vibration. ISO/Dis 2631. 28 april, 1974.
Janeway, R.N. Human Vibration Tolerance Criteria and Applications to Ride Evaluation. SAE paper 750166, Detroit Mich.,
Feb 24 28, 1975.
Kling, J.W. and Riggs, L.A. Woddworth and Schlosbergs Experi-mental Psychology. London: Holt, Renehart and Winston,
Inc. 1972.
La Barre, R.P., Forbes, R.T. and Andrew, S. The Measurement
and Analysis of Road Surface Roughness. The Motor Industry Research Association, 1969, Report No. 1970/5.
McCullogh, M.L. and Clarke, M.J. Human Response to Whole-Body
Vibration: An Evaluation of Current Trends, Human Factors,
1974, 1g, (1), 78 - 86.
Stevens, 8.8. On the new psychOphysics. Scandinavian Journal
of Psychology, 1960, 1, 27 - 35.
Stikeleather, L.F., Hall, G.O. and Radke, A.O. A study of
vehicle vibration spectra as related to seating dynamics.
SAE paper 720001, Detroit Mich., Jan. 10 - 14, 1972.
Thiery, J. La mesure objective du confort vibratoire a bord des camions. Journal de la societé des Ingenieurs de 1'automo-bile, 1972, 4, 230 239.
Winer, B.J. Statistical principles in experimental design,