LIVSMEDELSVERKETS SAMARBETSRAPPORT
S 2020 nr 01
Contaminants in blood and
urine from adolescents in
Sweden
Results from the national dietary survey Riksmaten
_________________
Denna titel kan laddas ner från: Livsmedelsverkets webbsida för att beställa eller ladda ner material.
Citera gärna Livsmedelsverkets texter, men glöm inte att uppge källan. Bilder, fotografier och illustrationer är skyddade av upphovsrätten. Det innebär att du måste ha upphovsmannens tillstånd att använda dem. © Livsmedelsverket, 2020.
Författare:
Preface
The present report summarises the results from analysis of contaminants in blood and urine samples from participants in the dietary survey Riksmaten Adolescents 2016–17. These biomonitoring data provide unique information on total exposure to contaminants from all sources, including food, in Swedish adolescents. The results will be used further in risk assessments of contaminants in food by the Swedish Food Agency (Livsmedelsverket). Data from the project is also part of the national health-related environmental monitoring at the Swedish Environmental Protection Agency (Naturvårdsverket). The aim of this monitoring is to estimate human exposure to hazardous
substances, follow temporal trends in human exposure, and to link environmental exposure to effects on health. The results from this report may also be useful for experts working with risk assessment and risk management in other organizations at the national or regional level.
The dietary survey Riksmaten Adolescents 2016–17 was carried out by the Swedish Food Agency. The analysis of contaminants and the writing of this report were mainly financed by the Swedish
Environmental Protection Agency (agreement numbers 2215-17-007, 2215-17-017 and 2215-18-010) and by the Swedish Food Agency. Financial support was also provided by the Swedish Civil
Contingencies Agency (MSB) and Sahlgrenska University Hospital (Occupational and Environmental Medicine), Gothenburg.
Galia Zamaratskaia, Sanna Lignell and Helena Bjermo were responsible for the statistical analyses and the writing of this report. A number of experts at the Swedish Food Agency have contributed with expert advice and critical review of the report: Anna Karin Lindroos, Barbro Kollander, Irina
Gyllenhammar, Emma Halldin Ankarberg, Tatiana Cantillana, Anneli Widenfalk, Lotta Moraeus and Cecilia Nälsén. A special thanks to all colleagues who were involved in the planning and
implementation of Riksmaten Adolescents 2016–17, including handling of samples and chemical analyses. Thanks also to the regional divisions of Occupational and Environmental Medicine (AMM) who were responsible for the collection of human samples. Responsible for the chemical analyses were Barbro Kollander and Tatiana Cantillana (the Swedish Food Agency), Jon Benskin (Department of Environmental Science and Analytical Chemistry, Stockholm University), Christian H Lindh and Thomas Lundh (Division of Occupational and Environmental Medicine, Lund University) and Hannu Kiviranta (National Institute for Health and Welfare, Finland).
Livsmedelsverket / The Swedish Food Agency Per Bergman
Avdelningschef, Risk- och nyttovärderingsavdelningen / Head of the Risk and Benefit Assessment Department
Content
Preface ... 3 Abbreviations ... 7 Sammanfattning ... 8 Summary ...10 Introduction ...12Chlorinated and brominated persistent organic pollutants ...12
Per- and polyfluoroalkyl substances ...14
Metals and metalloids ...15
Phthalate metabolites and phenolic compounds ...18
Aim ...20
Materials and methods ...21
Study population ...21
Data collection ...22
School visits ... 22
Sample handling and storage ... 23
Variables in this report ... 23
Analytical methods ...24
Chlorinated and brominated persistent organic pollutants ... 24
Per- and polyfluoroalkyl substances ... 26
Metals and metalloids ... 27
Phthalate metabolites and phenolic compounds ... 28
Statistical analysis ...30
Results and discussion ...31
Characteristics of the study population ...31
Chlorinated and brominated persistent organic pollutants ...34
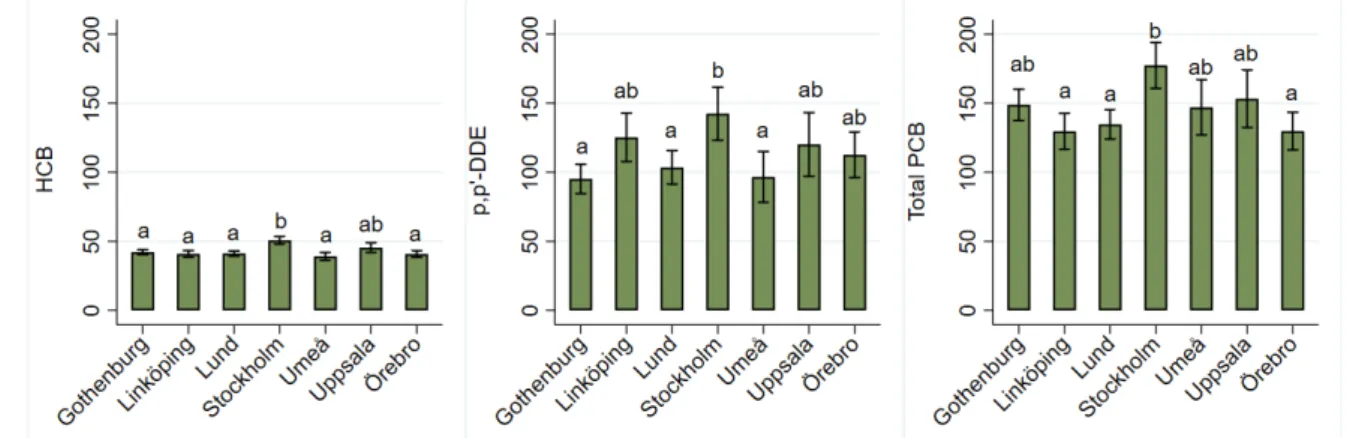
Differences in concentrations of chlorinated persistent organic pollutants between regions .... 36
Differences in concentrations of chlorinated persistent organic pollutants between genders and grades ... 37
Per- and polyfluoroalkyl substances ...39
Differences in concentrations of per- and polyfluoroalkyl substances between regions ... 41
Differences in concentrations of per- and polyfluoroalkyl substances between genders and grades ... 42
Metals and metalloids ...45
Metals ... 45
Differences in metal concentrations between genders and grades ... 47
Associations between metal concentrations in blood and smoking habits ... 50
Arsenic ... 50
Differences in arsenic concentrations between genders and grades ... 52
Associations between arsenic concentrations and country of birth ... 52
Phthalate metabolites and phenolic compounds ...54
Phthalate and DiNCH metabolites... 55
Phosphorus flame retardants ... 55
Bisphenols ... 56
Polycyclic aromatic hydrocarbons metabolites... 56
Insecticide metabolites ... 56
Other phenolic compounds ... 56
Differences in concentrations of phthalate metabolites and phenolic compounds between regions ... 57
Differences in phthalate metabolites and phenolic compound concentrations between genders and grades ... 58
Concluding remarks ...62
References ...63
Appendices ...73
Appendix 1. Details of analytical methods used in Riksmaten Adolescents 2016–17 ...73
A1.1. Chlorinated and brominated persistent organic pollutants in individual serum samples ... 73
A1.2 Brominated flame retardants in pooled serum ... 73
A1.3 Per- and polyfluoroalkyl substances (PFAS) in blood serum ... 74
A1.4. Metals in whole blood and serum, and metalloid arsenic in urine ... 77
A1.5. Phthalate metabolites and phenolic compounds in urine ... 79
Abbreviations
AI adequate intake
AMM Occupational and Environmental Medicine (Arbets- och miljömedicin)
ANOVA analysis of variance
BFR brominated flame retardant
BMDL benchmark dose lower bound
bw body weight
CI confidence interval
CV coefficient of variations
EFSA European Food Safety Authority
IARC International Agency for Research on Cancer
IOTF International Obesity Task Force
LOD limit of detection
LOQ limit of quantification
NHANES National Health and Nutrition Examination Survey (U.S.)
NOAEL no observable adverse effect level
PAH polycyclic aromatic hydrocarbon
PFAS per- and polyfluoroalkyl substance
POP persistent organic pollutant
PVC polyvinyl chloride
QC quality control
RSD relative standard deviation
SCB Statistics Sweden (Statistiska Centralbyrån)
SD standard deviation
SFA Swedish Food Agency (Livsmedelsverket)
TEQ toxic equivalent
TDI tolerable daily intake
TWI tolerable weekly intake
Sammanfattning
I denna rapport sammanfattar vi biomonitoreringen av kemiska föroreningar i blod och urin från deltagarna i matvaneundersökningen Riksmaten ungdom 201617. Data från matvaneundersökningar
som denna utgör en viktig vetenskaplig grund för Livsmedelsverkets risk- och nyttovärderingar. De är också viktiga när vi arbetar med riskhantering som kostråd, livsmedelskontroll och
livsmedelslagstiftning.
Riksmaten ungdom 201617 är en nationell tvärsnittsstudie där Livsmedelsverket undersökt
matvanorna hos barn och ungdomar i årskurserna 5 och 8 samt andra året på gymnasiet (dvs. i åldrarna 1112, 1415 respektive 1718 år). Vi bjöd in representativa skolor över hela Sverige för att delta. Samtliga elever i en till två klasser vid de deltagande skolorna tillfrågades. I den här rapporten ingår den delgrupp av deltagare i Riksmaten ungdom 2016–17 där blod- och urinprover samlades in. Vi rekryterade elever från skolorna mellan september 2016 och maj 2017. Av de 259 skolor som blev inbjudna för blod- och urinprovtagning deltog 62 (24 procent). Vid dessa skolor deltog 1 305 av de 2 377 tillfrågade eleverna, varav 1 105 elever (46 procent) både gav fullständig information om matvanor och lämnade blod- och urinprover. 56 procent av deltagarna var flickor. 30 procent gick i årskurs 5, 37 procent i årskurs 8 och 32 procent i årskurs 2 på gymnasiet. Skolorna fanns i regionerna för Sveriges sju arbets- och miljömedicinska enheter (Göteborg, Linköping, Lund, Stockholm, Umeå, Uppsala och Örebro).
I de blod- och urinprover som vi samlade in undersöktes ett brett spektrum av kemiska föroreningar: ämnen som inte längre är godkända för användning men ännu finns i miljön, ämnen som fortfarande produceras och används samt naturligt förekommande metaller. Vi analyserade följande grupper av substanser: klorerade och bromerade persistenta organiska föroreningar, högfluorerade ämnen, metaller, ftalatmetaboliter och flera fenolära ämnen (bl.a. bisfenoler och metaboliter av några bekämpningsmedel).
Analysen av klorerade organiska föroreningar i serum visade att halterna var högst av
DDT-metaboliten DDE, följt av PCB-153, hexaklorbensen (HCB), PCB-138 och PCB-180. Av den totala halten PCB utgjorde PCB-153, PCB-138 och PCB-180 ca 70 procent. Pojkarna i undersökningen hade högre halter än flickorna av de flesta klorerade föreningar. Halterna av DDE och vissa typer av PCB var dessutom högre bland de äldre deltagarna.
Av de högfluorerade ämnena uppmätte vi högst serumhalter av PFOS och PFOA. De högsta halterna fanns hos ungdomar från Ronneby kommun (region Lund), där dricksvattnet tidigare varit kraftigt
dimetylarsenik). Högst var halten av dimetylarsenik. Pojkar hade högre totalhalter av arsenik än flickor.
Vi analyserade även en rad ftalatmetaboliter och fenolära ämnen i urin från deltagarna. Nästan alla (94100 procent) hade mätbara halter av ftalatmetaboliter och metaboliter till DiNCH (mjukgörare som används som ersättare till ftalater) i urinen. Högst halter fanns av monobutylftalat (MnBP), följt av monoetylftalat (MEP). Fenolära ämnen som kunde mätas i de flesta urinprover (mer än 90 procent) var bisfenol A och S, difenylfosfat (DPP, metabolit till ett fosforbaserat flamskyddsmedel),
trikloropyridinol (metabolit till insekticiden klorpyrifos) och 3-fenoxybensoesyra (metabolit till pyretroider, en grupp bekämpningsmedel). Triklosan var mätbart hos 81 procent av deltagarna. Halterna av ftalatmetaboliter, DPP och bisfenol S var något högre hos flickor än hos pojkar. De ftalatmetaboliter och fenolära ämnen som undersöktes är kortlivade och försvinner snabbt ur kroppen. Att de ändå kunde mätas i urin tyder på en kontinuerlig exponering.
Sammanfattningsvis kunde vi mäta föroreningar ur alla undersökta substansgrupper hos de flesta deltagare i Riksmaten ungdom 2016–17. Nivåerna var generellt jämförbara med nivåerna i andra studier och inom de intervall som kunde förväntas. Vi såg vissa köns- och åldersrelaterade skillnader i halter. Detta tyder på att det kan finnas skillnader i exponering, upptag eller eliminering mellan kön och åldersgrupper. Deltagarna var dock i olika tillväxtfaser och stadier av puberteten.
Att göra en fullständig värdering av riskerna med de halter som uppmätts ligger utanför syftet med denna rapport. För några substanser finns det dock föreslagna halter i människokroppen under vilka det är osannolikt med negativa hälsoeffekter. Detta gäller vissa PCB-varianter, PFOS, PFOA,
kvicksilver, bly, några ftalat- och DiNCH-metaboliter, bisfenol A samt triklosan. Våra resultat visar att de flesta svenska ungdomar har halter i sina kroppar som utifrån nuvarande kunskap sannolikt inte utgör någon risk för hälsan. Vissa individer hade emellertid högre halter av PFOS eller bly. Detta gällde framför allt bly. Där hade 7 procent av deltagarna blodhalter över Efsas referenspunkt för ökad risk för kronisk njursjukdom hos vuxna och 13 procent hade halter över referenspunkten för påverkan på hjärnans utveckling hos foster och små barn. Detta understryker vikten av att ytterligare minska exponeringen för bly från alla källor. Vi kan heller inte utesluta att det finns grupper i Sverige med högre exponering för kemiska föroreningar än deltagarna i Riksmaten ungdom 2016–17.
Halterna av föroreningar varierade mycket mellan de som deltog i undersökningen. För att kunna bedöma och hantera risker är det viktigt att undersöka möjliga orsaker till dessa variationer. Därför kommer Livsmedelsverket att fortsätta utvärdera data från Riksmaten ungdom 2016–17. Detta kommer vi att göra genom att studera samband mellan halter av kemiska föroreningar och faktorer som kost, sociodemografi och livsstil.
Summary
Dietary and biomonitoring data constitute an important scientific basis for risk and benefit assessments as well as for the development of risk management measures such as dietary advice, control
programmes and food regulations. The present report summarises the results from biomonitoring of contaminants in blood and urine from participants in the dietary survey Riksmaten ungdom 2016–17 (Riksmaten Adolescents 2016–17).
Riksmaten Adolescents 2016–17 is a nationally representative, cross-sectional, school-based dietary
survey of children and adolescents in grades 5 and 8, and high school grade 2 (approximately 11–12, 14–15 and 17–18 years of age). Representative schools across Sweden were invited to take part in the study. At the participating schools, all students in one or two classes were invited. The study
population of the present report was a subgroup of Riksmaten Adolescents 2016–17, from whom blood and urine were collected. Adolescents were recruited from schools between September 2016 and May 2017. Sixty-two (24%) of the 259 schools invited for blood and urine sampling participated. At these schools, 1,305 of the 2,377 invited students participated. Complete dietary information and valid blood and urine samples were available from 1,105 students (46%) and these were included in the analyses in this report. Fifty-six percent of the participants were girls. The distribution of participants between grades were as follows; grade 5: 30%, grade 8: 37%, and high school grade 2: 32%. The participating schools were distributed across Sweden’s seven Divisions of Occupational and Environmental Medicine (Gothenburg, Linköping, Lund, Stockholm, Umeå, Uppsala, and Örebro regions).
A wide range of contaminants were investigated in the collected blood and urine samples: substances the use of which has been restricted or banned but which continue to persist in the environment; substances that continue to be legally produced and used; and naturally occurring toxic metals and trace elements. The analysed substance groups included chlorinated and brominated persistent organic pollutants, per- and polyfluoroalkyl substances (PFAS), metals and metalloids, phthalate metabolites and phenolic substances (e.g. bisphenols and metabolites of some pesticides).
The chlorinated persistent organic pollutant with the highest concentration in serum was the DDT metabolite DDE, followed by PCB-153, hexachlorobenzene (HCB), PCB-138 and PCB-180. These three PCBs accounted for 70% of the total body burden of PCBs. Boys had higher serum
concentrations of most chlorinated persistent organic pollutants than girls. Concentrations of DDE and some of the PCBs were higher in older age groups.
Urinary arsenic was measured in a subsample of 123 participants. All participants had quantifiable urinary levels of inorganic arsenic or at least one of its two analysed metabolites (monomethylarsonic acid and dimethylarsinic acid). The highest concentration was observed for dimethylarsinic acid. Boys had higher urine concentrations of total arsenic than girls.
A number of phthalate metabolites and phenolic substances were analysed in urine from the
participants. Almost all samples (94–100%) had measurable concentrations of phthalate metabolites and metabolites of the alternative plasticizer DiNCH. Of the phthalate metabolites, the highest concentrations were observed for mono-butyl phthalate (MnBP), followed by monoethyl phthalate (MEP). The phenolic substances detected in most samples (>90%) were bisphenol A and S, diphenyl phosphate (DPP, metabolite of a phosphorus-based flame retardant), trichloropyridinol (metabolite of the insecticide chlorpyrifos) and 3-phenoxybenzoic acid (metabolite of pyrethroids, a group of pesticides). Triclosan was detected in 81% of the samples. Concentrations of phthalate metabolites, DPP and bisphenol S were higher in girls than in boys. All the metabolites and phenolic substances analysed in urine are rapidly metabolised and excreted from the body. The detection of these substances thus suggests continuous exposure.
In summary, contaminants from all investigated substance groups (i.e. chlorinated persistent organic pollutants, PFAS, metals and metalloids, and phthalates and phenolic compounds) could be quantified in samples from most participants in Riksmaten Adolescents 2016–17. However, the levels were generally comparable to levels found in other studies and within the expected ranges. Despite the heterogeneity of the study population, which represented a mix of individuals at different pubertal stages and growth phases, we found some gender- and age-related differences in contaminant concentrations. This suggests that there may be differences in exposure, uptake and/or elimination between genders and age groups.
Full risk assessments of the observed concentrations were beyond the scope of this report. However, for some PCBs, PFOS, PFOA, mercury, lead, some phthalate and DiNCH metabolites, bisphenol A and triclosan, concentrations in the human body have been proposed below which it is unlikely that these contaminants cause adverse health effects. Our results show that, based on current knowledge, the levels of these contaminants in most Swedish adolescents are not a health concern. However, some participants exhibited a higher exposure to PFOS or lead. This was especially pronounced for lead, where 7% and 13% of the participants had blood concentrations above the EFSA reference points for increased risk of chronic kidney disease in adults and developmental neurotoxicity in small children, respectively. This underlines the importance of further reducing lead exposure from all sources, not only food. Moreover, we cannot exclude that there are Swedish populations with a higher exposure to contaminants than the populations covered by Riksmaten Adolescents 2016–17.
There were substantial individual variations in the levels of the investigated contaminants among Swedish adolescents. For risk assessment and risk management purposes, it is important to explore possible causes of this variation. Therefore, the Swedish Food Agency will continue to evaluate data from Riksmaten Adolescents 2016–17 through further studies on the association between contaminant levels and factors such as diet, sociodemographics and lifestyle.
Introduction
Dietary data constitute an important scientific basis for risk and benefit assessments as well as for the development of risk management measures such as dietary advice, control programmes and food regulations. The Swedish Food Agency therefore regularly carries out national dietary surveys to gather information on dietary intake. The collected data are used to calculate nutrient and energy intake as well as to estimate exposure to unwanted substances via food, for example. In the most recent dietary surveys conducted by the Swedish Food Agency, Riksmaten Adults 2010–11 and
Riksmaten Adolescents 2016–17, the collection of dietary data was supplemented by taking blood and
urine samples in participant subgroups for analysis of markers for nutritional status and contaminants. Biomonitoring data are important for assessing nutritional status and human exposure to contaminants that could negatively affect health.
In this report, we summarise results from the biomonitoring of contaminants in blood and urine from participants in the dietary survey Riksmaten Adolescents 2016–17. Differences in concentrations of contaminants in adolescents in different geographical regions and age groups (school grades) and by gender are investigated. More in-depth statistical analyses of other factors that may influence exposure, e.g. food consumption, life-style and socioeconomic factors, will be performed later. The following substance groups were analysed in samples from the participants in Riksmaten Adolescents
2016–17: chlorinated and brominated persistent organic pollutants (POPs), per- and polyfluoroalkyl
substances (PFAS), metals and metalloids, phthalate metabolites, and phenolic substances (e.g. bisphenols and metabolites of some pesticides).
To the best of our knowledge, Riksmaten Adolescents 2016–17 is to date the largest nationally
representative study on diet and body burden of contaminants in Swedish adolescents. The studied population is of particular interest because children and adolescents are more sensitive to
environmental chemical exposure than adults. Exposure during early life may have unpredictable adverse health effects later in life [1]. For example, it has been shown that exposure to some chemicals during gestation, infancy or childhood may increase the risk of neurodevelopmental disorders and obesity [2]. Examples of such chemicals include polychlorinated biphenyls (PCBs),
hexachlorobenzene (HCB), 1,1-bis-(4-chlorophenyl)-2,2,2-trichlorethane (DDT), bisphenol A (BPA), phthalates, triclosan, PFAS and heavy metals [2-4].
epidemiological studies with background exposure [7-9]. Early life stages, i.e. the fetus, infant and child, are most sensitive to exposure [10]. Exposure to PCBs, HCB and the DDT metabolite p,p'-DDE
(1,1-dichloro-2,2-bis(4-chlorophenyl)ethane) has also been associated with an increased risk of obesity [11], type 2 diabetes [12], hypertension [13, 14] and all-cause mortality [15]. Exposure to chlorinated and brominated POPs is therefore of great concern, especially during adolescence, a period of growth and development. Many of these substances are listed in the global Stockholm Convention; their use is strictly regulated, and some are no longer in production.
Overall, human biomonitoring studies have demonstrated decreasing levels of many chlorinated and brominated POPs. In Sweden, the levels of PCBs, dioxins and p,p'-DDE in breast milk have decreased by at least 70% since the 1970s [16]. In addition, a study of first-time mothers conducted by the Swedish Food Agency (POPUP, Persistent Organic Pollutants in Uppsala primiparas) shows decreasing levels of PCBs, dioxins, chlorinated pesticides and polybrominated diphenyl ethers
(PBDEs) in breast milk and serum between 1996 and 2016 [17, 18]. Nøst et al. [19] have also reported a decrease in the levels of chlorinated pesticides and PCBs in 30-year-old Norwegian men and women from 1986 to 2007.
PCBs are a group of anthropogenic POPs that were produced for decades before they were banned in
the 1970s and 1980s because of their harmful effect on the environment and human health [20]. However, because of their resistance to degradation, PCBs are still present in the environment. PCBs are lipophilic and easily bioconcentrated and biomagnified in the food chain. There are 209 different PCB congeners with different numbers and positions of the chlorine atoms and thus different
biological activities. These congeners are divided into 12 dioxin-like and 197 non-dioxin-like PCBs. Food, especially food of animal origin, is the main source of human exposure to PCBs [21, 22]. In Sweden, fatty fish from the Baltic Sea has been recognized for a long time as an important source of exposure to PCBs [23, 24]. Vegetables can also be a source of PCB exposure [25], but they mainly contribute to exposure to lower chlorinated congeners with shorter half-lives and faster metabolism. Some exposure may be derived from air [26] and from house dust [27].
The European Food Safety Authority (EFSA) has established a tolerable weekly intake (TWI) for dioxins and dioxin-like PCBs of 2 pg toxic equivalents/kg body weight (bw) [28]. The TWI value indicates the weekly dose that can be consumed over the course of a lifetime without adverse health effects in humans. The TWI for dioxins and dioxin-like PCBs was based on effects on semen quality in an epidemiological study. No health-based tolerable intake level has been established for non-dioxin-like PCBs. However, based on liver and thyroid effects, EFSA estimated that 500 µg/kg is a conservative NOAEL (no observed adverse effect level) body burden for total non-dioxin-like PCBs [29]. NOAEL is the highest level that does not cause an adverse health effect in the most sensitive species. The German Human Biomonitoring Commission has estimated that there is no risk of adverse health effects of non-dioxin-like PCBs at serum levels (sum of PCB 138, PCB 153 and PCB 180 multiplied by 2) at or below 3.5 µg/L and that adverse health effects are possible above 7 µg/L [30]. These values are based on benchmark doses from epidemiological studies of prenatal exposure and cognitive effects [31].
Chlorinated pesticides, e.g. DDT and chlordanes, have been widely used as insecticides.
Additionally, DDT is used in malaria control. In the environment, DDT is mainly degraded to p,p'-DDE, which is more persistent than the parent compound. HCB has been widely used as a fungicide for control of mould and fungi in cereal grains. HCB is also formed unintentionally as a contaminant
in chemical and combustion processes [20]. The use of these pesticides has been banned in Sweden for decades. However, due to their stability, high volume production, long-time use and long-range atmospheric transport they continue to be spread in the environment and are found in both wildlife and humans [32]. According to the Swedish Market Basket Survey 2015, fish consumption is the largest contributor to the total intake of p,p'-DDE followed by dairy and meat products. For HCB, dairy products are the largest contributor to exposure, followed by fish and meat [22].
The World Health Organisation (WHO) has proposed a health-based guidance value for HCB intake of 160 ng/kg bw/day, based on animal studies on cancer [33]. For DDT compounds, a provisional acceptable daily intake of 10 μg/kg bw has been established based on developmental toxicity in rats [34]. Based on the Swedish Market Basket Survey 2015, the average per capita intake of HCB and DDT compounds in the Swedish population are 100-1,000 times lower than these guidance values [22].
Brominated flame retardants (BFRs) are a diverse group of chemicals that are used to increase fire
resistance in various materials. Polybrominated diphenylethers (PBDEs) and HBCDD
(hexabromocyclododecane) are additive BFRs that have been used since the 1970s in goods such as plastics, textiles and electronic products [35]. Both PBDEs and HBCDD are toxic to the liver and affect thyroid hormone homeostasis and the reproductive and nervous systems [36, 37]. Due to their toxic properties and persistence, the use of PBDEs and HBCDD has been regulated within the EU since the beginning of the 2000s. Fish, meat, fats, egg and dairy products are the major contributors of PBDEs and HBCDD in the diet [22]. According to EFSA, dietary intake of PBDEs and HBCDD is unlikely to be a significant health concern [36, 37]. Moreover, total per capita intake of PBDEs and HBCDD decreased during the period 1999-2015 [22]. Similarly, the concentration of many PBDEs and HBCDD decreased in serum from Swedish first-time mothers between 1996 and 2017 [18]. Many emerging BFRs have been introduced on the market as substitute chemicals for PBDEs and HBCDD, e.g. BTBPE (2-bis(2,4,6-tribromophenoxy) ethane), DBDPE (decabromodiphenylethane), PBEB (pentabromoethylbenzene) and HBB (hexabromobenzene). Knowledge on emerging BFRs is limited.
Per- and polyfluoroalkyl substances
Per- and polyfluoroalkyl substances (PFAS) comprise a large group of synthetic substances that have been produced and used in a wide variety of products and applications due to their unique chemistry such as surface activity and resistance to chemical and biological degradation [38, 39]. Some PFAS (perfluorooctane sulfonate [PFOS] and perfluorooctanoate [PFOA]) are highly resistant to both physical and microbiological degradation [40] and are persistent in the environment, thus fulfilling international POP criteria [41]. However, in contrast to the classical POPs described above, the
Another possible effect of PFOS is poor serum antibody response to vaccinations in children [41]. Some PFAS have been associated with metabolic disorders, although the number of human studies is insufficient to draw any reliable conclusion [50].
Food and contaminated drinking water are important sources of human exposure to PFAS in Sweden and other countries [51-54]. PFAS have already caused undesirable consequences for public drinking water supplies in Sweden [55]. There have been a number of cases of PFAS contamination of drinking water and some wells have been closed due to elevated PFAS levels in both raw and produced
drinking water. Careful monitoring of PFAS in drinking water is ongoing. Use of PFAS-containing products may also contribute to exposure through the indoor environment (dust and air) [48, 56]. Humans can in addition be exposed to PFAS through occupational exposure [57].
A recent preliminary risk assessment of PFOS and PFOA concluded that a substantial proportion of the European population exceeds the proposed TWIs of 13 ng/kg bw for PFOS and 6 ng/kg bw for PFOA [41]. The TWI for PFOS was based on increased serum cholesterol levels at a benchmark dose (BMDL5) of 21–25 ng/mL in plasma in adults and a decreased antibody response after vaccination at a BMDL5 of 10.5 ng/mL in 5-year-old children. The TWI for PFOA was based on increased serum cholesterol levels at a benchmark dose (BMDL5) of 9.2–9.4 ng/mL in plasma/serum. According to the Swedish Market Basket Survey 2015 [22], the average per capita intake of PFOS and PFOA was highly unlikely to exceed the TWIs suggested by EFSA [41]. However, this survey did not consider the intake from drinking water which, if the drinking water is contaminated, is an important source of exposure. Recent biomonitoring studies in Sweden suggest that human exposure to PFOS and PFOA has decreased [58, 59], likely due to the phase-out of production and use of PFOA and related substances [60].
Metals and metalloids
Metals are abundant in the environment as a result of both anthropogenic and natural activities. Many metals are essential for humans and have important physiological functions. Essential metals are for example copper (Cu), zinc (Zn), iron (Fe) and manganese (Mn). Some metals and metalloids such as cadmium (Cd), mercury (Hg), lead (Pb) and arsenic (As) are non-essential and are regarded as toxic for biota, including humans. Metals can be present at various levels in the environment, e.g. the soil, water and atmosphere. Humans may be exposed to metals from the environment or by ingestion of contaminated food or water.
Cadmium (Cd) is found in the environment occurring both naturally and from industrial and
agricultural use. Health effects from long-term exposure to Cd include renal dysfunction and
osteoporosis [61]. Cd exposure may also be related to some forms of cancer [62]. The current TWI for Cd, 2.5 μg/kg bw, is based on epidemiological studies on the relationship between urinary Cd and a biomarker of renal tubular effects [63]. For non-smokers, food is the main source of exposure to Cd with cereals, vegetables and potatoes being the main contributors [22, 64]. Residents in locations with high Cd pollution have increased Cd levels in blood and urine, which are mainly explained by
consumption of locally grown vegetables and contaminated water [65]. The intestinal absorption of Cd can be affected by dietary intake of essential minerals (iron, calcium, zinc, copper) and protein [66].
Mercury (Hg) exists in the environment in inorganic or organic forms. The organic form,
system is developing, is particularly sensitive to MeHg exposure. MeHg can accumulate in fish, shellfish and sea mammals and fish is the main contributor to Hg exposure from the diet [22]. High concentrations of MeHg may be found in fresh-water fish from contaminated lakes (perch, pike, pikeperch, burbot) and in large predatory fish species such as tuna, swordfish, Atlantic halibut, shark and ray. Therefore, the Swedish Food Agency recommends that women who are planning to get pregnant, are pregnant or nursing limit their consumption of such fish species to 2-3 portions per year. In Swedish adults, the concentrations of Hg were positively related to fish intake (in particular, shellfish and saltwater fish) [67]. EFSA [68] established a TWI for inorganic Hg of 4 μg/kg bw, and for MeHg of 1.3 μg/kg bw. The German Human Biomonitoring Commission has estimated that there is no risk of adverse health effects of Hg at concentrations in whole blood below 5 µg/L, whereas adverse health effects are possible at concentrations above 15 µg/L [30].
Lead (Pb) is a naturally occurring toxic metal found in the Earth's crust. Pb-containing gasoline was a
source of environmental and human exposure to organic Pb components for many decades [69]. Because of its toxicity, this gasoline was gradually phased out in many countries during the 1990s. Pb can adversely affect the central nervous system in developing infants [70]. Pb may also affect blood pressure, reproductive and kidney function, and cause mutagenesis. Children are more vulnerable to Pb toxicity than adults, especially for neurological toxicity [71]. EFSA (2010) established a reference point of 12 μg/L of Pb in blood for developmental neurotoxicity and a reference point of 15 µg/L for an effect on the prevalence of chronic kidney disease in adults [72]. Humans are exposed to Pb via food, drinking water and air [73]. According to the Swedish Market Basket Survey 2015, Pb is measurable in all food categories with the main contributors to intake being the mixed category ‘sugar and sweets’ (including sauces and dressings), cereal products, vegetables, fruits and beverages [22]. Several studies have shown that in the Swedish population blood levels of Pb have decreased since the 1970s due to a gradual reduction of lead in petrol [74-76].
Chromium (Cr) is ubiquitous in the diet and found in meat and meat products, oils and fats, breads
and cereals, fish, pulses and spices [77]. Cr in food is mostly trivalent and, due to poor absorption, trivalent Cr compounds have low toxicity after oral exposure [78]. EFSA derived a tolerable daily intake (TDI) of 300 μg trivalent Cr/kg bw and concluded that the mean dietary exposure levels in Europe are well below the TDI [77]. It was previously believed that trivalent Cr is involved in regulating carbohydrate and lipid metabolism by improving insulin responsiveness [79]. However, in 2014, EFSA questioned the essentiality of trivalent Cr for humans because of the lack of convincing evidence [77].
Manganese (Mn) is an essential mineral necessary for normal growth and development, particularly
al. [84] discussed adverse health effects of high Co concentrations such as cardiomyopathy, vision or hearing impairment, reversible hypothyroidism and polycythaemia. However, these effects are unlikely to occur at Co levels below 300 μg/L in whole blood [85]. According to the Swedish Market Basket Survey 2015, the estimated daily intake of Co was 11 µg per person per day [22].
Nickel (Ni) is not essential for humans. According to EFSA, Ni in food can induce eczematous skin
reactions among nickel-sensitized individuals and can affect reproduction and development in experimental animals [86]. Diet is likely the most important source of Ni exposure in the general population. Based on reproductive and developmental effects in experimental animals, EFSA [86] derived a TDI for Ni of 2.8 µg/kg bw. According to the Swedish Market Basket Survey 2015 [22], the average per capita intake of Ni from food (1.7 μg/kg bw) is below this TDI. The TDI may not be sufficiently protective for individuals sensitized to Ni since it has been reported that individuals with allergic contact dermatitis may develop eczematous skin reactions from oral exposure to nickel salts [86]. The current TDI for Ni has been questioned and a new evaluation is in progress.
Aluminium (Al) occurs naturally in the air, water and soil as a result of weathering of rocks and
volcanic activity. Mining and processing Al also contribute to Al release into the environment. The general population is primarily exposed to Al from food, although minor exposure may occur from drinking water and inhalation of air [87]. Only a small portion of the ingested Al is absorbed. EFSA established a TWI for Al of 1 mg/kg bw [88]. According to the Swedish Market Basket Survey 2015 [22], the average per capita intake of Al in Sweden is 16 μg/kg bw/day or 0.11 mg/kg bw/week.
Arsenic (As) is a metalloid naturally present in the bedrock. It can be released by smelter operations
and fossil-fuel combustion [89]. The toxicity of As depends on chemical structure. In its inorganic form (inorganic As, arsenite AsIII and arsenate AsV) As is highly toxic. As can also occur in organic forms (e.g. arsenobetaine (AB) and arsenosugars) that are supposed to be less harmful to health [90]. In aquatic environments, inorganic As is transformed to a range of organic metabolites, which are then found in tissues of aquatic species [91]. Inorganic As is mainly found in drinking water and enters the food chain through plant crops which absorb it from water and soils. EFSA reported that the main contributor to dietary exposure to inorganic As was the food group ‘grain-based processed products (non rice-based)’, in particular wheat bread and rolls [92]. Similarly, the Swedish Market Basket Survey 2015 demonstrated that cereals were the major contributor to exposure to inorganic As, although fish was the main contributor to total As [22, 93]. Rice is one of the foods that contains the highest concentrations of inorganic As, as well as some organic As [94]. The main adverse effects associated with long-term ingestion of inorganic As in humans are skin lesions, cancer, cardiovascular disease, developmental toxicity, neurotoxicity, abnormal glucose metabolism, and diabetes [95]. Neurotoxicity is mainly reported after acute exposure [95]. Exposure to As over many years can also increase the risk of some cancers, e.g. in lungs or bladder [96]. Epidemiological studies indicate that children may be more sensitive to inorganic As than adults [97]. In the human body inorganic As is metabolised to monomethylarsonic acid (MMA), which is further methylated to dimethylarsinic acid (DMA). From key epidemiological studies, EFSA has identified benchmark doses (BMDL01) between 0.3 and 8 μg inorganic As/kg bw per day for cancer of the lung, skin and bladder as well as skin lesions [95]. According to the Swedish Market Basket Survey 2015, the estimated average dietary exposure to inorganic As in Sweden is 0.033 μg/kg bw/day, which is below this range [22].
Phthalate metabolites and phenolic compounds
Phthalates (diesters of phthalic acid) are a family of man-made chemical compounds used as
plasticizers, solvents and additives in many industrial and personal care products. They continuously leach from products leading to contamination of food and environments, and to human exposure. Phthalates are commonly used in food packaging materials and can be released from packaging to food.
Phthalates have a short elimination half-life (estimated half-life of various phthalate metabolites is approximately 4 to 25 h); they are rapidly metabolised and excreted in urine [98]. Several phthalates are included on the EU candidate list of substances of very high concern due to reproductive toxicity. Five of these phthalates (dicyclohexyl phthalate, DCHP; di-ethylhexyl phthalate, DEHP; di-n-butyl phthalate, DnBP; benzyl butyl phthalate, BBP; diisobutyl phthalate, DIBP) are also classified as endocrine disruptors [99]. Due to their toxic properties, the use of phthalates has been restricted in toys and childcare articles in the EU since 2007. The use of some phthalates has therefore been or is being phased out and substituted with new chemicals with a similar function. For example, di-iso-nonyl
cyclohexane-1,2-dicarboxylate (DiNCH) was introduced on the European market in 2002 to replace
DEHP and other high-molecular weight phthalates in polyvinyl chloride (PVC) [100]. DiNCH rapidly became one of the most used non-phthalate plasticizers in Sweden [101]. Dietary sources are
considered the major exposure route, although DiNCH also has been found in dust [102, 103]. In epidemiological studies, some phthalates are suspected to have long-term endocrine or neurotoxic effects on human health [104-106]. The German Human Biomonitoring Commission has estimated urine concentrations of some phthalate and DiNCH metabolites below which, according to current knowledge, there is no risk of adverse health effects [30]. Such concentrations are available for e.g. DEHP metabolites (sum of 5-MEHP and 5oxo-MEHP) and DiNCH metabolites (sum of OH-MINCH and cx-OH-MINCH) and are based on TDIs from risk assessments or from NOAEL values from critical animal studies.
Phosphorous flame retardants are used in a wide variety of consumer products. To a certain extent
they replace brominated flame retardants that have been legislatively restricted and phased out. Triphenyl phosphate is an organophosphate ester used both as a flame retardant and plasticizer, and has been applied to polyurethane foam, resins, PVC, hydraulic fluids, lacquers, and nail polish [107]. Humans may be exposed to phosphorous flame retardants via dermal contact, diet and dust. A recent Swedish study on residues of phosphorus flame retardants in food reported that average per capita intakes are lower than health-based reference doses and that cereals, pastries, sugar/sweets and beverages are the main contributors to the total intake [108].
dietary sources, and more studies are needed to address these uncertainties [111]. The German Human Biomonitoring Commission has estimated that there is no risk of adverse health effects from BPA below urine levels of 0.1 mg/L in children and 0.2 mg/L in adults [30].
Polycyclic aromatic hydrocarbons (PAH) are formed during combustion processes and are found in
complex mixtures in the environment, including foods. Among non-smokers, the main sources of human exposure are food and polluted air. The levels of PAH are especially high in smoked and grilled foods [112]. The Swedish Market Basket Survey 2015 [22] indicated that the estimated PAH intake from food has decreased during the last fifteen years. A possible explanation for this is improved production processes. As PAH are carcinogenic, the levels in food should be as low as possible as should be human exposure [112].
Organophosphate and pyrethroid insecticides are used in agriculture worldwide. These compounds
were substitutes for organochlorine insecticides because of their higher susceptibility to environmental degradation. However, exposure to the organophosphate insecticide chlorpyrifos and pyrethroids may be associated with adverse central nervous system outcomes and developmental neurotoxicity [113-115]. In Sweden, no pesticide containing organophosphates has been approved since about 2010, and the use of pyrethroids has been restricted. Thus, exposure to residues of organophosphate and
pyrethroid insecticides in the Swedish population occurs mainly from consumption of imported fruits and vegetables.
Phenolic substances such as triclosan (TCS, antibacterial agent), 3-tert-butyl-4-hydroxyanisole (BHA) and benzophenone-3 (BP-3, UV filter) are ingredients in cosmetic and personal care products. BHA is also used as an antioxidant and preservative in food. The use of these ingredients is of concern due to their potential side effects on human health. For example, animal in vivo and in vitro studies have shown that TCS and BHA adversely affect endocrine function and thyroid hormone homeostasis [116-118]. The German Human Biomonitoring Commission has estimated that there is no risk of adverse health effects of TCS at urine concentretions below 2000 ng/mL in children [30].
Aim
The aim of the present study was to estimate exposure to several contaminants in Swedish adolescents by analysing blood and urine concentrations in samples from participants in the national dietary survey
Riksmaten Adolescents 2016–17. Examined contaminants included chlorinated and brominated POPs,
PFASs, metals and metalloids, phthalate metabolites and phenolic compounds. Furthermore, we aimed to evaluate associations between blood/urine concentrations of contaminants and age, gender and geographical location.
Materials and methods
Study population
The study population for the present report was a subgroup of Riksmaten Adolescents 2016–17, from whom blood and urine was collected. Riksmaten Adolescents 2016–17 is a nationally representative,
cross-sectional, school-based dietary survey of children and adolescents. Details of the study design and sampling procedures are described elsewhere [119]. Briefly, students in grade 5, grade 8 and 2nd year of high school (referred to in the report as grade 11) were recruited from schools between September 2016 and May 2017. The survey included a web-based dietary assessment method, web questionnaires, weight and height measurements and physical activity assessment using
accelerometers.
In the main study, 601 schools (approximately 200 from each school grade) were selected by Statistics Sweden (SCB) to represent Swedish students in the three age groups. Selection was based on
geographical area, type of municipality as classified by the Swedish Association of Local Authorities and Regions, type of school (independent school with public funding or public), and size of school. Exclusion criteria were schools with fewer than 10 students in a school grade and high schools with only language introduction classes. Approximately 40% of the schools (n=259) were randomly selected for blood and urine sampling.
Schools were invited to participate through emails addressed to the principal. The email invitations were followed-up by telephone calls. To include equal numbers of participants from each school grade, recruitment was rotated between the grades. One or two classes were included from each school and when the desired number of classes in a school grade had been recruited, no further schools in that school grade were contacted. To achieve an even distribution over the year from different areas of Sweden, schools were recruited both in the spring and in the autumn in all the regions.
Names and addresses of students in the included classes were collected from the schools, and letters with information about the study and its aims were sent out to students’ legal guardians approximately 3 weeks before the school visit. For schools with blood and urine sampling, consent forms for all students, and guardians of children younger than 16 years were included in the letters. Prior to the data collection, the class teacher was asked to show a short information film to the students. Written consent was collected by teachers and provided to the research team on the day of the school visit. An outline of the recruitment of participants is presented in Figure 1. Of the 259 schools selected for blood and urine sampling, 62 (24%) participated, 79 (31%) declined participation, 7 (3%) were excluded and 111 (43%) were not contacted by phone as the desired number of classes had been reached. In total, 1,305 of the 2,377 invited students participated and complete dietary information and valid blood and urine samples were available from 1,105 students (46%). Ethical approval for the study was obtained from the Regional Ethical Review Board in Uppsala (No. 2015/190). Written informed consent was obtained from all participants their guardians if younger than 16 years.
Figure 1. Overview flow diagram of participants in the main study and the biomonitoring subgroup of Riksmaten Adolescents 2016–17. *Schools were excluded if there were <10 students in a grade or they only taught language introduction.
Data collection
School visits
Field staff from the Swedish Food Agency planned and coordinated the school visits. They also visited the classes during school hours and instructed the students on how to record their diet, complete the on-line questionnaires and how to wear the accelerometer for the physical activity assessment. Trained staff from the regional Occupational and Environmental Medicine Divisions (AMM) in Gothenburg, Linköping, Lund, Stockholm and Umeå collected the blood and urine samples (Figure 2). The AMM clinic in Linköping also carried out the sample collection in the regions of Örebro and Uppsala. At the school visit, the students recorded their dietary intake and completed the on-line questionnaires. The students were also instructed to ask their parents to complete one on-line questionnaire later at home and also to record another diet day at home. Non-fasting blood and spot urine samples were
Figure 2. Regions and capitals of Occupational and Environmental Medicine Divisions (AMM) in Sweden.
Sample handling and storage
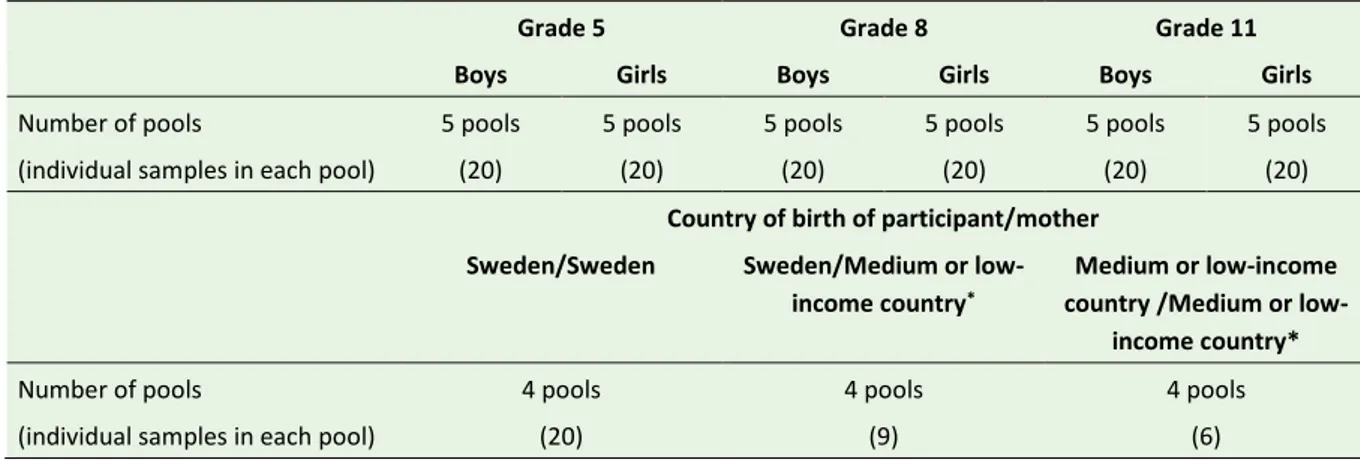
When a region had completed sampling in all schools, the samples were transported to the Swedish Food Agency and then stored at -80°C until they were distributed to various laboratories for analysis of contaminants. The concentration of contaminants was determined using either individual samples or pooled samples. Pooled samples of blood serum and urine were used for analyses of brominated flame retardants and arsenic. Thirty pools were constructed according to participant gender and grade (Table 1). Additionally, 12 pools were constructed according to income level in the birth country [120] of the participants and their mothers.
Variables in this report
Region and municipality were defined according to the location of the school. Regions were classified according to the area of the AMM clinics (Figure 2). Each region included 4–10 counties as specified in Table 6. Type of municipality was classified according to the Swedish Association of Local Authorities and Regions 2017 [121].
Information on age, gender, parental education and birth country was derived from the on-line
questionnaires. Parental education was determined as the highest attained education level of either the mother or the father. Birth country of the participant and both parents were recorded in text and then coded as Nordic country or non-Nordic. Birth region was defined as Nordic if (1) the participant was
born in a Nordic country and at least one parent was born in a Nordic country or (2) the child was born outside the Nordic countries but both parents were born in the Nordic countries.
Body mass index was calculated (kg/m2) and weight status was determined using the IOTF
(International Obesity Task Force) cut-offs. For participants 18 years and above, the WHO cut-offs for weight status were used [122].
Table 1. Description of pooled samples from Riksmaten Adolescents 2016–17 used for analyses of brominated flame
retardants and arsenic species.
Grade 5 Grade 8 Grade 11 Boys Girls Boys Girls Boys Girls
Number of pools
(individual samples in each pool)
5 pools (20) 5 pools (20) 5 pools (20) 5 pools (20) 5 pools (20) 5 pools (20)
Country of birth of participant/mother Sweden/Sweden Sweden/Medium or low-
income country*
Medium or low-income country /Medium or low-
income country*
Number of pools
(individual samples in each pool)
4 pools (20) 4 pools (9) 4 pools (6)
*Classification based on UN, 2014.
Analytical methods
Detailed descriptions of the analytical methods are provided in Appendix 1.
Chlorinated and brominated persistent organic pollutants
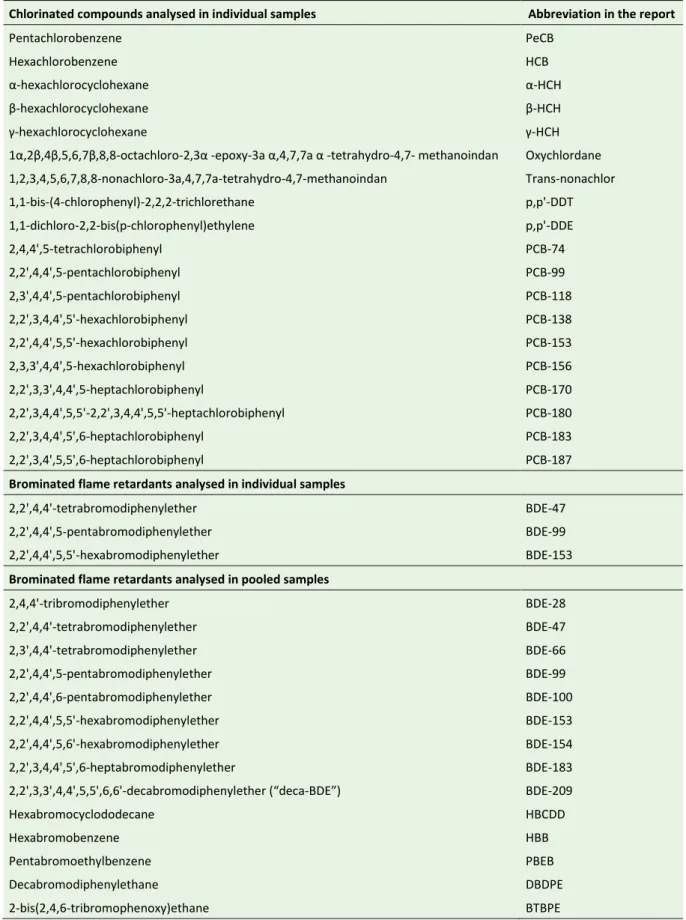
The analyses of chlorinated and brominated POPs (Table 2) in individual serum samples were performed by the Finnish National Institute for Health and Welfare, Department of Health Security (Appendix A1.1). The method used has been described previously [123]. In brief, concentrations were measured using gas chromatography - triple quadrupole mass spectrometry (GC-MS/MS). The instrument used was an Agilent 7010 GC-MS/MS system (Wilmington, DE, U.S.), GC column DB-5MS UI (J&W Scientific, 20m, ID 0.18 mm, 0.18 μm). Limits of quantification (LOQ) ranged from 5 pg/mL for PCB congeners and trans-nonachlor to 40 pg/mL for p,p'-DDE. Two blank samples and two control samples (NIST SRM 1958) were included in each batch of samples. Measured concentrations of chlorinated and brominated POPs in SRM1958 were 80-105% of the certified/reference
Table 2. Chlorinated and brominated persistent organic pollutants analysed in serum samples from Riksmaten Adolescents 2016–17.
Chlorinated compounds analysed in individual samples Abbreviation in the report
Pentachlorobenzene PeCB
Hexachlorobenzene HCB
α-hexachlorocyclohexane α-HCH
β-hexachlorocyclohexane β-HCH
γ-hexachlorocyclohexane γ-HCH
1α,2β,4β,5,6,7β,8,8-octachloro-2,3α -epoxy-3a α,4,7,7a α -tetrahydro-4,7- methanoindan Oxychlordane 1,2,3,4,5,6,7,8,8-nonachloro-3a,4,7,7a-tetrahydro-4,7-methanoindan Trans-nonachlor 1,1-bis-(4-chlorophenyl)-2,2,2-trichlorethane p,p'-DDT 1,1-dichloro-2,2-bis(p-chlorophenyl)ethylene p,p'-DDE 2,4,4',5-tetrachlorobiphenyl PCB-74 2,2',4,4',5-pentachlorobiphenyl PCB-99 2,3',4,4',5-pentachlorobiphenyl PCB-118 2,2',3,4,4',5'-hexachlorobiphenyl PCB-138 2,2',4,4',5,5'-hexachlorobiphenyl PCB-153 2,3,3',4,4',5-hexachlorobiphenyl PCB-156 2,2',3,3',4,4',5-heptachlorobiphenyl PCB-170 2,2',3,4,4',5,5'-2,2',3,4,4',5,5'-heptachlorobiphenyl PCB-180 2,2',3,4,4',5',6-heptachlorobiphenyl PCB-183 2,2',3,4',5,5',6-heptachlorobiphenyl PCB-187
Brominated flame retardants analysed in individual samples
2,2',4,4'-tetrabromodiphenylether BDE-47
2,2',4,4',5-pentabromodiphenylether BDE-99
2,2',4,4',5,5'-hexabromodiphenylether BDE-153
Brominated flame retardants analysed in pooled samples
2,4,4'-tribromodiphenylether BDE-28 2,2',4,4'-tetrabromodiphenylether BDE-47 2,3',4,4'-tetrabromodiphenylether BDE-66 2,2',4,4',5-pentabromodiphenylether BDE-99 2,2',4,4',6-pentabromodiphenylether BDE-100 2,2',4,4',5,5'-hexabromodiphenylether BDE-153 2,2',4,4',5,6'-hexabromodiphenylether BDE-154 2,2',3,4,4',5',6-heptabromodiphenylether BDE-183
2,2',3,3',4,4',5,5',6,6'-decabromodiphenylether (“deca-BDE”) BDE-209
Hexabromocyclododecane HBCDD
Hexabromobenzene HBB
Pentabromoethylbenzene PBEB
Decabromodiphenylethane DBDPE
Per- and polyfluoroalkyl substances
PFAS analyses in serum samples were performed at the Department of Environmental Science and Analytical Chemistry (ACES), Stockholm University (Appendix A1.3). Full names and abbreviations of PFAS in this study are provided in Table 3 and Table 4. Sample extraction was carried out using a method adapted from Powley et al. [124]. The samples were analysed using a Waters Acquity ultra performance liquid chromatograph (UPLC) coupled to a Waters Xevo TQS triple quadrupole mass spectrometer. The mass spectrometer was operated in negative electrospray ionisation, multiple reaction monitoring (MRM) mode. Quantification was based on isotope dilution. LOQs are summarized in Table 12 and Table 13.
Table 3. PFAS analysed in serum samples from Riksmaten Adolescents 2016–17.
Compound Abbreviation in the report
Perfluorohexanoic acid PFHxA Perfluoroheptanoic acid PFHpA Perfluorooctanoic acid, linear isomer lin-PFOA Perfluorooctanoic acid, branched isomer br-PFOA Perfluorononanoic acid PFNA Perfluorodecanoic acid PFDA Perfluoroundecanoic acid PFUnDA Perfluorododecanoic acid PFDoDA Perfluorotridecanoic acid PFTriDA Perfluorotetradecanoic acid PFTeDa Perfluoropentadecanoic acid PFPeDA Perfluorohexadecanoic acid PFHxDA Perfluorooctadecanoic acid PFOcDA Perfluorobutane sulfonic acid PFBS Perfluoropentane sulfonic acid PFPeS Perfluorohexane sulfonic acid, linear isomer lin-PFHxS Perfluorohexane sulfonic acid, branched isomer br-PFHxS Perfluoroheptane sulfonic acid PFHpS Perfluorooctane sulfonic acid, linear isomer lin-PFOS Perfluorooctane sulfonic acid, branched isomer br-PFOS
Table 4. Extra target PFAS analysed in serum samples from Riksmaten Adolescents 2016–17.
Compound Abbreviation in the report
Perfluorononane sulfonic acid PFNS Perfluorodecane sulfonic acid, linear isomer lin-PFDS Perfluorodecane sulfonic acid, branched isomer br-PFDS Perfluoroundecane sulfonic acid PFUnDS Perfluorooctane sulfonamide, linear isomer lin-FOSA Perfluorooctane sulfonamide, branched isomer br-FOSA Perfluorooctane sulfonamidoacetic acid, linear isomer lin-FOSAA Perfluorooctane sulfonamidoacetic acid, branched isomer br-FOSAA N-methylperfluorooctansulfonamide acetic acid, linear isomer lin-MeFOSAA N-methylperfluorooctansulfonamide acetic acid, branched isomer br-MeFOSAA N-Ethyl Perfluorooctane sulfonamidoacetic acid, linear isomer lin-EtFOSAA N-Ethyl Perfluorooctane sulfonamidoacetic acid, branched isomer br-EtFOSAA 9-chlorohexadecafluoro-3-oxanonane-1-sulfonic acid 9Cl-PF3ONS 11-chloroeicosafluoro-3-oxanonane-1-sulfonic acid 11Cl-PF3OUdS Ammonium 4,8-dioxa-3H-perfluorononanoate ADONA 2,3,3,3-tetrafluoro-2-(heptafluoropropoxy)propionic acid HFPO-DA 3:3 Fluorotelomer carboxylic acid 3:3 FTCA 5:3 fluorotelomer carboxylic acid 5:3 FTCA 7:3 fluorotelomer carboxylic acid 7:3 FTCA 1H,1H,2H,2H-perfluorohexane sulfonate 4:2 FTSA 1H,1H,2H,2H-perfluorooctane sulfonate 6:2 FTSA 1H,1H,2H,2H-perfluorodecane sulfonate 8:2 FTSA 6:2 Fluorotelomer phosphate diester 6:2 diPAP 8:2 Fluorotelomer phosphate diester 8:2 diPAP 6:2/8:2 Fluorotelomer phosphate diester 6:2/8:2 diPAP
Metals and metalloids
Analyses of Pb, Cd, Hg, Cr, Mn, Co and Ni in whole blood and Al in serum were performed at the division of Occupational and Environmental Medicine, Lund University (Appendix A1.4). The samples were treated as previously described [125]. The concentrations were determined by
inductively coupled plasma mass spectrometry (ICP-MS; iCAP Q, Thermo Fisher Scientific, Bremen, GmbH) equipped with collision cell with kinetic energy discrimination and helium as collision gas. The limit of detection (LOD) varied from 0.05 to 5.0 µg/L. Method precision varied from 2.8 to 15% depending on analyte.
Levels of total arsenic and arsenic species were determined in 123 individual urine samples and in 42 pooled urine samples at the Swedish Food Agency (Appendix A1.4). The As species determined were: inorganic As (sum of arsenite and arsenate) and the organic As species dimethyl arsenate (DMA), monomethyl arsonate (MMA) and arsenobetain (AB). Levels of inorganic As and MMA were
determined according to the European standard for inorganic As based on anion-exchange MS [126], and levels of DMA and AB according to a method based on cation–exchange HPLC-ICP-MS [127]. Total arsenic was determined by ICP-HPLC-ICP-MS according to the European Standard for total As [128]. The methods for total As, inorganic As and MMA are accredited by SWEDAC (Sweden’s national accreditation body). An Agilent 7700x ICP-MS was used in all three methods. The LOD values were 0.2 µg/kg for inorganic As and MMA, 0.4 μg/kg for DMA and AB, and 2.2 µg/kg for total As. The expanded uncertainty was ±34% for inorganic As and MMA, and ±20% for total As, DMA and AB. Relative standard deviations (RSD) for analysis of the urine certified reference materials (NIST 2669 Arsenic species in frozen human urine Level 1 and 2, and Seronorm Trace Elements Urine L-1) varied from 2.4 to 8.1% depending on the As species analysed (Appendix A1.4). The relative bias (the differences between the concentration of the reference material and the
concentration found using the analytical method) varied from -12% to +19% (Appendix A1.4).
Phthalate metabolites and phenolic compounds
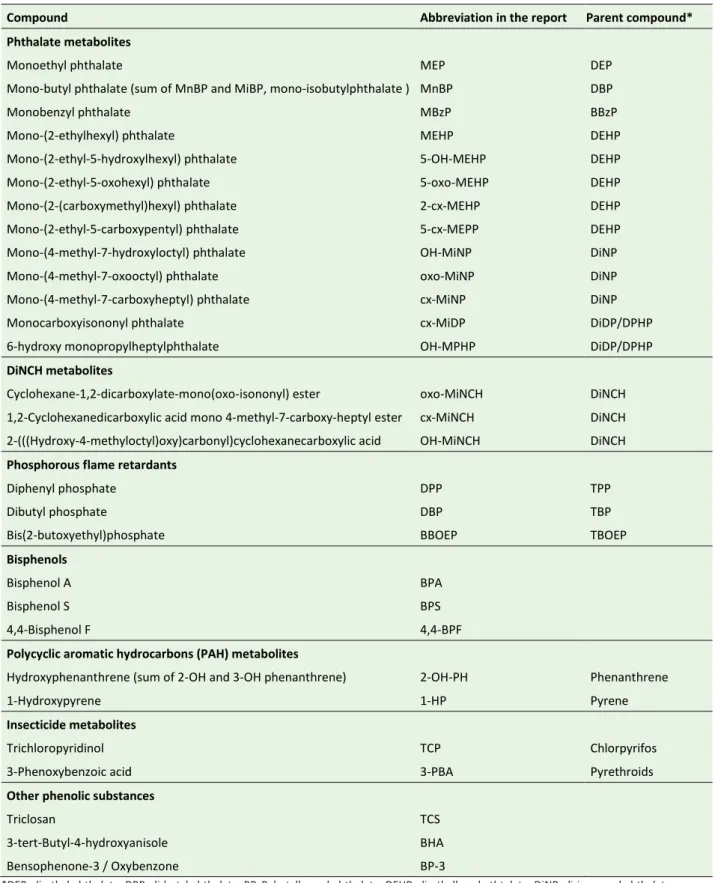
Phthalate metabolites and phenolic compounds were analysed in urine by the Division of Occupational and Environmental Medicine, Lund University, as previously described [129] with some modifications (Appendix A1.5). The measured compounds and their parent compounds are listed in Table 5.The samples were analysed on a Shimadzu UFLC system (Shimadzu Corporation, Kyoto, Japan) coupled to a QTRAP5500 triple quadrupole linear ion trap mass spectrometer equipped with a TurboIon Spray source (LC-MS/MS; AB Sciex, Foster City, CA, U.S.). The LOD values are summarized in Table 22. The CV% of the quality control sample did not exceed 20% for almost all compounds with the exception of cx-MiDP (27% at concentration of 0.6 ng/mL), BPS (25% at concentration of 0.8 ng/mL), DBP (41% at concentration of 0.1 ng/mL) and BHA (21% at concentration of 0.8 ng/mL). Urine concentrations were adjusted to the mean urine density in the Riksmaten Adolescents 2016–17 population (1.022 kg/L) according to Carnerup et al. [130].
Table 5. Phthalate metabolites and phenolic substances analysed in urine samples from Riksmaten Adolescents 2016–17.
Compound Abbreviation in the report Parent compound* Phthalate metabolites
Monoethyl phthalate MEP DEP
Mono-butyl phthalate (sum of MnBP and MiBP, mono-isobutylphthalate ) MnBP DBP
Monobenzyl phthalate MBzP BBzP
Mono-(2-ethylhexyl) phthalate MEHP DEHP
Mono-(2-ethyl-5-hydroxylhexyl) phthalate 5-OH-MEHP DEHP
Mono-(2-ethyl-5-oxohexyl) phthalate 5-oxo-MEHP DEHP
Mono-(2-(carboxymethyl)hexyl) phthalate 2-cx-MEHP DEHP
Mono-(2-ethyl-5-carboxypentyl) phthalate 5-cx-MEPP DEHP
Mono-(4-methyl-7-hydroxyloctyl) phthalate OH-MiNP DiNP
Mono-(4-methyl-7-oxooctyl) phthalate oxo-MiNP DiNP
Mono-(4-methyl-7-carboxyheptyl) phthalate cx-MiNP DiNP
Monocarboxyisononyl phthalate cx-MiDP DiDP/DPHP
6-hydroxy monopropylheptylphthalate OH-MPHP DiDP/DPHP
DiNCH metabolites
Cyclohexane-1,2-dicarboxylate-mono(oxo-isononyl) ester oxo-MiNCH DiNCH
1,2-Cyclohexanedicarboxylic acid mono 4-methyl-7-carboxy-heptyl ester cx-MiNCH DiNCH 2-(((Hydroxy-4-methyloctyl)oxy)carbonyl)cyclohexanecarboxylic acid OH-MiNCH DiNCH
Phosphorous flame retardants
Diphenyl phosphate DPP TPP
Dibutyl phosphate DBP TBP
Bis(2-butoxyethyl)phosphate BBOEP TBOEP
Bisphenols
Bisphenol A BPA
Bisphenol S BPS
4,4-Bisphenol F 4,4-BPF
Polycyclic aromatic hydrocarbons (PAH) metabolites
Hydroxyphenanthrene (sum of 2-OH and 3-OH phenanthrene) 2-OH-PH Phenanthrene
1-Hydroxypyrene 1-HP Pyrene
Insecticide metabolites
Trichloropyridinol TCP Chlorpyrifos
3-Phenoxybenzoic acid 3-PBA Pyrethroids
Other phenolic substances
Triclosan TCS
3-tert-Butyl-4-hydroxyanisole BHA
Bensophenone-3 / Oxybenzone BP-3
*DEP, di-ethyl phthalate; DBP, di-butyl phthalate, BBzP, butylbenzyl phthalate; DEHP, di-ethylhexyl pthtalate; DiNP, di-iso-nonyl phthalate; DiDP, di-iso-decyl phthalate; DPHP, di-propylheptyl phthalate; DiNCH, di(isononyl) cyclohexane-1,2-dicarboxylate; TPP, triphenyl phosphate; TBP, tributyl phosphate; TBOEP, tris(2-butoxyethyl) phosphate.
Statistical analysis
The statistical software package STATA (version 15; StataCorp, College Station, TX, U.S.) was used to perform all statistical analyses. Concentrations of contaminants were described by number of participants and percentages with concentrations below LOD or LOQ, arithmetic means, standard deviation (SDs), 5th percentile, median and 95th percentile. All descriptive statistical analyses were run on untransformed data. In all calculations, concentrations of compounds below LOD or LOQ were substituted with a value equal to LOD/√2 or LOQ/√2, respectively.
Differences in concentrations between regions, grades and genders were investigated for compounds with detectable levels in more than 50% of the samples using analysis of variance (ANOVA).
The factors included in the statistical models are listed below. The choice of factors was based on their relevance for the substance group.
Chlorinated and brominated persistent organic pollutants – region, grade and gender, interactions
between the factors, and weight status as categorical variable.
Per- and polyfluoroalkyl substances – region, grade and gender, interactions between region and
gender, interactions between grade and gender.
Metals, phthalate metabolites and phenolic compounds – region, grade and gender, interactions
between all these factors.
Arsenic – grade and gender, or country of birth of participant/mother (for pooled samples).
For each compound, differences between grades were also estimated separately for boys and girls using the same factors as in the main module excluding gender.
Additionally, differences in metal concentrations associated with smoking habits were evaluated among participants in grades 8 and 11 using a model with the factors region, gender and smoking habits.
Tukey’s multiple comparison test was used to estimate differences between groups. All ANOVA tests were performed on natural log-transformed data to normalize the distribution. The results are reported as back-transformed least squares means with 95% confidence intervals (CI) for the purpose of clearer data presentation.
Results and discussion
Characteristics of the study population
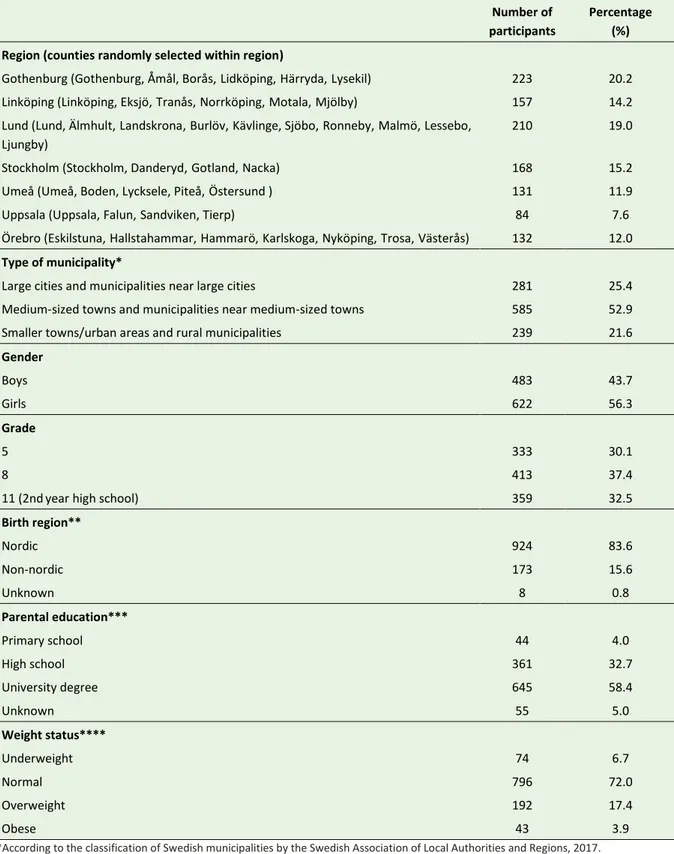
The distribution of participants according to region, type of municipality, gender, grade, birth region, parental education and weight status is presented in Table 6. More girls than boys (56% vs 44%, Table 6) participated in the study, especially in grades 8 and 11 (Table 7). The largest disparity between genders was observed in grade 11 in Umeå and Uppsala. Number of participants by gender within grade and region is presented in Table 7. Age and anthropometric details of the study population combined for both genders are presented in Table 8. The participants were aged between 10 and 21 years old, with an average age of 14.7 years.
Table 6. Main characteristics of the participants in the Riksmaten Adolescents 2016–17 subgroup that donated biological samples (n=1,105). Number of participants Percentage (%) Region (counties randomly selected within region)
Gothenburg (Gothenburg, Åmål, Borås,Lidköping,Härryda,Lysekil) 223 20.2
Linköping (Linköping, Eksjö,Tranås,Norrköping,Motala,Mjölby) 157 14.2
Lund (Lund, Älmhult,Landskrona,Burlöv,Kävlinge, Sjöbo,Ronneby,Malmö,Lessebo, Ljungby)
210 19.0
Stockholm (Stockholm, Danderyd,Gotland,Nacka) 168 15.2
Umeå (Umeå, Boden, Lycksele, Piteå,Östersund ) 131 11.9
Uppsala (Uppsala, Falun,Sandviken, Tierp) 84 7.6
Örebro (Eskilstuna,Hallstahammar,Hammarö,Karlskoga,Nyköping,Trosa,Västerås) 132 12.0
Type of municipality*
Large cities and municipalities near large cities 281 25.4
Medium-sized towns and municipalities near medium-sized towns 585 52.9
Smaller towns/urban areas and rural municipalities 239 21.6
Gender Boys 483 43.7 Girls 622 56.3 Grade 5 333 30.1 8 413 37.4
11 (2ndyear high school) 359 32.5
Birth region** Nordic 924 83.6 Non-nordic 173 15.6 Unknown 8 0.8 Parental education*** Primary school 44 4.0 High school 361 32.7 University degree 645 58.4 Unknown 55 5.0 Weight status**** Underweight 74 6.7
Table 7. Number of participants in the Riksmaten Adolescents 2016–17 subgroup that donated biological samples per gender within grade and region (n=1,105).
Region Grade 5 Grade 8 Grade 11 Boys Girls Boys Girls Boys Girls
Gothenburg 38 36 38 50 27 34 Linköping 11 9 32 43 21 41 Lund 36 35 36 49 31 23 Stockholm 20 36 36 41 19 16 Umeå 23 22 6 11 12 57 Uppsala 10 8 14 13 9 30 Örebro 28 21 18 26 18 21
Total per gender 166 167 180 233 137 222
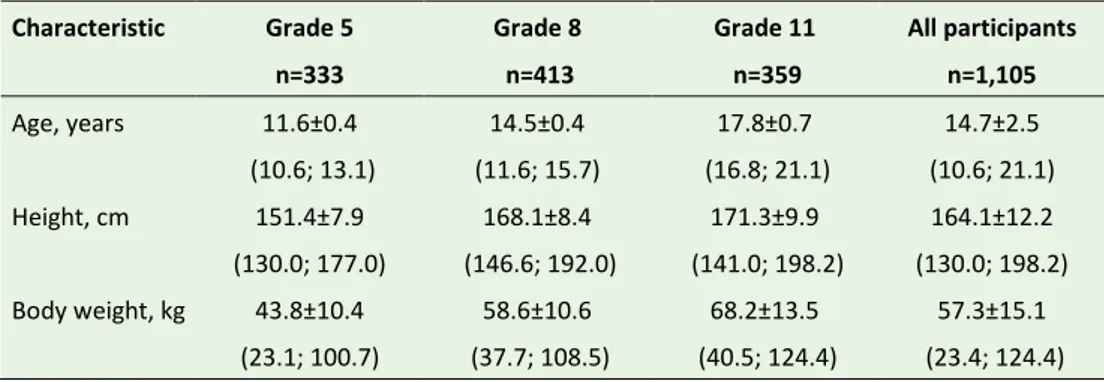
Table 8. Age and anthropometric measurements of participants in the Riksmaten Adolescents 2016–17 subgroup that donated biological samples (n=1,105). Data are presented as mean±standard deviation (minimum; maximum in brackets).
Characteristic Grade 5 n=333 Grade 8 n=413 Grade 11 n=359 All participants n=1,105 Age, years 11.6±0.4 (10.6; 13.1) 14.5±0.4 (11.6; 15.7) 17.8±0.7 (16.8; 21.1) 14.7±2.5 (10.6; 21.1) Height, cm 151.4±7.9 (130.0; 177.0) 168.1±8.4 (146.6; 192.0) 171.3±9.9 (141.0; 198.2) 164.1±12.2 (130.0; 198.2) Body weight, kg 43.8±10.4 (23.1; 100.7) 58.6±10.6 (37.7; 108.5) 68.2±13.5 (40.5; 124.4) 57.3±15.1 (23.4; 124.4)
Chlorinated and brominated persistent organic pollutants
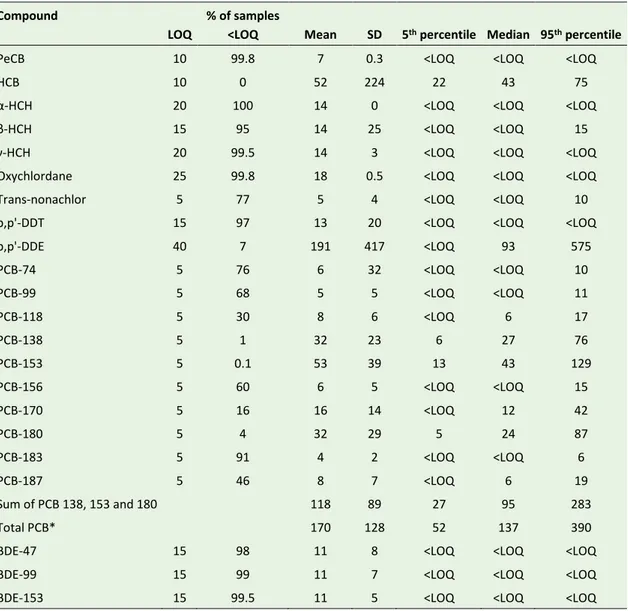
Chlorinated and brominated POPs were analysed in serum samples from 1096 participants, and the results are shown in Table 9. Full summary statistics per region, grade and gender are provided in Appendix 2, Tables A2.1–A2.3.
Table 9. Serum concentrations of chlorinated and brominated persistent organic pollutants (pg/mL) in Swedish adolescents (n=1,096). Concentrations below LOQ were replaced by LOQ/√2 in the calculations.
Compound
LOQ
% of samples
<LOQ Mean SD 5th percentile Median 95th percentile
PeCB 10 99.8 7 0.3 <LOQ <LOQ <LOQ
HCB 10 0 52 224 22 43 75
α-HCH 20 100 14 0 <LOQ <LOQ <LOQ
β-HCH 15 95 14 25 <LOQ <LOQ 15
γ-HCH 20 99.5 14 3 <LOQ <LOQ <LOQ
Oxychlordane 25 99.8 18 0.5 <LOQ <LOQ <LOQ
Trans-nonachlor 5 77 5 4 <LOQ <LOQ 10
p,p'-DDT 15 97 13 20 <LOQ <LOQ <LOQ
p,p'-DDE 40 7 191 417 <LOQ 93 575 PCB-74 5 76 6 32 <LOQ <LOQ 10 PCB-99 5 68 5 5 <LOQ <LOQ 11 PCB-118 5 30 8 6 <LOQ 6 17 PCB-138 5 1 32 23 6 27 76 PCB-153 5 0.1 53 39 13 43 129 PCB-156 5 60 6 5 <LOQ <LOQ 15 PCB-170 5 16 16 14 <LOQ 12 42 PCB-180 5 4 32 29 5 24 87 PCB-183 5 91 4 2 <LOQ <LOQ 6 PCB-187 5 46 8 7 <LOQ 6 19 Sum of PCB 138, 153 and 180 118 89 27 95 283 Total PCB* 170 128 52 137 390
BDE-47 15 98 11 8 <LOQ <LOQ <LOQ
BDE-99 15 99 11 7 <LOQ <LOQ <LOQ
BDE-153 15 99.5 11 5 <LOQ <LOQ <LOQ