ADSORPTION OF IONIC MERCURY IN AQUEOUS SOLUTION BY WASTE RUBBER IN PACKED BEDS
by
Charles L. Murphy
ARTHUR EAXES EIBBARY COLORADO SCHOOL of MINES
All rights reserved INFORMATION TO ALL USERS
The qu ality of this repro d u ctio n is d e p e n d e n t upon the q u ality of the copy subm itted. In the unlikely e v e n t that the a u th o r did not send a c o m p le te m anuscript and there are missing pages, these will be note d . Also, if m aterial had to be rem oved,
a n o te will in d ica te the deletion.
uest
ProQuest 10782119Published by ProQuest LLC(2018). C op yrig ht of the Dissertation is held by the Author. All rights reserved.
This work is protected against unauthorized copying under Title 17, United States C o d e M icroform Edition © ProQuest LLC.
ProQuest LLC.
789 East Eisenhower Parkway P.O. Box 1346
A Thesis submitted to the Faculty and the Board of Trustees of the Colorado School of Mines in partial fulfill ment of the requirements for the degree of Master of Science
(Chemical and Petroleum-Refining Engineering).
Signed:
Charles L. Murphy *
Golden, Colorado
D a t e : g o , 1977
Appr o v e d : / MQMAlit
Anthony ly. Hfries Thesis Advisor
.y Dickson Head of Department
Golden, Colorado
ABSTRACT
This investigation was undertaken in order to study the adsorption of ionic mercury on waste rubber in a packed bed. Ionic mercury poses an environmental problem due to the
severe effects of ingestion into the human body. Due to a number of recent incidents involving mercury poisoning of fish and other animals, pollution abatement methods for the discharge of industrial wastes containing mercury have been
investigated. The use of another waste material; in this
case ground rubber from tire recapping industry, was desired, thus conserving natural resources.
The adsorption process is characterized by use of an equilibrium isotherm in conjunction with mass transfer rates
and/or chemical reaction rates. In this study equilibrium
isotherms were measured along with breakthrough curves in order to analyze the mass transfer mechanism(s) for sorption. The process was found to be controlled by internal diffusion. Solution of the partial differential equations describing the system was carried out by the use of a numerical methods
oriented computer program. Curve matches between experimental
breakthrough curves for three particle sizes and three column lengths, and computer generated theoretical breakthrough
curves were made. Diffusion coefficients for mercury diffus
ing through waste rubber particles were determined and were
-12 2
found to be in the range of 10 cm /sec.
iii ARTHUR CAKES LIBRARY.
COLORADO SCHOOL of MINES COLDEN, COLORADO 8Q4Q21
TABLE OF CONTENTS Page ABSTRACT . . . iii LIST OF FIGURES... V LIST OF TABLES . . . . . . . . . . . . vi ACKNOWLEDGMENTS. ... vii INTRODUCTION . . . 1 THEORY ... 9 Isotherms. . . . 9
Fluid Phase Differential Material Balance. . . . . 10
EQUIPMENT AND PROCEDURE... 17
Chemical Description of the Rubber U s e d ... 17
Physical Description of the Rubber Used. . . . . . 19
Isotherm Studies ... 21
Batch Kinetic Studies. . . . 22
Column Studies ... 23 Analytical Methods ... 25 RESULTS. . 28 Isotherms. . . . . . . 28 Computer Analysis. ... 30 DISCUSSION . 47 Experimental Data. . . . . 47
Liquid Flow Rate . . . 48
Temperature. . . . 49
Isotherms. . . . 50
Chemical Reaction. . . . 52
External Mass Transfer . . . . . . . 53
Internal Diffusion . . . . 54
Particle Size Effects. . ... . 57
CONCLUSIONS AND RECOMMENDATIONS. . 59
N O M E N C L A T U R E ... 62
LIST OF REFERENCES ... 64
LIST OF FIGURES
Figure Page
1. Experimental Apparatus 27
2. Equilibrium Isotherms 29
3. Experimental Breakthrough Curves
(10/30 U.S. Mesh) 33
4. Experimental Breakthrough Curves
(30/45 U.S. Mesh) 34
5. Experimental Breakthrough Curves
(45/50 U.S. Mesh) 35
6. Theoretical Breakthrough Curves
(10/30 U.S. Mesh) 36
7. Theoretical Breakthrough Curves
(30/45 U.S. Mesh) 37
8. Theoretical Breakthrough Curves
(45/50 U.S. Mesh) 38 9. Interpolation Curves (10/30 U.S. Mesh) 41 10. Interpolation Curves (30/45 U.S. Mesh) 42 11. Interpolation Curves (45/50 U.S. Mesh) 43 v
LIST OF TABLES
Table Page
I. Industrial Consumption of Mercury 3
II. Chemical Analysis of Ground Rubber 18
III. Sieve Analysis .20
IV. Langmuir Isotherm Data 31
V. Diffusion Coefficients (10/30 U.S. Mesh) 44
VI. Diffusion Coefficients (30/45 U.S. Mesh) 45
ACKNOWLEDGMENTS
The author wishes to acknowledge the assistance and support of his advisor, Dr. Anthony L. Hines, without which
his graduate career would have been limited. The patience
and support of the author's wife, Elizabeth, was also appre ciated. Recognition is given to Dr. P. F. Dickson and Dr. A. J. Kidnay for financial support and for serving on the M a s t e r 's Committee.
vii
ARTHUR HAKES EIBRAHY1 COLORADO SCHOOL of MINES
INTRODUCTION
In recent years contamination of the atmosphere, water resources, and of the ground on which we live by industrial and natural sources has received a great deal of attention. Because of the concern for public health, new and more
effective techniques for pollution abatement have been in
vestigated. Capital costs, effectiveness, and ease of opera
tion have all played a part in controlling harmful effluents
from industrial plants. Uniform standards fixing the degree
of cleanup required have often been lacking due to diffi culty in establishing the exact effects of the pollutants upon our environment.
A great deal of effort has been expended in developing methods for the removal of heavy metals from wastewater. Of the heavy metals known to be toxic to plant and animal life, mercury stands out as being one of the most hazardous. Due
1 2
to a number of recent incidents ' involving mercury poison ing of fish and other animals, public attention was aroused and methods for curtailing industrial discharges of mercury
were quickly implemented. Although mercury enters our water
resources from the leaching of natural deposits, the primary source of mercury pollution results from inadequately treated
industrial effluents. Primary industrial users of mercury
are the clor-alkali producers, agricultural chemical manu facturers, the electrical industries, and the paint manufac turing industry.^- A more detailed listing of United States
mercury consumption statistics may be found in Table I. In 1968 the world consumption of mercury was about 20 million pounds and the United States consumed approximately
30% of the world supply or 5.7 million lbs. A n undetermined portion of this total is released into the. atmosphere every
year. Mercury losses in 1968 from the United States clor-
alkali industry alone amounted to 990,000 lbs of mercury with an additional 200,000 lbs lost in the Canadian clor-alkali industry. Mercury is lost in a number of phases in this process; through the caustic soda product, overall cleaning of the mercury cell rooms, through the brine solution, and
through the hydrogen by-product. The caustic soda contain
ing trace quantities of mercury is often used in the food processing industry as a peeling agent for fruits and vege tables, a reagent in the production of vegetables and fats, and as a pH adjuster in the canning industry.
A
Mercury poisoning incidents from the catalytic use of mercuric sulfate to convert acetylene into acetaldehyde and
vinyl chloride have been reported. Methylmercury was formed
as a by-product of this reaction and was subsequently dis charged into the Minamata Bay in Japan in the wastewater
effluent. Neurological diseases caused by the highly toxic
methylmercury resulted in 121 cases of poisoning including 46 deaths between 1953 and 19 61. Fishermen and their fam ilies were primarily afflicted. A similar problem arose in 1965 when a chemical company discharged methylmercury into
ARTHUR EAKES EIBRARY COLORADO SCHOOL of MINES
Table I
Mercury Consumption Statistics for U.S. Industry
Industry
Electrical apparatus
Industrial control instruments General laboratory use
Chloralkali Paint
Agriculture Dental
Catalyst
Paper and pulp
Pharmaceutical and cosmetic Amalgamation Miscellaneous uses Total Consumption (lb) 1.500.000 606,000 151.000 1.300.000 803.000 260.000 243.000 145.000 32.000 32.000 20.000 628.000 5.720.000 Percent 26.0 10.6 2.6 23.1 14.4 0.35 11.0 100.0
Source: D'ltri, F. M . , "The Environmental Mercury Problem," CRC Press, Cleveland, 1973.
the Agano River near Niigata, Japan, with 47 cases of mercury
poisoning resulting, including 7 deaths. Mercury poisoning
from agricultural fungicides killed 20 people in the Guate
malan Highlands with an undetermined number of people afflicted. Other incidents too numerous to cite have also occurred in
Pakistan, Iraq, and Russia.
The physiological effects of mercury poisoning are quite
severe. Symptoms of acute mercury intoxication include
extreme salivation, severe gastrointestinal irritation, vomit ing of bloody mucus, loss of fluids, vascular collapse, col lapse of the central nervous system, and genetic damage. Organomercurial compounds are much more easily ingested and absorbed into the system than inorganic mercury and there
fore presents a greater hazard. Inorganic mercury is excreted
much more readily than its organic counterpart since the alkyl- mercurials are more readily dissolved in body fats and
absorbed by red blood c e l l s . Evidence has shown that aryl mercury compounds are relatively easily broken down into
inorganic form and metabolized. Methylmercury compounds
resist degradation and tends to accumulate in the body. Only a brief introduction into the problems of mercury contamination has been given. An excellent survey of the subject was made by D'Itri in a report made to the Michigan House of Representatives.^ The study was undertaken to eval uate the effects of rising mercury concentrations in the Great Lakes. A very extensive list of references was included in this report.
ARTHUR EAKES LIBRARY COLORADO SCHOOL of MINES
Most commercial processes which have been developed to control both inorganic and organic mercury utilize adsorption
or ion exchange as their primary processing step. Other
methods have been developed such as chelation followed by precipitation but these methods are characterized by high costs, inability to control trace quantities of mercury, and can usually handle only one form of mercury (i.e. organic, anionic, or cationic m e rcury).
3
Ventron uses a chemical reduction of mercury found m
plant effluents by sodium borohydride. The mercury is removed
by centrifuging. The process is cost limited by the sodium borohydride and also suffers from pH limitations and by the inability to remove organic mercury compounds.
4
Crawford and Russell, Inc. uses a two stage ion exchange
process to reduce mercury contamination. The operating cost
in 1971 was about $1.00/1000 gallons. The Billingfors Burks
5,6
BMS process uses a sulfur coated activated carbon adsorb
ent as its principal processing step. Overall plant operating
costs are about $0.95/1000 gallons for a 2100-2600 gallon/
hour plant. Dow Chemical Company also produces ion exchange
resins for the removal of ionic mercury. Dowex 50W-X8 is recommended for the removal of Hg ions while Dowex 1-X8 is
used for the removal of anionic mercury. Substituted sulfon
ate groups are the active sites in the cation exchange resin and substituted quaternary ammonium groups are used in the
benzene is used as the base. These exchange resins are
plagued by plugging of the active exchange sites and by high c o s t s.7,8,9,10
Agricultural byproducts have been recently investigated as a means of reducing aqueous mercury compound
concentra-11 12
tions. Friedman and Waiss ' measured mercury uptake on
peanut hulls, wools, and feathers for tannery applications. 13
Friedman and Masri investigated the use of modified wools
and polyamino acids as possible adsorbents.' Hog, cattle and tannery hair have been used as mercury separation media with
14
a great deal of success by Pace and by Kutat and Michel- 15 16
sen. 9 Waste wool fibers received a comprehensive review
17
by Arthur D. Little, Inc. Chemically treated waste rubber
2
was studied by Griffith and buffing scraps from the tire retreading industry underwent preliminary investigations by
TO 1 Q
Poonawala, et al. 9
2
Griffith used the ground waste rubber as a starting material and proceeded to mofidy the ion-exchange character
istics of the buffing scraps by chemical means. Clorination
cloro-methylation, sulfonation, and amination of the waste
rubber was attempted. Chemical and physical properties of
the rubber were found to have changed as a result of the
modified chemistry of the rubber. Both cation and anion
exchange capabilities were studied. Equilibrium loading
capacities were determined for each reaction product. Batch
kinetic studies were made and combined reaction and mass
rubber compounds and commercial Dowex resins were compared in
small laboratory type columns. The modified rubber was also
evaluated for regeneration capability and loading capacities were remeasured on regenerated material.
Griffith reported increased equilibrium loading capaci ties for the treated rubber compounds over the Dowex resins as well as larger rate constants for the rubber adsorbent. Strong acid (4.5N HC1) was used to regenerate the spent col umns which resulted in a 20-25 percent loss in loading capac ity. In studies on rubber modified as an anion exchange resin, very poor regeneration was realized.
In this study, raw rubber that had been ground from tires that were to be retreaded was investigated. Since an ele
mental analysis has shown that waste rubber contains about 83% carbon and 1.2% sulfur, waste rubber offers another source of mercury adsorbents. In 1968, 1.56 billion pounds of automobile tires were retreaded in the United States and
20
this industry is expected to expand. During the retreading
operations the old tire tread, containing about 10% of the rubber in the tire, is removed by abrasion. Although tires contain approximately 8% non-rubber fibers, the tread is com posed entirely of rubber (styrene-butadiene emulsion copoly-
21
m e r ) . Thus approximately 140 million pounds per year of finely ground high purity rubber is produced as a by-product of the tire retreading industry.
Tires are presently being used as artificial reefs and
some instances may be enhanced by the application of ground tires. The tire tread, however, is not in demand. The use of the ground buffing scraps as an adsorbent for mercury
removal provides two benefits: the obvious removal of m er
cury from waste water streams, and the effective utiliza tion of the buffing scraps.
ARTHUR EAKES LIBRARY COLORADO SCHOOL of MINES
THEORY
This study consisted of the unsteady state saturation of a packed bed of solid, adsorbent particles resulting from
a fluid containing an adsorbable solute. This particular
study was for the case of a liquid flowing upward in a fixed, packed bed containing buffing scraps from a tire retreading
operation. Two pieces of information are required to analyze
this problem: 1) the equilibrium relationship between the concentrations in the bulk fluid and solid phase must be
known, and 2) the mechanism governing the transfer of adsorb-22-25 ate from one phase to another must be known or estimated.
Isotherms
Equilibrium curves, or isotherms, relate solid phase to bulk fluid phase concentrations and directly influence the shape and behavior of the breakthrough curves. A general iso—
2 6
therm may be represented by four idealized types: 1) Irreversible equilibrium
2) Favorable equilibrium 3) Linear equilibrium
4) Unfavorable equilibrium
These equilibrium types have been modelled by many theoretical
and semi-empirical equations. The most widely used of which
are the Langmuir isotherm model, Freundlich isotherms, BET 27
isotherms, and linear isotherms. These models are used
fluid-solid interface. Other mechanisms such as a reaction at the fluid-solid interface may sometimes be assumed. Such reactions are usually very rapid in comparison to the much slower external or internal mass transfer mechanisms, and therefore the assumption of equilibrium at the interface has
24 become a rather standard one.
Until recently, the mathematical treatments of adsorption relied almost exclusively on assumptions of linear equilibrium
2 8
isotherms and spherical particles. With the advent of
high-speed digital computers these assumptions are gradually being discarded in favor of more accurate representations of the actual physical processes. Most of the new techniques have precluded the use of analytical solutions and have
24 29— 3 6
forced use of numerical computer modelling techniques. '
This particular study has made use of some of these methods to estimate diffision coefficients of ionic mercury diffus ing into ground rubber particles.
Fluid Phase Differential Material Balance
A differential adsorbate balance is almost always used 32 34
m mathematical treatments of packed bed adsorption. '
The balance may be employed in two forms; the first employs a balance over both the fluid and solid phases simultaneously, while the second balance, which is more commonly employed, is made over the fluid phase only. These balances may be inter changed by appropriate multiplication by the void fraction.
The second technique mentioned above may be derived by a shell balance over a finite volume element and allowing this element to go to zero. A differential mass balance on solute A over the volume element yields:
The total mass of A in/unit time:
2
ttD
S V p L C
The total mass of A out/unit time
2
(la)
ttD
evpL C z + A z (lb)
Amount of A lost in fluid/unit time: „ 2
o 4 3C
£ _ — A z P l _
Rate of A adsorbed/unit time:
2 (lc) ttD A z p B R. w h e r e : C = fluid concentration D = column diameter o R = rate of adsorption t = time
v = linear flow velocity z = column length
e = bed void volume p = bed bulk density
Xj
p = liquid density
(Id)
ARTHUR EAKE'S EIBRHFSI COLORADO SCHOOL of MINES
Combining terms and, d i viding by the element volume and taking the limit as Az goes to zero results in the following expres sion:.
lim p £v(Cjz — C| z+Az) Arr
— --- £ 2--- - pB R - (2)
Dividing by p^e and substituting in for the rate o f ad
sorption g i y e s :
9C 3C.
PLeV
it
+ epL TF- + PB
"3t— = 0°r
3CA 3CA 1 3qA
v---— 4- ■■ 4- — ^ ■ = 0 ( 3 )
dz 31 m 3t
1 PB 1-e , „ ^
where — — —— — = ---- (4)
m p_ e e
The above equation assumes a constant flow rate throughout the column which would be strictly true only for the case of an infinitely dilute s o l u t e . Since the system of interest was extremely dilute and incompressible the equation given
above does apply.. For cases involving a significant axial
3
diffusion, D a — %>• should be added to the right hand side o f A 3 zT
equation (4), where is the axial diffusion coefficient.
Neglecting axial diffusion, it may be shown that the variable transformations
0v * t-Z/v (5a)
X = Z/mv (5b)
transform equation (4) such that
3 £ « - 3 a .. (6)
3X 3 0 K 1
the adsorbent particle may be represented by
| | = kL a(C-C*) (7)
where C* is the fluid concentration of adsorbate in equilib rium with that in the solid. Intraparticle diffusion for a homogeneous particle is given by
3<3i 2 3 2 3<*-!
_ i = D v 2 q . = D f j (r2 , -i) (8 )
with initial and boundary conditions
IC I q^(r,X,e)=0 at ©=0 0£ r£ Ro (10a)
BC I 0—C/C =-0 at X=0 t£0 (10b)
BC II 0=C/C — 1 at X=0 t > 0 . (10c)
assuming that the diffusion rate is radially dependent only. The overall average diffusion throughout the particle may be found by integrating over the particle volume
R ° 2 f qj_(r,X,0)r dr Rq q(X,e) / q.(r,X,0)r2dr. (9) ° 2 Ro 0 f r dr ° 0
Equation (6) was used as the starting point for the genera tion of diffusion controlled breakthrough curves for systems
exhibiting Langmuir type isotherms. Curve matching experi
mental data to these model curves provides clues as to the
possible mechanism(s) of the mass transfer process. For
cases in which internal diffusion controls, the curve match also provides for the calculation of the effective intra particle diffusion coefficient.
Equation (8) may be solved for constant surface concen trations to give the series solution
2
C-C, 2R 00 , ..n _Dcrn 0
H = — ± _ = 1 + — - Z ’ sin(a r) e . (11)
C - C , 7rr n n
o 1 n=l
After applying Duhamel's theorem to transform equation (11) to the case of varying surface concentrations, the result is
substituted into equation (9). After interchanging the
integration and summation so that the integration with respect to r may be carried out,
00 ® -Da 2 <e-x)
q = --5- £ f q e dX (12)
R n=l 0 S
o
where X is a dummy variable of integration. Leibnitz' rule for differentiating an integral may be employed to yield
3C -3q 6D ® ^ s (X'X) ^
3X = 39 = “ r i fn 3A e d A - (13)
Ro 0
37
Rosen evaluated q g from equations (7) and (8) to obtain
^ r^. + r 3C] (14)
9X D 9X R f 9X * { }
Rosen in 1952 published an analytical solution to equa tion (14) assuming a linear isotherm. By this method, one was able to calculate both diffusion coefficients and external
mass transfer coefficients. The coefficients were obtained by
overlaying or superimposing experimental data on the theoret
ical curves until a satisfactory fit was obtained. Although
an analytical solution was obtained, numerical calculations 35 were still required to obtain the theoretical curves.
a small family of curves were generated. As previously m en tioned, Rosen's results only applied for systems exhibiting linear isotherms.
34 38 39
Rosen's basic approach was followed by Antonson ' '
in obtaining theoretical curves valid for systems that could be modelled by Langmuir isotherms. When q g is eliminated from equation (13) by use of the Langmuir isotherm,
KqMC *
q * = — — _ (Langmuir isotherm) (15) 1+KC*
and the resulting expression substituted into the fluid phase mass balance, which is expressed as equation (6) , the result
is equation (16).
| £ = 6DK “ ® H c q i l K m e"DV (e- X)dx (16)
3X R 2 n=l 0 3X
o
2D 2
Defining 0 = C / C _ , 9 = -j 9, and ri = 3DZ (Kq..)/mvR and
sub-o j. "p ^ jyi o
stituting into equation (16) gives
30 “ 3 (0/(l+KCoC) ) -l/2n2iT2(eT -X)
¥n = -2 z, 3A e (17)
1 n=l
Equation (17) was used as the starting point for solution by numerical methods. A first order finite difference
approach was taken and a computer program implementing the
required calculations was written. Values of 0=C/CQ are
generated as a function of 9 and n . The program was able to duplicate Antonson*s results and because the highly nonlinear isotherms exhibited by mercury adsorption on ground rubber were not in the same range as Antonson's, the solution of
equation (17) was extended to include the more nonlinear cases found in this study. The use of the theoretical break through curves in fitting experimental data is described in the Results section along with graphs of the computer print outs .
EQUIPMENT AND PROCEDURE
Chemical Description of the Rubber Used
The rubber used in all studies was obtained from a local
tire retreading operation. The rubber used was sieved from
the buffing scraps or tread shavings resulting from the
recapping operation. In this process the old tread is buffed or shaved from the tire carcass and discarded as waste mater ial. The buffing scraps are principally used at the present time for land fill in waste treatment operations. The buffing scraps comprising the tire treads are composed entirely of
40
polystyrene-butadiene rubber. Fisher has described the
emulsion-polymerization process by which the polystyrene-
butadiene is made. The resulting copolymer, designated GR-S
rubber, contains about 67% styrene-butadiene, 25% of which is styrene, 30% carbon black, and 3% accelerators, vulcanizers
and emulsifiers. An elemental analysis yields about 83%
carbon and 1.2% sulfur with the remainder composed of hydro
gen, nitrogen, oxygen, and ash. These results are summarized
in Table II. The crosslinked polymer contains multiple sul
fur linkages at the butadiene double bonds. These double bonds are susceptible to substitution with many different derivatives including sulfonate, amine, and quaternary ammon
ium groups. These groups characterize both anionic and
cationic groupings. Since mercury is present in aqueous
solution in both of these forms it is reasonable to assume that mercury would be readily adsorbed onto ground rubber.
ARTHUR CAKES LIBRARY COLORADO SCHOOL of MINES
Table II
Chemical Analysis of Passenger Tire Tread
Component W t . %
GR-S Rubber (SBR) 46.78
Polybutadiene 11.34
Oil Soluble Sulfonic Acid 2.27
Stearic Acid 0.91 Zinc Oxide 1.36 Antioxidant 0.91 Antio zonant 1.81 Processing Aid 0.4 5 Carbon Black 29.49 Softener 3.18 Sulfur 0.82 Accelerator 0.68 100.00
Data taken in part from:
"Rubber Technology," 2nd Ed., Ed. Maurice Morton, Van Nostrand Reinhold Co., New York (1973), p. 20.
Physical Description of the Rubber Used
The rubber was used as received without any additional
treatment except for screening. The rubber had no appreciable
moisture content; therefore, it was used without drying. No
foreign particles such as tire cord steel or glass belts, or pebbles were observed with the exception of a trace quantity of metal flakes which could be removed with the aid of a magnet. These metal flakes were not removed from the rubber prior to use.
When the waste rubber was placed in water the larger particle sizes tended to float even though the particle den sity was about 1.2 g/cm while most of the smaller particle sizes readily sank. It is believed that the larger particles contained an oily film preventing surface wetting and causing
the particles to agglomerate and float. Once the particles
were wetted they sank but still tended to stick together. 41
Davies has previously shown that the presence of surfactants
tends to provide extreme resistances to external mass trans fer; an example of which is the addition of surface active agents to reduce water losses from cooling ponds. It should be noted that the smaller particle sizes did not exhibit this behavior.
A sieve analysis was made on the as-received tire buff
ings to determine a particle size distribution. This was
done on a dry sieve basis using U.S. Standard screens. The analysis was done on the particle sizes of interest; the results of which are given in Table III. The particle sizes
Table III
Sieve Analysis of As-Received Buffing Scraps
Sieve No. Size (microns) Wt % Retained on Sieve
10 1680 31.6 30 500 89. 8 45 354 93.2 50 297 95.3 70 210 96. 9 80 177 98.0 120 125 99.0 170 88 99.4 270 53 99.6 Pan __ 100.0
in this table correspond to the screen opening size and not to an average particle size. An optical microscope was used to determine the particle shape. They were found to be
nearly cylindrical and curled somewhat like wood shavings, especially the larger sizes. This was due to the way in which the rubber tread was buffed from the tire casing.
Samples were taken from each particle size and a length over
diameter ratio was measured using the microscope. The
approximate L/D ratios were found to be 10/1, 6/1, and 2.5/1 for the 10/30, 30/45, and. 45/50 U.S. Mesh sizes respectively.
Isotherm Studies
In most adsorption or ion-exchange studies the equilib rium isotherms are obtained by monitoring effluent concentra tions until a constant composition is obtained. Due to the very long run times required for equilibrium to be established during a column run for this system, the equilibrium iso
therms were instead obtained on a separate batchwise basis. Using this technique long runs could be made on the well
stirred isotherm samples thus ensuring equilibrium. Isotherm
data was taken for each particle size at varying concentra tions at a constant temperature of 23.5°C.
The isotherm data were obtained by placing 1, 2, 3, 4, 6, and 10 grams of the scrap rubber of each particle size (10/30,
30/45, and 45/50 U.S. Mesh) in separate 500 milliliter glass
sample jars fitted with polyethylene caps. The polyethylene
caps were chosen over the more common cardboard lined caps to ARTHUR CAKES EIBRARY COLORADO SCHOOL of MINES
minimize adsorption effects of the caps. Three hundred and fifty milliliters of stock solution containing approximately 30 ppm of ionic mercury in the form of mercuric chloride was added to the rubber. The sealed jars were placed on a gyra tory shaker table and shaken for 96 hours. Batch data pre viously taken showed concentrations still changing very
slightly at 72 hours. Equilibrium was attained by 96 hours.
After the allotted time the rubber particles were filtered from the depleted mercury solutions with Pyrex glass wool. The solutions were immediately diluted to 2.4% hydrogen
peroxide and analyzed to determine the mercury uptake of the
rubber in equilibrium with that in solution. The hydrogen
peroxide served to stabilize the mercury by complexing it in solution.
Blank solutions carried through the entire process for each particle size to which no rubber was added indicated that mercury adsorption by the glass had not occurred in a measurable quantity in the slightly acid tap water (pH 6.7) used in making up the stock solutions.
Batch Kinetic Studies
The batch kinetic studies were done exactly like the equilibrium isotherms except that the samples were taken at specified time intervals rather than after equilibrium had been reached. The rate of adsorption of mercury on rubber was measured as a function of initial mercury concentration in solution versus time. A 50/70 mesh size was used for these
studies.
For a typical experiment, a 500 ml glass jar with a polyethylene cap was filled to 350 mis with a solution con taining an initial concentration CQ , and the jar was fastened onto a gyratory shaker table. At zero time, 0.5 grams of the rubber was poured into the bottle, the lid was secured and
the shaker was started. The shaker caused the jar which was
fastened in a vertical position, to move horizontally in a side to side motion at a rate of 160 movements per minute. The movement produced vigorous agitation and good mixing of the rubber particles with the solution.
After a specified period of time, the bottle was removed and a portion of the contents was filtered through glass wool to remove the rubber. A 5 ml aliquot of the filtrate was mixed with 0.4 mis of 30% hydrogen peroxide and was subse
quently analyzed for mercury by atomic absorption spectrometry. The above procedure was repeated for contact times of 20, 30, 50, and 120 minutes with initial solution concentrations of 33.4 and 61.7 ppm Hg. All runs were made at the room tem perature of 23.5°C.
Column Studies
The equipment for the column adsorption studies consisted of three 1.00 inch ID plexiglass tubes of ten inch lengths. The columns were designed so that samples could be taken at
0, 10, 20, and 30 inch intervals. A tee with a rubber sep tum attached to the sidearm was used to thoroughly mix each
of the column effluents and provide an efficient means for sample removal. The samples were removed from the sidearms by means of a hypodermic syringe.
Upward flow through the column was used during all runs with the flowrate carefully controlled at 16 mls/min (0.775
2
gal/min-ft ) by a needle valve and a rotameter. The rotameter was used only as an indication of t h e .flow rate since air
trapped in the rubber frequently would be released and inter
fere with the rotameter reading. This problem was especially
pronounced during column startup. Frequent checks of the
flow rate using a timer and a graduated cylinder alleviated
these slight difficulties. The careful monitoring of the flow
rate minimized fluctuations that might occur during a partic ular r u n .
The incoming mercury solution was fed via tygon tubing from two bottles located approximately 20 feet above the bottom of the column. The first of these bottles was a two gallon jug which maintained a constant head on the column; the constant level in this first container was obtained by adjusting the flow from a larger storage bottle containing the
mercury stock solution. The constant head in conjunction with
the needle valve helped maintain a constant flow through the
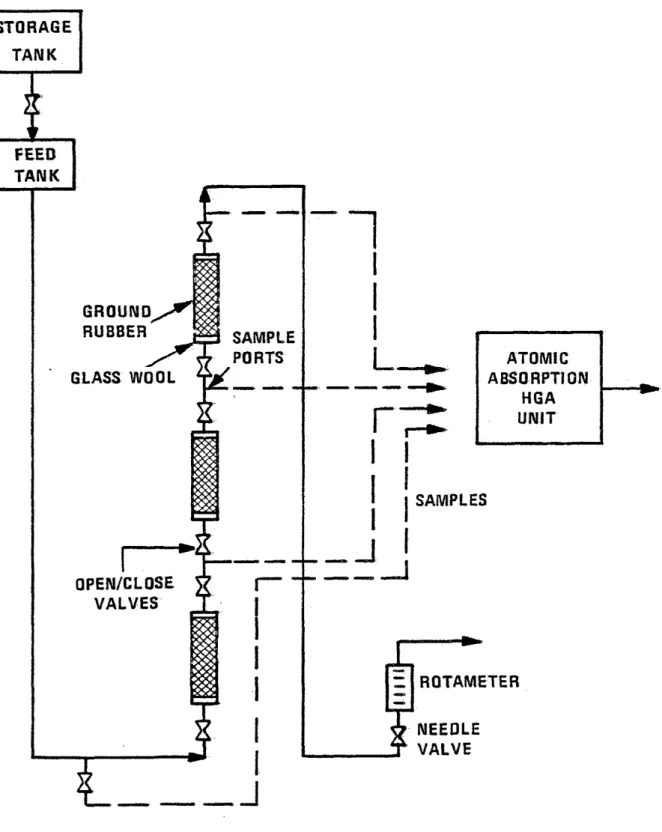
column. A schematic diagram of the equipment used is shown
in Figure 1.
Packing the column was considered an extremely important part of the procedure. During packing, great care was taken to insure that a constant amount of material per unit length
was used for all particle sizes tested. This care insured a common basis of comparison and minimized any errors result ing from changes in void volumes and bulk densities along the column length.
Each end of the three column sections contained a 1/2
inch section of Pyrex glass wool to filter out small particles of rubber or any other foreign particles that might contam inate the samples, and also helped serve as a flow distributor The glass wool was held in place by means of a solid rubber stopper placed on either end of the column. The glass wool was followed by ground rubber of known mesh size that was
lightly rodded and weighed every 2-3 inches to insure a uni
form consistency as previously mentioned. Short sections of
tygon tubing connected the sampling tees to the 3-10 inch
columns. Stainless steel tubes placed into rubber stoppers
were used to direct the flow into the plexiglas columns. The apparatus was weighed before and after a run to determine the effective bed porosity.
Analytical Methods
The mercury in aqueous solution was analyzed by an atomic absorption spectrometer in conjunction with a heated graphite atomizer (Perkin-Elmer HGA 2100) and a. deuterium arc back
ground corrector. The basic procedure that was followed was
42
developed by Issaq and Zielinski who devised a precise
method for analyzing aqueous solutions containing low mercury
levels. Samples taken from the column were diluted with 2.4%
ARTHUR EAKES EIBRARY
CO LO RADO SCHOOL oi M IN E S
hydrogen peroxide in distilled water. The diluted samples in the 0.1 to 1.0 part-per-million range were injected into a hollow graphite tube with a 50yl pipet and atomized after
drying off the water. The resulting peak heights were measured
on a fast response strip chart recorder. Peak heights were compared with a calibration curve prepared from six dilutions
v
of 1000 ppm Fisher Scientific atomic absorption mercury stand ards .
Operational variables of the HGA and Perkin-Elmer atomic 42 absorption unit were set as described by Issaq and Zielinski. Drying time and temperature were set at 50 seconds and 12 0°C respectively; followed by an atomizing time of 8 seconds at a
temperature of 2200°C. The mercury arc lamp was operated at
a wavelength of 253.6nm with an amperage of 8mA and with a o
spectral band width of 6.8 A.
The tips used on the pipet were rinsed three times with the sample to be analyzed and then injected into the graphite tube. The old tip was discarded and a new one used approxi mately every 25 samples. The precision of the pipet was ±3yl and an accuracy of ±5yl was determined by weighing the volume in the pipet.
Dilutions were done on a top loading balance which was capable of weighing to the nearest 10 milligrams estimating to the nearest 1 mg. The samples were weighed into a polyethy lene measuring cup and diluted with the 2.4% hydrogen perox
ide stock solution. If no difficulties were encountered dur
ing the analysis the time required for one sample was about 2-3 minutes.
STORAGE TANK FEED TANK GROUND RUBBER SAMPLE PORTS ATOMIC ABSORPTION HGA UNIT GLASS WOOL SAMPLES OPEN/CLOSE VALVES ROTAMETER NEEDLE VALVE
Fig. 1. Experimental apparatus
M TH U H HAKES EIBRARY COLORADO SCHOOL of MINES
RESULTS
The results of the experimentally derived breakthrough curves and isotherms are presented in this section along with
the computer generated breakthrough curves. Analysis of the
data yielded approximate values for the overall intraparticle
diffusion coefficients. A method of correlating the experi
mental isotherms is also presented.
Isotherms
As previously mentioned in the experimental section, the equilibrium isotherm data was obtained separately from the
breakthrough curve data. Plots made of solid adsorbate
concentrations versus the adsorbate concentration in the fluid in equilibrium with the solid at constant temperature con
stitute equilibrium isotherms. The isotherms are classified
on the basis of their partial derivatives of solute concen tration in the solid with respect to solute concentration in the fluid at constant temperature:
1) Irreversible, (fcir) t = 0
a 2 rr*
2) Unfavorable, (— ?) m < 0 ac*
3) Linear, (ISr) m - Constant
a 2 rr* 4) Favorable, ('— 2-r) _ > 0 ac*'T * , — ) 2 T ac*'
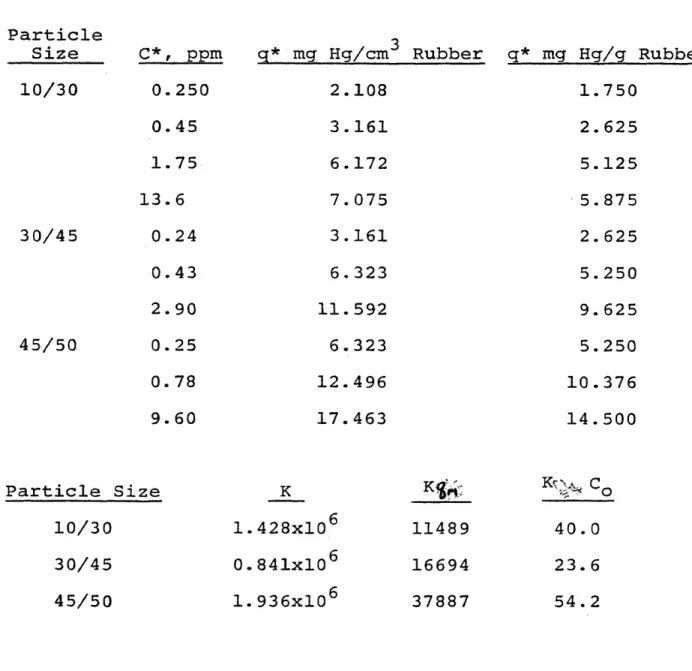
Plots of the equilibrium isotherms for mercury on waste rubber are shown in Figure 2 to be favorable and highly non
E Q U IL IB R IU M |$ Q T H E R M (2 3 *5 0 ) LO X X x c/v </f c/f r— CO ^ O Q < o 00 to o COi 04 C-or CL. 0. •*e **• o CM CM* u a a a n u c ia jo /6 h s ia iv u d itiii/v i *.b Figu re
become relatively flat suggesting a Langmuir type isotherm, Kq„c*
rr* - M
q* =
1+KC*
This equation may be readily rearranged to give
1 - 1 (h*> + K
q* KqM C* KqM
In this rearranged form the coefficients (1/Kq^) and (I/K) may
be determined by a least squares regression analysis. Once
obtained, the coefficients may be appropriately inverted and matched to the experimental data. As shown in Figure 2 the Langmuir model fits the experimental data very well and illus
trates the nonlinear isotherm behavior. Values for the
experimental data along with the Langmuir constants for the three particle sizes are given in Table IV.
Computer Analysis
If external mass transfer does not control the adsorp tion behavior, intraparticle diffusion usually does control, especially at higher flow rates and higher fluid concentra
tion. A model assuming complete diffusional control and Lang
muir isotherms was outlined in the theory section. A com puter program implementing this model was written and curve matches between the finite difference solutions and experi
mental breakthrough curves were attempted. Good results were
obtained for the smaller particle sizes. Curve matches for
the 10/30 mesh size gave increasing diffusivities with longer
times and longer column lengths. The varying effective
Table IV
Equilibrium Isotherm Data and Langmuir Constants Q Hg on Ground Rubber at 23.5 C Particle Size 10/30 30/45 4 5/50 C * , ppm 0.250 0.45 1.75 13.6 0.24 0.43 2.90 0.25 0. 78 9.60 q* mg Hg/cm Rubber q* mg Hg/g Rubber 2.108 3.161 6.172 7. 075 3.161 6. 323 11.592 6.323 12.496 17.463 1.750 2.625 5.125 5.875 2.625 5.250 9. 625 5.250 10.376 14.500 Particle Size 10/30 30/45 45/50 K 1.428x10 0.841x10⁶ 1.936x10 11489 16694 37887 cQ 40.0 23. 6 54. 2
the larger particles.
The numerical results were plotted on semilog paper with the ordinate 0=C/CQ while the abscissa was 9T /n = 2mv(t-Z/v)/
2
(3Kqm ) and is parametric in n = 3DZKqm /(mvRD ). The abscissa was plotted as 9T/n rather than just ©T to provide for com pletely dimensionless coordinates and to condense the curves so they could be utilized more effectively. For each experi mental run 0 = C/Co was plotted as a function of time on
semilog paper to the same scale as the theoretical curves. The experimental breakthrough curves are presented in Figures 3, 4, and 5 with the corresponding theoretical curves being given in Figures 6 , 7 , and 8.
Due to the diffusivity involved, a least squares fit of the theoretical curves to the experimental data was not attempted; computer run times would have been excessive and some scatter in the experimental data could have resulted in curve matches with the wrong shape curve but with a minimum sum of squares of the deviations.
Two methods may be used to calculate values for the overall intraparticle diffusivity once a curve fit of the experimental data to the theoretical curves is made; both methods should give the same numerical result if the curve matches are exact. One method is to calculate the diffusion coefficient from
2
r\ - 3DZKqm /(mvRD ). Values for n are obtained from the curve
fit while the bed height, velocity, particle size, and void fraction ratio are all measured. Kqm is the first Langmuir constant obtained from the least squares fit of the experimental
E XPE RI M EN TA L B R E A K T H R O U G H C U R V E S M E R C U R Y O N G R O U N D R U B B E R I1 0 /3 0 U .S . ME SH ) CM CO r* oo o LO lO CT) O 00 CO lO CO o m th u k c a ke s LIBRARY COLORADO S C H O O L of MINES SQLDENb CODGBABO 10 0 1 0 0 0
e x p e r im e n t a l b r e a k t h r o u g h c u r v e s M E R C U R Y ON G R O U N D R U B B E R I3 0 /4 5 U .S . M E S H ) oo 00% © u> o o o CO © CO M 10 0 1 0 0 0 1 0 0 0 0 TI M E, M IN
E X P E R IM E N T A L B R E A K T H R O U G H C U R V E S M E R C U R Y ON G R O U N D R U B B E R (4 5 /5 0 U .S . M E S H ) CM 00 o u> u> O) • . o 00 o in o o CO o
ARTHUR EAKES LIBRARY COLORADO SCHOOL of MINES
GOLDEN, COLORADO BQ4QJ 1 0 0 1 0 0 0 1 0 0 0 0 T I M E M I N
LU >• o < ° 2 <n OC o CO CM £ c 5 o CO IX) uj -; X ^ o CO CO o o Fi g ur e
o to UJ e>t CM to UJ o £ « to f- II UJ o ce o UJ o CT o GO CO
[ARTHUR EAKES LIBRARY COLORADO SCHOOL of MINES
QQLDEN, COLORADO 6Q4QL F i g u r e
LU in o 10 LU C GC O. CO 00 CO o o F i gu r e
isotherm data. All quantities are thus known except for the diffusion coefficient which may be calculated explicitly. The second method is to calculate the diffusion coefficient
2
from values of ©T = (2D/Rq )©. For given values of C/CQ , read values of © from the experimental data. The diffusion
2
coefficient may then be calculated as D = ©mR /(2©). As T o
previously mentioned the methods are not independent for exact curve fits. Some problems existed in the early calcu- lational stages in obtaining the same number for the diffu sion coefficient using both methods; another more exact approach was sought as a means of satisfying both methods without excessive trial and error.
Since both methods are not independent, a simultaneous solu tion was sought. It was found that by dividing ©T by n to
eliminate the diffusion coefficient that a numerical value of ©T/ri could be obtained from the experimental data. This ratio is the abscissa of the theoretical curves. Values of 0 must be specified in order to obtain the experimental data; the same value of 0 is used on the theoretical curve. A point can now be located on the theoretical curve since both ©T/n and 0 are known. The curve passing through this point has a unique value of n associated with it from which the diffusion coefficient may be calculated.
Only a selected number of theoretical curves parametric in n could be generated due to the high cost of executing the
computer program. A means of interpolating between the gen
the value of n corresponding to the curve through the point located by the procedure outlined in the preceding paragraph. It should be noted that a linear interpolation provided a very poor correlation between n and ©T/n. A plot of log(n) versus log(©T/n) was made and parallel straight lines resulted which were parametric in C/CQ . The log correlations for each experimental isotherm may be found in Figures 9, 10, and 11.
The procedure for obtaining the diffusion coefficients may be broken down into four steps which are outlined below.
1) At a fixed value of 0 = C/CQ on the experimental breakthrough curve, find the corresponding value of © (time). Substitute values for Z, v, m, Kqm , and ©
into ©T/r) = (2mv/3Kqm Z ) ©.
2) Given the calculated value of ©T/n and 0 find the
corresponding value of n from the plot of log n versus log 0T/n.
2 3) Calculate the diffusion coefficient, D = (mvR^ /
3Kqm Z )n *
4) Repeat this process for other values of 0.
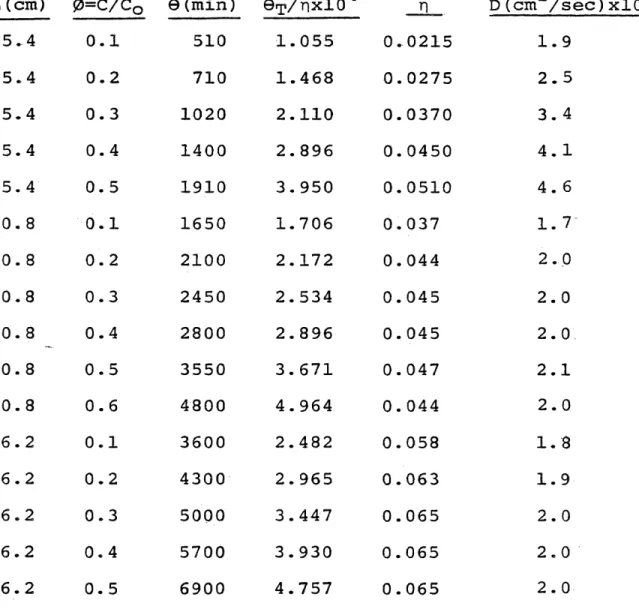
Tables V, VI, and VII list the results of the analysis described above for each of the three respective particle
sizes. Diffusion coefficients corresponding to column heights
of 25.4, 50.8, and 76.2 cm were calculated and are shown in
the table along with the appropriate value of 0. Definite
H. v e r s u s e/^l (10/30 u.s. m e s h ) 10 0.1 0.01 -5 -4 ■3 ■2 10 10 10 10 Figure 9
ARTHUR CAKES LIBRARY COLORADO SCHOOL of MINEb
\ V E R S U S Q / \ (30/45 U.S. M E S H ) 10 0.1 0.01 ■1 -2 r3 10 10 10 10 Figure 10
’t V E R S U S 0 7 ^ ( 4 5 / 5 0 U S. M E S H ) 10 0.1 0.01 -2 -3 “ 4 -5 10 10 10 10 Figure 11
Table V
Diffusion Coefficients for 10/30 Mesh
L(cm) 0=C/Co e(min) 9t/ nxlO5
25. 4 0.3 44 1.322 25.4 0.4 115 3.456 25.4 0.5 240 7. 213 25.4 0.6 385 11. 57 50.8 0.2 170 2. 554 50. 8 0.3 270 4'. 057 50.8 0.4 385 5.785 50. 8 0.5 1000 15.03 76.2 0.2 880 8.815 Particles n 0.00465 0.0121 0.0195 0.0205 0.0099 0.0171 0.0222 0.0490 0.0143 D ( c m ^ / s e c ) x l O ^ 5.6 14. 5 23.4 24. 6 5.9 1 0
.
2 13.3 29.4 5.7Table VI
Diffusion Coefficient for 30/45 Mesh Particles
L (cm) 0=C/Co 0 (min) ©■p/rixlO4 n D(cm /se2 ,
25. 4 0.1 510 1.055 0.0215 1.9 25.4 0.2 710 1.468 0.0275 2.5 25.4 0.3 1020 2.110 0.0370 3.4 25.4 0.4 1400 2. 896 0.0450 4.1 25. 4 0.5 1910 3. 950 0.0510 4.6 50. 8 0.1 1650 1.706 0.037 1. 7 50. 8 0. 2 2100 2.172 0.044 2.0 50.8 0.3 2450 2. 534 0.045 2.0 50. 8 0.4 2800 2.896 0.045 2.0 50. 8 0.5 3550 3. 671 0.047 2.1 50. 8 0.6 4800 4.964 0. 044 2.0 76. 2 0.1 3600 2.482 0.058 1.8 76.2 0.2 4300 2.965 0.063 1.9 76.2 0.3 5000 3.447 0.065 2.0 76.2 0.4 5700 3.930 0.065 2.0 76.2 0.5 6900 4.757 0.065 2.0
Table VII
Diffusion Coefficients for 45/50 Particles
L (cm) 0=C/Co © (min) ©ip/nxio4 n D ( c m 2/sec)xl012
25.4 0.1 960 0.875 0.108 2.0 25.4 0.2 1250 1.139 0.134 2.5 25.4 0.3 1450 1.321 0.132 2. 5 25.4 0.4 1700 1. 549 0.140 2.6 25.4 0.5 2000 1. 823 0.132 2. 5 50. 8 0.1 2700 1.230 0.165 1.5 50. 8 0.2 3100 1. 413 0.175 1.6 50. 8 0.3 3500 1.686 0.170 1. 6 50. 8 0.4 3900 1.777 0.165 1.5 50. 8 0.5 4800 2.187 0.162 1.5 50.8 0.6 6600 3. 007 0.170 1. 6 76.2 0.1 4600 1.397 0.192 1.2 76. 2 0.2 5100 1. 549 0.200 1. 3 76.2 0.3 5700 1.732 0.195 1.2 76.2 0.4 6600 2.005 0.195 1. 4 76.2 0.5 7800 2.369 0.180 1.1
ARTHUR IBICES LIBRARY
DISCUSSION COLORADO SCHOOL of MINF^
GOLDEN, COLORADO 8Q4Qi
This section will be concerned with critical discussions of the experimental data and the applicability of the theoret ically derived results to the system of interest. Analysis of the isotherm model, diffusion model, external mass trans fer effects, and accuracy of the experimental data are
included in this section. Measurement of the physical proper
ties of the system are analyzed first.
Experimental Data
Measurement of the mercury concentration in solution is believed to be the most inaccurate portion of the experi mental data for a number of reasons. First of all, mercury is an extremely volatile metal (0.001 mm Hg at 18°C rising to 0.27 mm Hg at 100°C). The high volatility of mercury inter feres with normal atomic absorption detection methods for
trace metals. In this method the aqueous sample is heated
to 120°C to drive off water; the residue is then atomized at
2200°C. Since mercury is so volatile many investigators
believe some mercury is vaporized during the drying step, thus yielding low readings for the mercury concentration in solution. The method of Issaq and Zielinski seeks to overcome this problem by stabilizing the mercury ions with dilute
hydrogen peroxide thus preventing the evolution of mercury vapors during the drying step.
Even with the stabilization of mercury in the analysis step, another question can be raised as to losses of mercury