Swedish Equity Mutual Fund Performance
A comparison between mutual funds provided by banks and their non-bank counterpart
Paper within Master Thesis Business Administration
Author: Filip Agerberg Backlund 870919-0113
Magnus Pettersson 870304-3318
Tutor: Per-Olof Bjuggren
Louise Nordström
Acknowledgements
Firstly we want to thank Morningstar for providing us with all necessary information and data used in this study. Without their help this thesis would not have been possible. Secondly we want to express our thankfulness to our tutors Per-Olof Bjuggren and Louise Nordström for being supportive and guiding us during the work of this thesis. Last but not least, we want to show our gratitude to our fellow students and Mats Agerberg for providing valuable feedback and comments on the study and helping us develop the thesis to what it is today.
Filip Agerberg Backlund Magnus Pettersson
Master Thesis within Business Administration
Title: Swedish Equity Mutual Fund Performance – A comparison between mutual funds provided by banks and their non-bank counterpart
Authors: Filip Agerberg & Magnus Pettersson
Tutor: Per-Olof Bjuggren & Louise Nordström
Date: May 2012
Key words: Equity Mutual Funds, Risk Adjusted Performance, Sharpe Ratio, RAP,
Jensen’s Alpha, Bank, Other Fund Companies
Abstract
The fund market has increased in popularity over the past two decades. Today the majority of the highest asset funds on the Swedish market are managed and owned by banks. On the other hand, media is frequently publishing ranking lists and newsfeeds presenting the poor mutual fund performance of funds managed by banks. The purpose of this study is to examine and analyse the performance of Swedish equity mutual funds in order to see whether funds managed by non-bank fund companies outperform their bank counterpart. The study uses monthly NAV rates to calculate different performance measurements and finds that the funds managed by other fund companies achieves higher risk-adjusted performance compared to funds managed by banks.
Table of Contents
Acknowledgements ... i
Abstract ... ii
1
Introduction ... 5
1.1 Background ... 5 1.2 Problem ... 7 1.3 Purpose ... 72
Frame of Reference ... 8
2.1 Risk and Return ... 8
2.1.1 Modern Portfolio Theory ... 8
2.1.2 CAPM ... 9
2.1.3 Beta ... 10
2.1.4 Jensen´s Alpha ... 10
2.1.5 Sharpe Ratio ... 11
2.1.6 Risk-Adjusted Performance (RAP) ... 11
2.2 Efficient Market Hypothesis ... 12
3
Method ... 13
3.1 Research Approach ... 13
3.2 Selection of Fund Market ... 13
3.2.1 Laws & Regulations ... 13
3.3 Index as a Benchmark ... 14
3.4 Selection of Funds... 14
3.5 Fund Categories ... 15
3.6 Selection of Time Span ... 16
3.7 Data Collection ... 16
3.8 Performance Measurements - Return ... 16
3.8.1 Security Market Line ... 17
3.8.2 Risk Adjustments ... 17
3.9 Risk-Free Rate of Return ... 19
3.10 Hypothesis testing ... 19
4
Results ... 20
4.1 Accumulated Return ... 20
4.1.1 Significance test – Accumulated Return ... 21
4.2 Standard Deviation ... 21
4.2.1 Significance test – Standard Deviation ... 22
4.3 Sharpe Ratio ... 22
4.3.1 Significance Test – Sharpe Ratio ... 23
4.4 RAP – Risk Adjusted Performance ... 24
4.4.1 Significance Test – Risk Adjusted Performance ... 24
4.5 Jensen´s Alpha ... 25
4.5.1 Significance Test – Jensen’s Alpha ... 25
4.6 Beta ... 26
4.6.1 Significance Test – Beta ... 26
4.7 T-test Summary ... 27
4.9 Security Market Line ... 28
5
Analysis ... 30
6
Conclusions ... 33
7
Suggestions for Further Research ... 34
References ... 1
Appendices ... 5
Appendix 1 ... 5
Appendix 2 – Arithmetic Average ... 6
Appendix 3 – Geometric Average ... 7
Appendix 4 – Risk free rate ... 8
Appendix 5 – Yearly STD ... 9
Appendix 6 – Sharpe Ratios ... 10
Appendix 7 – RAP ... 11
Appendix 8 – Ratio summary ... 12
Introduction
1
Introduction
"People exaggerate their own skills. They are overoptimistic about their prospects and overconfident about their guesses, including which managers to pick."
- Professor Richard Thaler, University of Chicago
In December 2011, statistical data from the Swedish Investment Fund Association shows that the total of the Swedish fund assets placed in equity funds equals MSEK 933 118. Whereof, MSEK 795 547 is invested in funds registered in Sweden and 262 070 is placed in funds that only invest in Swedish companies (Swedish Investment Fund Association, 2011a). Since the interest for mutual funds among the society is still growing and people are searching for ways to invest or save money, one might want to know whether to rely on the trustworthiness that larger banks often have towards their customers, or turn to non-bank fund managers to get the highest return for the exposed level of risk on the investment.
Investing in equity mutual funds will make the investor partial owner of every asset within the fund. Each fund has a predetermined investment objective that is customised for investments strategies and regions of investments. The two types of management strategies are active and passive management where the active management objective is to realise a higher return than the market. This management strategy implies yearly management fees to cover the costs related to the manager analysis costs. An equity mutual fund is restricted by regulations from the Swedish financial supervisory authority to invest at least 75 percent of the total value in Swedish or foreign stocks (Swedish Financial Supervisory Statutes, 2008:11)
While investigating the fund assets of all Swedish equity mutual funds, we can see that the large banks owns of almost every high asset funds provided on the market (Morningstar 2012d). Based on this we can assume that most people prefer to invest their own assets in funds provided by large banks instead of the other fund managers. Meanwhile, media frequently publishes articles and news concerning the poor performance of bank managed funds and strong performance of non-bank fund companies. Hence, this study aims to compare the funds managed by the different financial institutions to see if we can confirm such performance differences.
1.1
Background
1958 was the year the first fund was introduced in Sweden and in 1984 Swedish citizens started to invest in the public saving programs1. These funds made investors discover the significance of what consistent savings can give in return. (Swedish Investment Fund Association, 2011a)
Today there are over 4000 funds on the Swedish market and its total value reaches SEK 1 200 billion (Swedish Investment Fund Association, 2011a). The principal reason for the large number of funds available on the market is the popularity of the fund market, that most
Introduction
reasonable has developed through the simplicity that funds can offer. The idea to invest in individual stocks and achieving a well diversified portfolio with only one investment might be appealing for any non-informed individual. Also, investing in funds has shown to be more lucrative than depositing money into a savings account with a significantly lower rate of return. When investing in a fund, the investor is exposed to certain risk that does not exist in a savings account alternative. Most individuals have their money deposited in bank accounts and feel reliance towards the bank’s ability to hold their capital. This reliance could make banks the natural choice when investing in funds not even considering other fund companies as an option. Banks often have built a brand implying that they are known and accepted giving them a broader base of potential investor. This does not necessarily imply that banks are the better alternative when considering fund investment.
For a fund manager there are two principal strategies when managing a fund. One is active management, which aims at analytical research and beating the market. The other strategy is passive management or also known as index management that aims to mirror the market index. (Swedish Investment Fund Association, 2011e)
Bogle and Twardowski (1980) examines difference in performance between four institutional groups; banks, insurance companies, investment counsellors and mutual funds on the American market. The authors conducted 52 individual comparisons between the different institutions on different time intervals. This resulted in the conclusion that an individual investor relying solely on mutual funds significantly out-performed the other institutions ability to provide investment management services. The banks’ inconsistent ability to provide these services was in 1995 supported in a similar study by Bauman and Miller. Frye (2001) contradicts the results of Bogle and Twardowski (1980) and Bauman and Miller (1995) by examining the performance of bank owned bond mutual funds and non-bank owned bond mutual funds. The author finds no statistical evidence that the former underperform the latter. However, findings that the banks are related to a more conservative management strategy compared to the non-bank funds are found.
Dahlquist, Engström and Söderlind (2000) made a study between funds performance and funds attributes in the Swedish market. Their performance was measured in terms of alpha in a linear regression of funds return on several benchmark assets. The research is taking fund performance and fund attributes into account. The attributes investigated are past performance, flows, size, turnover and proxies for expenses and trading activity. By using Jensen’s alpha and a cross sectional analysis, the authors found that funds with a small amount of capital had a somewhat better performance than funds with a larger capital.
In an article by Matallin, Soler-Dominguez and Tortosa-Ausina (2012) the authors examines the possible difference in performance of mutual funds provided by banks and independent managers in the Spanish market. When executing the study, the authors take several factors into consideration which are: active management, loads, size and number of funds managed by per manager. Performance was measured through an extension of the Capital Asset Pricing Model considering beta as the only risk factor. They concluded that independent managers
Introduction
were able to outperform the bank managers. They also confirmed the existence of actively managed funds that succeeds to beat the market index.
1.2
Problem
“Mutual funds were created to make investing easy, so consumers wouldn't have to be burdened with picking individual stocks.”
- Scott Cook
Before investing in a fund it is important to evaluate and investigate which fund that optimises your objective. On one hand, with a large variety of funds active in the market, it is not easy to make a correct evaluation and it can be problematic to decide which fund to invest in. On the other hand, the large supply of funds also creates opportunities for the investor to find the most suitable fund for every individual (Steiner, B., 2007). Mutual funds have recently been an increasingly popular form of investment that concerns the majority of the world population. Therefore we think there is a need to evaluate the risk-adjusted performance of equity mutual funds managed by banks and funds managed by other fund companies to see if it is more rewarding to invest in a fund managed by a non-bank fund company.
1.3
Purpose
The focus of this study lies within investigating whether there is a difference in return between actively managed equity mutual funds provided by banks and by non-bank fund companies. The purpose is to analyse if it is more rewarding to invest money in funds managed by the banks or other companies.
Banks also offer other services than mutual funds, such as loans, insurance contracts, saving accounts etc. Non-bank fund companies most often do not offer any other services, apart from managing funds. Therefore banks can rely on maintaining their customers in other terms than fund performance. This is a potential reason that banks perhaps do not have to put as much effort in the fund management as other companies, which can result in poorer fund performance. We cannot prove a difference in fund management effort between banks and independent fund companies but we can investigate if a difference in performance exists. The majority of earlier studies within this field of investigation take the fund size aspect into consideration when conducting a comparison of fund performance. However, some studies are actually investigating the difference in performance between bank managed funds and their non-bank counterpart, whereof the majority are made on the U.S market. Also, they are considering management strategies as a factor of performance. We will focus solely on the performance of the funds of the two groups active on the Swedish market. The equity mutual funds included in the research all have a max limit of SEK 100 000 in starting deposit when investing in the fund. The reason for this is to make the research applicable for the group of smaller investors. Hence, this study targets towards increase the understanding for small individual investors whether to invest in funds managed by banks or other companies.
Frame of Reference
2
Frame of Reference
The following section seeks to describe and provide an in-debt review of the models, theories and definitions used in this thesis in order to give the reader the ability to grasp the whole picture when interpreting the final result.
2.1
Risk and Return
Investors take on risk in order to achieve return. Due to this, it is important to be aware of the risk exposure related to a certain investment. Risk is generally known as uncertainty of expected return and this uncertainty is better described as variability. Investors want a higher expected return with increased variability, meaning that risk and variability are correlated. A well known measure of variability is standard deviation, which measures the volatility of a security. (Simons, 1998).
The return of mutual fund investments is defined as income in form of dividends or interest payments, and capital gains or losses (Simons, 1998). The average return, or mean, is used to calculate the standard deviation of the fund. This can be achieved by calculating an arithmetic or geometric mean. The arithmetic mean measures the return of an investment that is held constant at the initial level whilst the geometric mean measures return of an investment as in each period will grow at precisely the rate of the portfolio (Modigliani, F., Modigliani, L. 1997).
2.1.1 Modern Portfolio Theory
The modern portfolio theory has its origin in the article ”Portfolio selection” which was published in The Journal of Finance in 1952 by Harry Markowitz. He developed the theory while he was studying the effects of risk, return, correlation and diversification on portfolio returns. Markowitz (1952) was reflecting over that investors had one thing they were interested in and that was the value of the portfolio, and in order to maximize that value, the only thing the investor needed to do was to invest in one single security – the one with the best return. But he concluded that this is not the way investors invest. Investors deposit their money in different securities since they are interested in minimizing risk as well as in maximizing return. This means that if one security yields a negative return, everything will not be lost as you still have investments in a number of other securities. This is a way to spread the risk in the portfolio, which is in line with the assumptions of the modern portfolio theory, i.e. how to maximize the expected return of the portfolio for a given amount of risk. This is referred to describing diversification, which means reducing risk by investing in different assets. In other words, do not lodge all of your eggs in one basket. (Fabozzi, Gupta and Markowitz, 2002).
Modern portfolio theory demands an understanding of three factors; the expected return of the portfolio, the risk of each element of the portfolio and the way each behaves in relation to the other (Shipway, I., 2009).
Frame of Reference
Investors are rational and want to achieve a return in proportion to the given risk.
All investors are risk averse. i.e. investors are willing to take any risk, but given two assets that offer the same expected return, they prefer the one with lowest risk (Shipway, I., 2009)
When investors fulfil the key assumptions, managers can determine an optimal portfolio for their clients. First, they select a set of asset categories as large- or small cap for instance. Then they generally start with historical performance of the index representing these classes to obtain estimates of returns, volatilities and correlations. The estimates are then used as inputs in the mean-variance optimization, which can be explained as the efficient frontier (see Figure 2-1). Then the portfolio is implemented using either index or actively managed funds strategy (Fabozzi, Gupta and Markowitz, 2002).
Figure 2-1 The Efficient frontier.
(Green, C. R., 1986)
According to modern portfolio theory, the most efficient portfolio is achieved by investing at a point where the risk free and borrowing rate is tangent to the efficient frontier. This is where one will have the highest expected return given risk. In Figure 2-1 Rf represents the risk free rate, MVP is the minimum variance portfolio. The y-axis is represented by expected return and the x-axis by standard deviation (Fabozzi et. al, 2002)
2.1.2 CAPM
The Capital Asset Pricing Model (CAPM) was introduced in the mid-1960s by William Sharpe and John Lintner, which resulted in Sharpe receiving Nobel Prize in 1990. Today, the CAPM is widely used in investment applications, such as risk evaluation, performance assessment of managed portfolios and asset pricing. The CAPM offers predictions about risk measurements and the relation between expected return and risk, but the model´s record is unfortunately poor. Its empirical problem probably reflects both the difficulties in its
Frame of Reference
implementation and its theoretical failings, due to many simplifying assumptions (Hirschey, M., Nofsinger, J., 2008).
CAPM is considering the portfolio total risk consisting of two types of risk; systematic and unsystematic risk. The former involves risk between portfolio and market return, market risk, whilst the latter is the internal risk of the portfolio return. In a diversified portfolio the unsystematic risk is small, thus the total risk will mostly consist of the systematic risk (De Ridder, 2003).
The security market line (SML) illustrates the results from the capital asset pricing model where the x-axis represents the beta value and the y-axis represents the expected return. SML intercept the y-axis at the risk free rate and the risk premium gives the slope of the line. If a security is plotted above the SML then the security will yield high return in relation to its risk, the stock is undervalued. The security market line is based on that all securities will have the same amount of risk premium at a certain point in time. (Green, C. R., 1986)
2.1.3 Beta
The systematic risk can be defined as β (beta) of the portfolio and implies risk between the portfolio and the market. Since the beta covers market related risk it cannot be removed through diversification. β is an important part of the CAPM and the calculations of Jensen’s alpha (De Ridder, 2003). Beta is a measurement of sensitivity since it evaluates how the portfolio reacts to fluctuations in the market portfolio. A β-value of 1 implies that the portfolio exactly follows the fluctuations of the market. If the β-value is 1,5 it implies that the portfolio is reacting stronger than the market to fluctuations, i.e. if the market increases by 10% then the portfolio would increase by 10%*1,5=15%. Similarly a decrease in the market of 10% would result in a decrease of the portfolio by 15%. If the β-value is less than 1, say 0,5 then the portfolio is less sensitive to changes in the market. If the market would increase by 10% then a portfolio with a β of 0,5 would increase by 10%*0,5=5% (Morningstar, 2012a)
2.1.4 Jensen´s Alpha
Michael Jensen first introduced Jensen´s alpha also known as the Jensen´s Performance Index in the 1960s. He introduced alpha to evaluate performance of fund managers, to see if there was a difference between the actual return of the portfolio during a period and expected return of the portfolio by using the Capital to asset pricing model (CAPM). The definition of alpha is the actual return compared to the expected return based on the systematic risk (beta). A positive alpha indicates that the development of the fund has been better than the given beta. Let us say a fund has an alpha value of -1.2, a beta of 0.97. Then the negative alpha says that the fund performed 1.2% poorer than the beta had predicted. On the other hand, if the alpha would have been 1.2, then it tells us that the fund has performed 1.2% better than the beta had predicted. The higher the alpha, the better the fund has performed relative to its beta. (Morningstar, 2012b)
Frame of Reference
2.1.5 Sharpe Ratio
There are numerous approaches of measuring portfolio performance. Nobel price winner William F. Sharpe introduced the Sharpe-Ratio, which is measuring risk-adjusted performance of a portfolio (Sharpe, 1966). This performance ratio has become one of the most frequently used ratios when measuring portfolio performance (Andrew W. Lo, 2002). The ratio is constructed through a risk and performance relationship measurement by James Tobin. Sharpe constructed the ratio as a reward-to-variability ratio, i.e. a ratio that describes reward per unit of variability. In 1994 Sharpe modified the ratio to make it measure what it does today; expected return per unit of risk.
To clarify the use of the measurement, when comparing two portfolios considering return as the only factor, the result is considered biased, therefore it is important to take risk into consideration (Simons, 1998). Because of the fact that a rational investor seeks the highest return for exposed level of risk, the risk cannot be ignored (Morningstar, 2012c). For a comparison between two different portfolios to be possible, adjustments for risk have to be made. When using the Sharpe ratio it is possible to compare different portfolios carrying completely different risk levels but also with different correlation to an index benchmark (Simons, 1998). An assumption that needs to be fulfilled in order for two different Sharpe ratios to be comparable is that the funds in subject of the comparison need to invest in the same market. The reason for this is the fact that what may be considered as a good Sharpe ratio differs from market to market (Morningstar, 2012c). A positive Sharpe ratio implies that the portfolio generates greater return than the risk-free asset. On the other hand, a negative Sharpe ratio implies that the return of the portfolio is lower than the return of the risk free asset. Comparing two different portfolios, the one with the highest Sharpe ratio is preferred (Morningstar, 2012c).
2.1.6 Risk-Adjusted Performance (RAP)
When interpreting the Sharpe ratio there can be some difficulties when trying to analyse return differentials between portfolios. This is the case both for the Sharpe ratio and the Treynor ratio, and can be seen as a disadvantage in using these models (Scholz, H., Wilkens, M., 2005).
Modigliani and Modigliani propose a different measurement, compensating for this problem. In 1997 they presented the Risk-Adjusted Performance measurement, which is being expressed in basis points for the different portfolios. The risk-adjusted performance of portfolio i (RAPi) can be compared to the market average return rm in order to show whether
the portfolio has out- or underperformed the market expressed in basis points (Modigliani, F., Modigliani, L. 1997).
The RAP is computed through increasing or reducing the amount of leverage of the portfolio in interest for the analysis. Levering a portfolio implies that the investment in the portfolio is being increased through borrowing. This will both result in an increase of portfolio risk and an increase in expected return. To clarify, if we invest an additional amount of d% in the portfolio then the risk and expected return will increase by d%. Reducing the leverage of the portfolio on the other hand implies selling parts of the portfolio and using the additional
Frame of Reference
earnings to invest in a risk free security. This will decrease the portfolio risk but also the expected return by d% (Modigliani, F., Modigliani, L. 1997).
The reason for increasing or reducing the leverage of the portfolio is to make it risk-equivalent to the market, i.e. making the risk of the portfolio matches the risk of the market. This can also be made by transforming the Sharpe ratio into terms of absolute performance (Scholz, H., Wilkens, M., 2005).
2.2
Efficient Market Hypothesis
A well-debated theory within discussions of finance is the Efficient Market Hypothesis. In short, the theory is based upon the assumption that the price of a security is a reflection of known information about that specific security. I.e. if new information becomes available about a company, the price of that company’s securities will be directly and rationally adjust according to the new information. If the new information is positive, then the price of the security will increase. If the information is of negative nature it will decrease. (Fama, 1970) This implies that in an efficient market, prices of the securities would be a reflection of all already known information. The only way for prices to change is when new information about the company is released. New information is considered impossible to predict, and therefore the future price of a security is impossible to predict. This is where the theory of “Random Walks” is being introduced which is built on the assumption that all future prices are completely random. (Malkiel, 2003)
Fama (1970) divides the market into three different efficiency levels; weak, semi-strong and, strong form.
1. In the weak form of the efficient market hypothesis, prices are reflected only on historically available information (Fama, 1970). Hence it does not support the usage of technical analysis to add further value to an investment.
2. The semi-strong form states that prices reflect all available information and that new information immediately changes prices (Fama, 1970). This means that public information that is being released will have an immediate impact on prices that implies that fundamental analysis adds no value to the investment.
3. For the strong form of the market hypothesis, prices are reflected by all available information, including insider information (Fama, 1970). Because of the fact that all information is included in the price, fundamental analysts´ work is not a value adding process (Malkiel, 1999)
Method
3
Method
This part will further describe the implementation of the models and measurements. We will also describe the process of sampling, determination of a benchmark and time span.
3.1
Research Approach
When conducting a research as this we found that the most useable approach would be the deductive. A deductive research implies starting with an assumed hypothesis, expressing it in operational terms and testing it and finally examining the test results to see if any modifications can be made to the theory when spreading the light of the actual findings (Saunders, Lewis and Thornhill, 2009).
Subsequently we will use quantitative data for our study. Using qualitative data, as interviews, for a study concerning fund performance would result in the study being more focused on managerial strategies and valuation methods of the managers. Since most managers keep their fund management strategies confidential, a qualitative approach is related to uncertainty. Historical data of returns is not confidential. Also this suits the purpose of this context; to see if the non-bank fund companies have managed to perform better than the banks in terms of funds return. Conclusively, the use of the deductive method is to prefer in a study as this (Saunders, Lewis and Thornhill, 2009).
According to Saunders, Lewis, and Thornhill (2009) a characteristic of the deductive method is generalisation. In order to be able to generalise in a deductive method it is necessary to have sufficient sample sizes. Our sample sizes consist of monthly data for the last 10 years. We have 120 observations in each sample that can be considered sufficient for this study.
3.2
Selection of Fund Market
According to the Swedish Investment Fund Association (2011d) the most substantial market for funds are growing markets and the Swedish market has been in the top of the list during the past 20 years. After selecting a market for our investigation we decided to, in order to get a fair overall picture, to concentrate the study on the Swedish market. What is advantageous with that is that law under the EU directives regulates all European funds (further described in the next paragraph). Hence, this is binding regulations for all EU members and therefore the results of this study can be interpreted by other EU-countries (Swedish Investment Fund Association 2011b).
3.2.1 Laws & Regulations
An update to the UCITS-directive (Undertakings for Collective Investment in Transferable Securities) was incorporated in the Swedish legislation in 2011, UCITS IV. The reasons for the incorporation of UCITS are to simplify the comparison between Swedish funds and other funds within the European Union and to reduce administration and costs, etc. Apart from the UCITS-directives the Swedish law also contains national regulations that only apply to Swedish funds. (Swedish Investment Fund Association, 2011d).
Method
3.3
Index as a Benchmark
Measuring the performance of portfolio managers is of great interest for investors and financial analysts. Previously performance was evaluated by comparing return of a managed portfolio and an unmanaged portfolio chosen randomly. In a later stage a more efficient method of evaluating performance was introduced, the manager’s performance was compared to a benchmark of an unmanaged market (Modigliani, F., Modigliani, L. 1997). According to Simons (1998) when executing a performance ranking there are two important issues to be considered; how to choose a suitable benchmark for comparison of the funds and finding a way of risk adjusting the different funds. (Simons, K., 1998)
When selecting an index we had to consider whether to use an index that take reinvestment into account or not. A non-reinvestment index takes only the growth of the security values within the index into account. However a reinvestment index also make count for the dividends made during the period. According to Bailey (1992) good benchmarks increase the proficiency of performance evaluation, highlighting the contributions of active managers and enhance plan sponsors´ ability to control risk. An assumption that is vital for a benchmark to be suitable is high correlation between the benchmark and the sample funds (Grinblatt, M., Titman, S. 1992).
A suitable benchmark should be describing the development of the market in which the funds are investing in and the average development of the overall funds. Also, when looking at an index benchmark it is of importance that the index follows the same regulations that the funds are in order to get an unbiased comparison. Looking at different indexes available we concluded that the most suitable benchmark for this study is the SIXPRX index (SIX Portfolio Return Index) given the prior requirements. This index shows an average development with respect to reinvested dividends of the OMX index, but it also make adjustments for the different limitations affecting the equity fund market (Swedish Investment Fund Association, 2011f).
3.4
Selection of Funds
When computing a fund sample for our research we set some delimitations in order for the study to be unbiased. The delimitations could not make our selection too restricted as we still needed a sufficient number of observations to keep the significance of our research. The delimitations are as follows:
1. The funds in our sample need to be mutual funds, based on the different kinds of funds that are operating under different rules, i.e. special-funds are allowed to act divergent towards some of the rules that mutual funds are limited to. (Swedish Investment Fund Association, 2011e)
2. For our sample we only want to include actively managed funds since passively managed funds are focusing on following a specific index. The managers of actively managed funds attempts to beat the market by investing in securities based on their analysis. (Swedish Investment Fund Association, 2011e)
Method
3. The funds are active on the Swedish market; this delimitation implies that the funds in our sample are only allowed to invest a maximum of 10% in other equity markets apart from the Swedish market.
4. Another delimitation that we found valuable for the study to be unbiased is that the funds in our sample have to been active during the last 10 years. Since, newly started funds are often more sensitive than established funds (Bollen, 2007).
5. We also have a limit in deposit amount of SEK 100 000 as a maximum when investing in the fund. Since our target group is small investors, we had to limit the deposit amount and we assume that SEK 100 000 is the highest amount the society are willing to invest. This assumption is based on the Swedish average income 2010 (Swedish Central Bureau of Statistics, 2012).
From the Morningstar catalogue with a total of 10309 funds we have sorted it down to our sample of 33 funds in accordance to the delimitations.
Funds Managed by Banks Funds Managed by Non-Banks
Banco Hjälp Aktie-Ansvar Sverige
Banco Humanfonden AMF Aktiefond Sverige Banco Ideell Miljö Carnegie Sverigefond Danske Invest Sweden A Catella Reavinst fond Danske Invest Sverige Cicero Sverige Fond SEK DNB Sverige Koncis Eldsjäl Gåvofond Inc DNB Sverigefond Eldsjäl Sverigefond Inc Handelsbanken SBC Bofonden Enter Sverige
Handelsbanken Sverigefond Folksam LO Sverige Nordea Selekta Sverige Folksam LO Västfonden Nordea Sweden Folksams Aktiefond Sverige
Nordea Swedish Stars Folksams Tjänstemannafond Sverige Nordea Sverigefond Öhman Sverigefond
SEB Etisk Sverigefond - Lux utd Länsförsäkringar Sverigefond SEB Sverigefond Stora bolag SPP Aktiefond Sverige Swedbank Robur Ethica Sverige SPP Aktiefond Sverige Aktiv Swedbank Robur Sverigefond
3.5
Fund Categories
After completing the list of funds to be included in this study we wanted to categorise them into bank managed funds and funds managed by other fund companies. The funds sorted in the bank group are managed by companies that provide services as loans, deposits and withdraws from saving accounts, counselling, etc. By searching the different companies websites we computed a complete list of all funds available in appendix.
Of the 33 funds in our selection, 16 funds are sorted into the other fund companies group and 17 funds are in bank managed funds group.
Method
The three funds provided by Banco are actually managed by Swedbank Robur (Morningstar, 2012f). Hence we have decided to sort the funds Banco Hjälp, Banco Humanfonden and Banco Ideell Miljö into the bank group.
3.6
Selection of Time Span
Between the years 2000-2010, the majority of Swedish investors invested principally in equity mutual funds. We have chosen to investigate equity mutual funds within the time span for 2002.01.01-2012.01.01. During this period the total Swedish fund assets has more than doubled. A key reason for this is the significant increase of equity mutual fund investments (Swedish Investment Fund Association, 2011d). We believe that this ten-year period will give us enough information to make an informative analysis with subsequent conclusions and results.
3.7
Data Collection
The data used in this study has been collected from Morningstar, a joint venture between the American company Morningstar Inc. and the Swedish development company Citygate. Morningstar provides services within the fund market such as fund ratings, fund lists, portfolio analysis, etc. (Morningstar, 2012d).
All data is secondary data, disadvantages with using secondary data can occur if the data is collected for other purposes than what it is used for in a specific study (Saunders, Lewis and Thornhill, 2009). However this is not an issue in this study since the data collected are NAV-rates or Net Asset Value-NAV-rates, which is necessary when measuring fund performance. We consider Morningstar a credible source for this sort of data and find no reason to question their reliability.
The data was assembled through collaboration with Morningstar and consisted of daily NAV-rates and dividends for the different funds in our selection. With recommendations from Morningstar, we decided to arrange the data into monthly rates. Also there were days with trading stops that made handling daily data impossible.
3.8
Performance Measurements - Return
The return of an equity mutual fund, or the change in net asset value is calculated through the change in market value/share for a given period including dividends divided with the previous period. The expression of a fund´s monthly return is as follows:
(Simons, 1998). (3-1)
Where Rt is the return for period t, NAVt the Net Asset Value at time t, NAVt-1 is the Net
Method
We have calculated the return of our funds for each month, year and as an annual average on monthly data (appendix2). We made the decision to focus on accumulated return over the period 2002-2012, to make a comparison of each fund and the market for the entire period (appendix 8). We wanted to show the development of each fund over a longer period, to give an overall precise picture. Also, we wanted to study how the funds had performed in terms of accumulated return and compare the results with our ratios. After the calculations of return were made, we compared the results of the funds against each other but also vis-a-vis the index, SIXPRX.
3.8.1 Security Market Line
We have used the security market line to determine if different funds, involved in our study, have outperformed the market and to see if their expected return is in relation to their beta. Since our funds are investing on the same market with similar investment objectives, we thought it would be interesting to study how they perform in relation to each other in terms of beta and average return. To do this we have calculated the beta of the funds included and the average return over a ten year period and then plotted the funds into a graph, with the SML intercepted at the risk free rate. According to CAPM, the funds that are displayed above the SML are undervalued due to given amount of risk, and those plotted beneath the SML curve are overvalued. The formula for SML is as follows:
(3-2) Where Rf is the risk free rate, is the beta or systematic risk of the asset and Rm is the return
on market.
3.8.2 Risk Adjustments
When calculating and comparing performance of different funds, it is crucial to consider the risk taken for the investment. Imagine a comparison between two different funds. Both are generating the exact amount of return but they have different risk-levels. An investor would in this case prefer the fund associated with the lowest amount of risk since the risk adjusted return would be more profitable. This is why most investors are not only interested in return but also the risk associated with the returns where risk is defined as the uncertainty of the expected return (Simons, 1998). According to Simons (1998), the Sharpe ratio is the most commonly used measure of risk-adjusted performance. This measures the fund´s excess return per unit of risk and it is expressed as follows:
(Sharpe, 1966) (3-3)
Where Rp is the return of the portfolio and Rf is the risk-free rate of return. (Rp-Rf) equals the
Method
”Sharpe ratio is used in many contexts, from performance attribution to test market efficiency to risk management” (Lo, 2002, p.36). Also, the accuracy of the Sharpe ratio will differ from different investments and will depend on the investment style of the portfolio. Performance is more difficult to measure as volatility of the investment is increasing, therefore the Sharpe ratio is a more accurate measurement for mutual funds rather than for hedge funds (Lo, W. A. 2002).
As mentioned earlier, to be able to make a comparison with the Sharpe ratio we need the funds to be investing in the same market in order to get a fair comparison. All funds in our sample are investing principally in the Swedish large cap stock market. Hence we can consider the Sharpe ratio applicable to all funds in our sample.
Another method for adjusting risk and to measure performance is Jensen´s alpha. This is a risk-adjusted measurement of the portfolio’s performance and it estimates the ability of the fund manager to contribute to the fund returns. The model is derived from capital asset pricing model (CAPM). Jensen´s alpha indicates if there is a difference in the portfolios actual return and the expected return made by the fund manager. (De Ridder, 2003)
Jensen´s alpha is only considering systematic risk as a risk factor in the model and due to this assumption the relation between the funds and the benchmark must be applicable (Simons, 1998). Since we have a strong relation between our funds and our benchmark, SIXPRX, we decided that Jensen´s alpha could be interpreted as “extra” return for the fund´s level of systematic risk. We also wanted to use a model where risk is reduced. According to De Ridder (2003), one important assumption is that investors follow the market or the market portfolio. Therefore, the only risk that is of interest for an investor is the systematic or market risk. This means that the most correct picture of an investment´s risk is given by the market beta, which is also included in the model. Today this performance index is used widely for measuring the performance of investment of fund managers. The formula can be described as follow:
(2-3)
Where E(Rp) represents the expected return of the portfolio, Rf is the risk free rate, is
Jensen´s alpha, is the beta of the portfolio and RM represents the market return. (Hirschey,
M., Nofsinger, J., 2008)
We will use RAP as another performance measurement to compare the individual funds with each other but also with the market. We will compute RAP by transforming the Sharpe Ratio into terms of risk-adjusted performance by using equation 2-4.
(2-4)
(Scholz, H., Wilkens, M., 2005)
Where RAPi represents the Risk Adjusted Performance for fund i, SRi is the Sharpe ratio of
Method
As the performance is adjusted in terms of risk to match the one of the market it can easily be interpreted and compared. The comparison will be made with RAP computed for the whole period but also for the sub period 2007-2009, i.e. the financial crisis. The comparison of those years will only be made for the top and bottom four funds of our sample in accordance with the results from performance during the total period.
3.9
Risk-Free Rate of Return
The risk-free rate has been computed using the rate for a 90-day treasury bill from the Swedish Central Bank. This is based on the same period as for the time frame of this study. For key figures concerning different time spans, this rate has been adjusted through geometric mean calculations in order to get a rate suitable for monthly and yearly returns (appendix 4).
3.10 Hypothesis testing
The tests will be initiated by individual f-tests for every measurement to test for equal or non-equal variances. Thereafter one-tailed t-tests will be conducted for each measurement assuming equal or non-equal variances in accordance with the f-tests. All tests will be performed at a 95% significance level on our sample size of 33 funds.
The hypothesis stated for the risk measurements will be executed as:
Hypothesis 1
Where µNB is the average risk of non-banks and µB is the average risk of banks.
Since low risk with high return is preferable, we want to study if the funds provided by other fund companies have lower risk than funds provided by banks.
The hypothesis for the performance measurements will be executed as:
Hypothesis 2
Where µNB is the average performance measurement of non-banks and µB is the average
performance measurement of banks.
Since low risk with high return is preferable, we want to study whether the funds provided by other fund companies have higher return than funds provided by banks.
Results
4
Results
In this section the empirical results of the study are presented. Firstly the accumulated return secondly the different risk adjusted measurement will be presented. We will also present the performance of the top and bottom performing funds during the years of the financial crisis. Finally a presentation of the funds placement along the Security Market Line will be made.
4.1
Accumulated Return
When looking at the accumulated return we get an overall view of how the funds have performed in terms of pure returns including re-invested dividends for the whole period. In Figure 4-1a we can see two funds peaking compared to the others. These funds are AMF Aktiefond Sverige and Catella Reavinst fond. Comparing these funds to the index benchmark, represented by the straight line, we can see that the funds in focus managed to outperform the market in terms of absolute return. However, in Figure 4-1b there are two funds that in terms of accumulated returns have been, relative to other funds, performing worst. The funds in interest are both held by Banco but are managed by Swedbank, Banco Humanfonden and Banco Ideell Miljö. During the 10-year period they both generated half the return as AMF Aktiefond Sverige and Catella Reavinst Fond have.
Figure 4-1a Figure 4-1b
From an investor´s point of view it is always interesting to look at a security´s historically return to try to get an estimation of how the security might perform in the future. In our sample of funds we can clearly say that all funds have generated a positive accumulated return during the years 2002 to 2012. Given the accumulated return we can see that the funds that have performed best are funds managed by other fund companies although they are tightly followed by bank managed funds. Only eight of the 33 funds have shown accumulated return above 100% and out of these eight funds there are five funds that are managed by other fund companies and three that are managed by bank managers. There are six of the 33 funds that have shown a return below 80% and all of these are funds managed by banks.
Based on Figure 4-1a and Figure 4-1b, we can confirm that the majority of the funds generated a lower return compared to index. This means that even in terms of absolute returns the majority of funds have not succeeded in beating the index.
Results
4.1.1 Significance test – Accumulated Return
Where µACC RET NB is the average accumulated return of the non-bank group and µACC RET B is
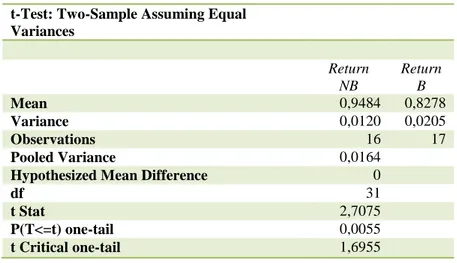
the average accumulated return of the bank group. The outcome of the t-test is shown in Table 4-1. On a 95% significance level we can reject the null hypothesis, that the other fund companies generate less or equal the return as banks. We are able to reject the null hypothesis because of a p-value of 0,0055 that is smaller than the α of 0,05. This is also supported by a t-statistic of 2,7075 which is greater than the critical t-value of 1,6955, hence it falls in the rejection area. This means that in our sample, the other fund companies outperformed their bank counterpart in terms of accumulated return.
Table 4-1: t-Test Accumulated return
t-Test: Two-Sample Assuming Equal Variances Return NB Return B Mean 0,9484 0,8278 Variance 0,0120 0,0205 Observations 16 17 Pooled Variance 0,0164
Hypothesized Mean Difference 0
df 31
t Stat 2,7075
P(T<=t) one-tail 0,0055
t Critical one-tail 1,6955
4.2
Standard Deviation
The unsystematic risk related to the individual funds has been calculated and is shown in Figures 4-2a and 4-2b. Comparing these risks with each other we can see that the risk level is the same for the two different fund managed types. The standard deviation values falls between 0,054 and 0,067 where the market has a standard deviation of 0,06 and is represented by a straight line in the figures. Furthermore, looking at the funds associated with the lowest and highest standard deviations respectively we can see that the funds connected to the highest risk are Nordea Selecta Sweden and Catella Reavinst Fond. The funds associated to the lowest unsystematic risk are Carnegie Sverigefond and Aktie-Ansvar Sverige. Carnegie Sverigefond is also the most deviating fund compared to the others in terms of unsystematic risk.
Results
Figure 4-2a Figure 4-2b
4.2.1 Significance test – Standard Deviation
Where µSTD NB is the average standard deviation of the other fund company group and µSTD B
is the average standard deviation of the bank group. On a 95% significance level we can reject the null hypothesis that fund companies other than banks in general take on higher unsystematic risk than the banks. We can assure this due to the p-value of 0,008 that is lower than the α of 0,05. This is also supported by a statistic of -2,5 that is lower than the critical t-value of -1,69, hence the t-statistic falls within the rejection area. This means that the other fund companies have been more successful in diversifying fund risk compared to the banks.
Table 4-2: t-Test Standard Deviation
t-Test: Two-Sample Assuming Equal Variances STD NB STD B Mean 0,0609 0,0629 Variance 0,0000 0,0000 Observations 16 17 Pooled Variance 0,0000
Hypothesized Mean Difference 0
df 31
t Stat -2,4986
P(T<=t) one-tail 0,0090
t Critical one-tail 1,6955
4.3
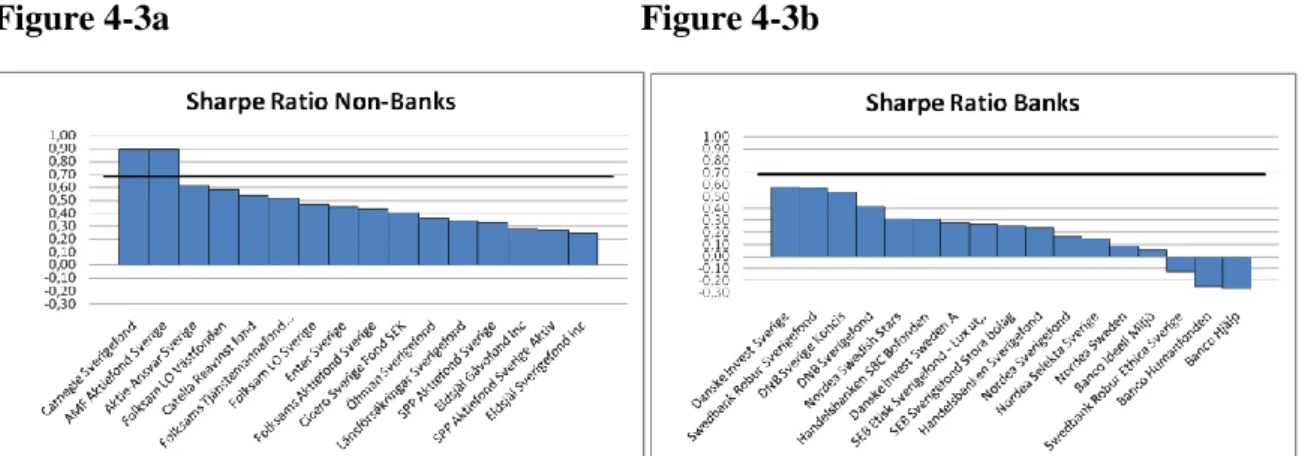
Sharpe Ratio
Investigating the Sharpe ratios for the funds during the period we can see that the return per unit of risk is positive for the majority of funds in our sample. However, there are three funds that do not succeed in reaching a positive Sharpe ratio and therefore does not generate an average return greater than the risk-free asset. The funds related to a negative Sharpe ratio are Banco Hjälp, Banco Humanfonden and Swedbank Robur Ethica.
Results
According to this ratio the best performing funds are AMF Aktiefond Sverige and Carnegie Sverigefond. They both managed to reach a Sharpe ratio that is close to one and beating the market with a Sharpe ratio of 0,69, represented by a straight line in Figure 3a and Figure 4-3b.
Figure 4-3a Figure 4-3b
Through an in depth study of the figures we can observe that the bank managed funds generally have a smaller Sharpe ratio compared to the funds managed by other fund companies. We notice that the four worst performing funds are all managed by Swedbank even though three of them are held by Banco.
4.3.1 Significance Test – Sharpe Ratio
Where µSHARPE NB is the average Sharpe ratio of the other fund company group and µSHARPE B
is the average Sharpe ratio of the bank group. On a 95% significance level we are able to reject the null hypothesis that in our sample, the other fund companies are generating lower or equal Sharpe ratios as the banks. The null hypothesis can be rejected because of a p-value of 0,0011 that is smaller than α of 0,05. Further this can be supported by a t-statistic of 3,33 that is greater than the critical t-value of 1,69 and therefore falls inside the rejection area. This means that, according to our t-test the other fund companies have outperformed their bank counterparts in terms of Sharpe ratio.
Results
Table 4-3: t-Test Sharpe Ratio
t-Test: Two-Sample Assuming Equal Variances Sharpe Ratio NB Sharpe Ratio B Mean 0,4763 0,2098 Variance 0,0385 0,0658 Observations 16 17 Pooled Variance 0,0526
Hypothesized Mean Difference 0
df 31
t Stat 3,3365
P(T<=t) one-tail 0,0011
t Critical one-tail 1,6955
4.4
RAP – Risk Adjusted Performance
Studying the result from the calculations of Risk Adjusted Performance from Figure 4-4a we can see that only two funds are able to outperform the index benchmark. The benchmark is illustrated by the straight line in Figure 4-4a and Figure 4-4b at a RAP level of 0,0643. The two funds succeeding to beat the market index are AMF Aktiefond Sverige and Carnegie Sverigefond and are both sorted into the other fund company group. There are three funds that relative to the majority of funds have been performing inferior, these are Banco Hjälp, Banco Humanfonden and Swedbank Robur Ethica Sverige and are sorted in the bank group.
Figure 4-4a Figure 4-4b
4.4.1 Significance Test – Risk Adjusted Performance
Where µRAP NB is the average RAP of the other fund company group and µRAP B is the average
RAP of the bank group. The outcome of the t-test is shown in Table 4-4. On a 95% significance level we can reject the null hypothesis, that the other fund companies generate less or equal the return as banks. We are able to reject the null hypothesis because of a p-value of 0,0013 that is smaller than the α of 0,05. This is also supported by a t-statistic of 3,2645 which is greater than the critical t-value of 1,6955, hence it falls in the rejection area. This
Results
means that in our sample, the other fund companies have outperformed the banks in terms of the risk adjusted performance measurement.
Table 4-4: t-Test RAP
t-Test: Two-Sample Assuming Equal Variances
RAP NB RAP B
Mean 0,0520 0,0363
Variance 0,0001 0,0003
Observations 16 17
Pooled Variance 0,0002
Hypothesized Mean Difference 0
df 31
t Stat 3,2645
P(T<=t) one-tail 0,0013
t Critical one-tail 1,6955
4.5
Jensen´s Alpha
In Figures 4-5a and 4-5b the results of the Jensen’s alpha calculations are presented. Only two funds in our sample managed to generate a value over zero, meaning they generated excess return. These funds are AMF Aktiefond Sverige and Carnegie Sverigefond. The other funds all generated negative values of Jensen’s alpha meaning they did not manage to generate abnormal returns. Three funds are related to higher negative values than all the others, these are Banco Hjälp, Banco Humanfonden and Swedbank Robur Ethica Sverige. From the picture we can also see that the funds in the bank group tend to have lower values of Jensen’s alpha compared to their counterpart.
Figure 4-5a Figure 4-5b
4.5.1 Significance Test – Jensen’s Alpha
Where µJ-α NB is the average Jensen’s alpha of the other fund company group and µJ-α B is the
average Jensen’s alpha of the bank group. With a 95% significance level, we can reject the null hypothesis, that other fund companies than banks are related to equal or lower values of Jensen’s alpha as the banks. The rejection of the null hypothesis is possible because of a
p-Results
value of 0,0013 that is smaller than the α of 0,05, also the t-statistic of 3,2858 exceeds the critical t-value of 1,6955 meaning it falls in the rejection area. The rejection implies other fund companies being related to higher Jensen’s alpha compared to the banks.
Table 4-5: t-Test Jensen’s Alpha
t-Test: Two-Sample Assuming Equal Variances Jensen's Alpha NB Jensen's Alpha B Mean -0,0010 -0,0022 Variance 0,0000 0,0000 Observations 16 17 Pooled Variance 0,0000
Hypothesized Mean Difference 0
df 31
t Stat 3,2858
P(T<=t) one-tail 0,0013
t Critical one-tail 1,6955
4.6
Beta
In Figure 4-6a and Figure 4-6b, beta for each fund is illustrated during the period from 2002 to 2012. As we can see the majority of the funds have a beta near 1 indicating that the funds included in the study moves approximately as the market does. The fund with the highest beta is Nordea Selekta Sverige with a beta of 1.085 and the fund with the lowest beta is Carnegie Sverigefond with a beta of 0.87.
Figure 4-6a Figure 4-6b
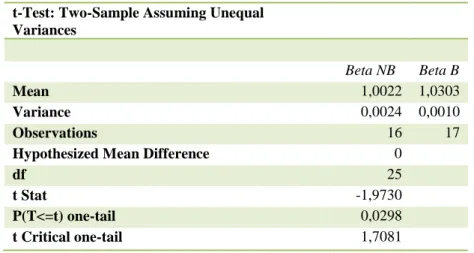
4.6.1 Significance Test – Beta
Where µβ NB is the average market beta of other fund companies and µβ B is the average
market beta of banks. On a 95% significance level we can reject the null hypothesis, that other fund companies in general are more sensitive to market fluctuations than the banks. We can
Results
a t-statistic of -1,9730 that is lower than the critical t-value of -1,7081, hence it falls in the rejection area. This means that the funds provided by other fund companies are not as sensitive to changes in the market as the funds managed by banks.
Table 4-6: t-Test Beta
t-Test: Two-Sample Assuming Unequal Variances
Beta NB Beta B
Mean 1,0022 1,0303
Variance 0,0024 0,0010
Observations 16 17
Hypothesized Mean Difference 0
df 25
t Stat -1,9730
P(T<=t) one-tail 0,0298
t Critical one-tail 1,7081
4.7
T-test Summary
We were able to reject all six null hypothesises on a 95% significance level, meaning that from every aspect the non-bank funds have managed to outperform their bank counterpart.
4.8
Performance 2007-2009
We wanted to study the fund’s performance before, during and after the main period of the financial crisis. To do this we decided to compare the four best performing funds with the four worst performing funds (Table 4-7), over the total period. According to our calculations (see appendix 6 and 7) we could see that the funds shown in Figure 4-7 and Figure 4-8 are similar in Sharpe and RAP ratios. During 07 and 08 all of them had negative ratios while during -09 they had positive ratios.
Table 4-7: Top & Bottom Performing Funds
Top 4 Bottom 4
AMF Aktiefond Sverige Banco Hjälp
Carnegie Sverigefond Banco Humanfonden
Aktie-Ansvar Sverige Swedbank Robur Ethica Sverige
Results
Figure 4-7 Yearly Sharpe Ratio 2007-2009
Figure 4-8 Yearly RAP 2007-2009
4.9
Security Market Line
Considering the previously mentioned performance measurements such as the Sharpe Ratio, the RAP and Jensen’s alpha we can notice that the same funds appear as the strongest and weakest over and over again in the sample group. These are presented in Table 4-7.
By comparing these funds with the Security Market Line (Figure 4-9) we can view how these funds have performed relative to the systematic risk (Beta). The only funds that are outperforming the market and therefore appear above the SML in the model are AMF Aktiefond Sverige and Carnegie Sverigefond. As can be seen in the graph, the systematic risk exposed to the investor in AMF Aktiefond Sverige is at the same level of risk exposed in Banco Humanfonden, and even higher in Banco Hjälp. However, the expected return of AMF Aktiefond Sverige is the double.
Results
Analysis
5
Analysis
In this section we will analyse the outcome of the empirical results. First we will look closer into the different performance and risk measurements to see if there is a difference between the individual funds and the market. We will also see how well this fits with the models concerning the focus of this study.
From the empirical results in Figure 4-1, it becomes clear that almost all actively managed equity mutual funds included in our study unsuccessful in outperforming the market. Hence, they are failing to fulfil the aim with the active management strategy, to beat the market. This is consistent with the assumption of the Efficient Market Hypothesis, in the long run beating the market should not be possible.
By looking only at the funds accumulated return we are not taking the risk factor into account. However, the accumulated return gives us an understanding of the overall performance and development of the funds. In this case it helps us reach the conclusion that the overall returns of bank managed funds has been somewhat lower than the overall return of their non-bank counterpart. This is also confirmed by the conducted t-Test and the rejection of the null hypothesis. Hence, we can state that the managers of fund companies other than banks have succeeded in generating higher accumulated return compared to banks. That is, for the other fund companies the NAV rates including dividends have been generating an overall greater return during the period. Since a measurement of pure return does not take risk into account we cannot draw any conclusions about the risk-adjusted performance of the funds. We need to consider other measurements that make adjustments for the risk factors.
Moving on to one of the risk factors related to the funds, we can conclude from the result that every fund has been successful in the risk management considering unsystematic risk. During the 10 year period of investigation the overall unsystematic risk is low and the difference between the funds related to the highest and lowest risk is only 1,3%. As we can see from the significance testing, non-bank funds are related to significantly lower risk compared to bank funds. Due to the overall low standard deviation values, we can conclude that each fund in our sample is successful in diversifying risk.
Looking at the picture from an Efficient Portfolio point of view we can state that the majority of funds have succeeded in minimizing variance but not in maximizing return and can therefore not be considered MVPs. According to the assumption of the modern portfolio theory, stating that investors are rational and risk averse, the majority of funds should not be prospects for a potential investment. This, since they do not offer a return relative to the exposed risk and the fact that there are better funds to choose from.
The fact that systematic risk cannot be reduced through diversification, and that unsystematic risk is roughly the same for the different funds, makes the impact of beta as a risk factor more noteworthy. The majority of the funds have a beta close to one, meaning they succeeded in following market fluctuations. However, Nordea Selecta Sverige, Swedbank Robur Ethica Sverigefond and Catella Reavinstfond are considered more sensitive to changes in the market
Analysis
Aktie-Ansvar Sverige and Cicero Sverigefond and therefore are less sensitive to market changes. At this point we can distinguish that Carnegie Sverigefond has potential to be one of the top performing funds in our sample because of the relatively high accumulated return and a lower beta value. Analysing the outcome of the beta significance test we can conclude from a statistical point of view that the bank managed funds are in general more sensitive to changes in the market benchmark. Therefore, the bank managed funds are related to higher systematic risk.
As the accumulated return is not a sufficient measurement when considering performance, the more frequently used Sharpe ratio is a more viable measurement. Since it allows us to make a comparison between funds investing in the same market we can make a number of statements regarding this ratio. The only two funds succeeding in beating the market are managed by the non-bank fund companies AMF and Carnegie. We can also conclude that these funds do not only perform superior to the market, they perform superior to all the other funds. There are three funds that are noticeable in a negative course since they are showing negative Sharpe ratios. These funds are managed by the banks Nordea and Swedbank. Comparing the average Sharpe ratio of other fund companies with the average Sharpe ratio of banks by conducting a t-Test, a statistical conclusion can be made. The funds managed by other fund companies have managed to outperform the funds managed by banks in Sharpe ratio.
As RAP works as an extension of Sharpe ratio we can presume this measurement to follow the result from the Sharpe ratio tests. After adjusting the risk of all the funds to match the market risk, the picture is even clearer. As the funds are adjusted to the same risk-scale in terms of performance, the distinction between top and bottom performing funds is even fairer. As the only two funds beating the market according to this measurement are the same two funds that according to the Sharpe ratio also succeeded in this, we can conclude that investing in these funds have been rewarding during the time frame of this study. However, a conclusion that investing in funds managed by non-banks is more profitable than investing in bank managed funds cannot be made without executing a significance test. According to this test, investing in funds managed by other fund companies have with respect to the unsystematic risk been more lucrative than investing in similar funds managed by banks. A positive Jensen´s alpha indicates that the fund has performed abnormal returns. Based on the model that solely consider systematic risk as a risk factor, the funds that have performed abnormal return are shown to handle the level of risk taken better than those who have not performed abnormal return. According to our empirical section, only two funds managed to perform such returns, indicating a higher return than the expected. This also indicates that, given the level of beta risk, equity mutual funds in general do not generate abnormal returns. The eight worst performing funds according to the Jensen’s alpha are all managed by banks and are related to a negative beta below -0,002. The six funds indicating an alpha higher than -0,0005 are all managed by other fund companies with the exception of Danske Invest. With a rejection of the null hypothesis defining Jensen’s alpha of funds managed by other fund companies are equal or smaller than the Jensen’s alpha of bank managed funds, we can state